© 2017, IRJET | Impact Factor value: 5.181 | ISO 9001:2008 Certified Journal
| Page 3460
Optimization of Cutting Parameters for surface roughness and MRR in
CNC Turning of 16MnCr5
Jitendra Kumar Verma
M. Tech Student, Department of Mechanical Engineering, Geeta Engineering College, Panipat, Haryana, India
---***---
Abstract -
The aim of this research work is to investigate the effects of cutting parameters such as cutting speed, feed rate and depth of cut on surface roughness and MRR in CNC dry turning of 16MnCr5 material which is case hardening steel with the help of Design of Experiments. Experimental work has been carried out based on Taguchi L9 orthogonalarray design with three cutting parameters. Optimal cutting conditions for surface roughness and MRR were determined using the signal-to-noise (S/N) ratio which was calculated for roughness average (Ra) and MRR according to the
smaller-the-better and larger the better approach. The experimental results were analyzed by using main effects plots and response tables for S/N ratio. Result of this study shows Depth of cut has highest effect on surface roughness followed by speed and Feed rate has lowest effect on surface roughness.
Keywords: Turning, Surface Roughness, MRR, Taguchi, Regression, ANOVA
1. INTRODUCTION
Quality of a machine part depends on parameters like surface roughness, dimensional accuracy, tolerance zone etc. A component which has good surface finish always subjected to low wear and tear during its functioning and also offer low friction between two touching surfaces because it provides low value of friction coefficient and reduces the requirement of lubrication, and generates low heat, means chances to change property of component due to heating reduces. For reducing machining time and cost of production it is necessary that the material removal rate (MRR) during machining should be high. Due to all of the above reasons a manufacturer always tries to produce a machine component with minimum surface roughness and high MRR.
© 2017, IRJET | Impact Factor value: 5.181 | ISO 9001:2008 Certified Journal
| Page 3461
Fractional Factorial design method based on orthogonal array. In general main effects and interaction of two factors is considered and it is assumes that some higher order interactions are not much important. This method is used to find best set of values of controllable factors to make the design less sensitive with variation of noise, means Taguchi make a design more robust.
2.1 Signal-to-Noise ratio:
Main performance measuring character of Taguchi is signal-to-Noise ratio or simply known as S/N ratio. It is used to reduce variation of signal and to optimize the input factors for producing best possible response. There are three possible cases for S/N ratio calculation-i) Smaller-the-Better:
It is used to minimize the response, means where output is undesirable.⌊
∑ ⌋
ii) Larger-the-Better:
This is used to maximize the response, means where output is desirable.[
∑ ]
iii) Nominal-the-Better:
This is used when neither a smaller and nor a larger value is required for response.⌊
̅ ⌋
Where:
Measured output data of experiment Measured output data of ith experiment ̅ Mean of measured output data of experiments
σ Standard deviation σ2 Variance
3. ANALYSIS OF VARIANCE
It is also known asANOVA. It is used to check whether means of more than two set quantities are equal or not with the help of F-test. It is a statistical tool applied on result of Taguchi experiment to determine percentage contribution of factors. It use S/N ratio of Taguchi method for this calculation.
4. MATERIAL SELECTION
Workpiece material used in presented work is 16MnCr5 which is a low alloy case hardening steel. It is used for the purpose of toughness and wear resistance. This material is used to manufacture camshaft, axle and crankshaft.
Table -1: Chemical composition of 16MnCr5
C % Mn % Si % P % S % Cr % 0.14 to 0.19 1.00 to 1.30
© 2017, IRJET | Impact Factor value: 5.181 | ISO 9001:2008 Certified Journal
| Page 3462
Fig -1: Workpiece Material5. FACTORS AND THEIR LEVELS
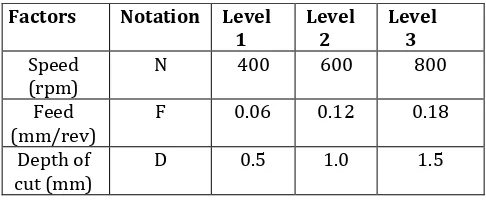
[image:3.595.176.419.318.418.2]Cutting speed in rpm, feed in mm/rev and depth of cut in mm selected as factors for design of experiment and roughness of machined surface as response.
Table -2: Factors and their levels
Factors Notation Level
1 Level 2 Level 3 Speed
(rpm) N 400 600 800
Feed
(mm/rev) F 0.06 0.12 0.18 Depth of
cut (mm) D 0.5 1.0 1.5
6. SELECTION OF ORTHOGONAL ARRAY
For design of experiment by using Taguchi method we select a L9 array. Total number of experiments performed in
experimental work is equal to 9.
Table -3: Taguchi L27 orthogonal array
Sl.
No. Speed (rpm) (mm/rev) Feed Depth of Cut (mm)
1 400 0.06 0.5
2 400 0.12 1.0
3 400 0.18 1.5
4 600 0.06 1.0
5 600 0.12 1.5
6 600 0.18 0.5
7 800 0.06 1.5
8 800 0.12 0.5
9 800 0.18 1.0
7. EXPERIMENTAL PROCEDURE
[image:3.595.178.418.510.665.2]© 2017, IRJET | Impact Factor value: 5.181 | ISO 9001:2008 Certified Journal
| Page 3463
Fig -2: Steps in experimental work7.1 CNC Lathe Machine
[image:4.595.178.421.359.511.2]Machine used in turning operation is CNC universal turning machine MIDAS 8i manufactured by GALAXY MACHINARY PVT. LTD. Turning operation is carried out on this machine, a dry environment is chosen because of environment safety.
Fig -3: CNC Midas 8i
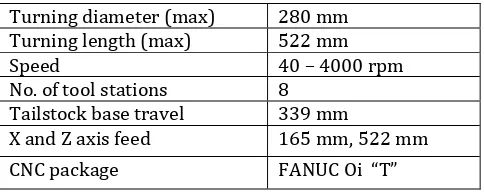
Table -4: Specifications of CNC lathe used
Turning diameter (max) 280 mm Turning length (max) 522 mm
Speed 40 – 4000 rpm
No. of tool stations 8 Tailstock base travel 339 mm
X and Z axis feed 165 mm, 522 mm CNC package FANUC Oi “T”
7.2 Cutting insert
[image:4.595.178.420.558.654.2]© 2017, IRJET | Impact Factor value: 5.181 | ISO 9001:2008 Certified Journal
| Page 3464
Fig -4: Cutting Insert7.3 Surface roughness tester
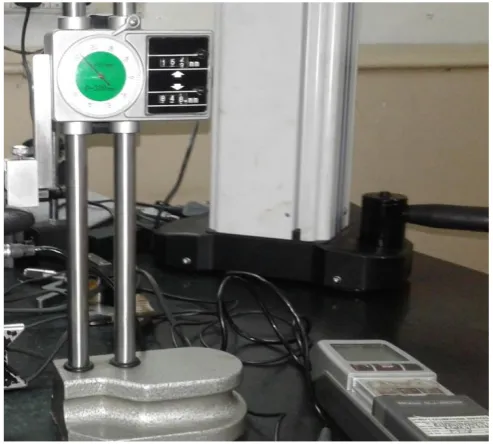
[image:5.595.176.421.85.227.2]It is used to measure the roughness of surface. Surface roughness tester used in this research work is Surftest SJ – 201P manufactured by Mitutoyo Company which is a stylus probe type instrument and its detector is in detached form from the display.
Fig -5: Surface roughness tester
Table -5: Specifications of surface roughness tester
Measuring speed 0.25 mm/s
Evaluation length 12.5 mm
Sampling length 0.25 mm, 0.80 mm, 2.5 mm
Cut-off length 0.25 mm, 0.80 mm, 2.5 mm
Measuring range -200 µm to 150 µm
Stylus material Diamond
Stylus tip radius 5 µm
[image:5.595.175.422.332.554.2]© 2017, IRJET | Impact Factor value: 5.181 | ISO 9001:2008 Certified Journal
| Page 3465
2 400 0.12 1.0
4.96
4674.7
-13.9096
73.3950
3 400 0.18 1.5
1.76
10348.4
-4.9103
80.2975
4 600 0.06 1.0
3.99
3506.0
-12.0195
70.8963
5 600 0.12 1.5
1.07
10348.4
-0.5877
80.2975
6 600 0.18 0.5
4.58
5343.8
13.2173
74.5571
7 800 0.06 1.5
2.05
6898.9
-6.2351
76.7756
8 800 0.12 0.5
1.84
4750.1
-5.2964
73.5340
9 800 0.18 1.0
1.44
14024.1
-3.1672
82.9375
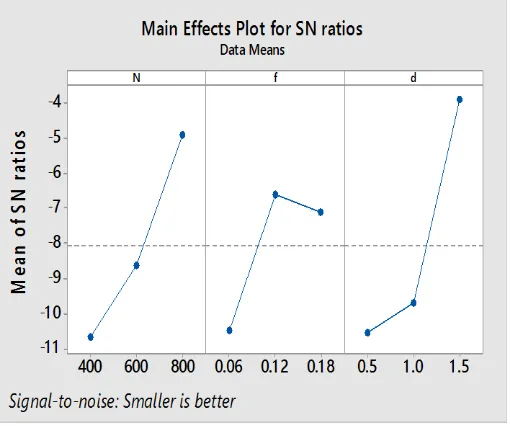
8.1 Taguchi Analysis: Ra versus N, f, d
Response Table for Signal to Noise Ratios Smaller is better
Level N f d
[image:6.595.53.543.177.336.2]1 -10.654 -10.465 -10.552 2 -8.608 -6.598 -9.699 3 -4.900 -7.098 -3.911 Delta 5.754 3.867 6.641 Rank 2 3 1
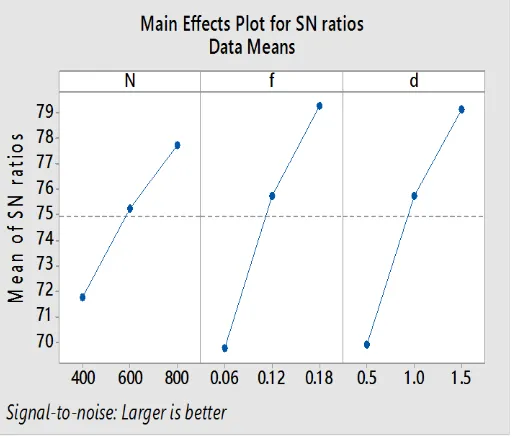
Fig -6: SN Ratio plot for surface roughness (Ra)
[image:6.595.172.427.492.705.2]© 2017, IRJET | Impact Factor value: 5.181 | ISO 9001:2008 Certified Journal
| Page 3466
Regression Analysis: Ra versus N, f, dRegression Equation
Ra = 8.84 - 0.00494 N - 7.78 f - 2.027 d
Coefficients
Term Coef SECoef T-Value P-Value VIF Const. 8.84 1.92 4.61 0.006
[image:7.595.175.422.264.492.2]N -0.00494 0.00228 -2.17 0.082 1.00 f -7.78 7.60 -1.02 0.353 1.00 d -2.027 0.912 -2.22 0.077 1.00
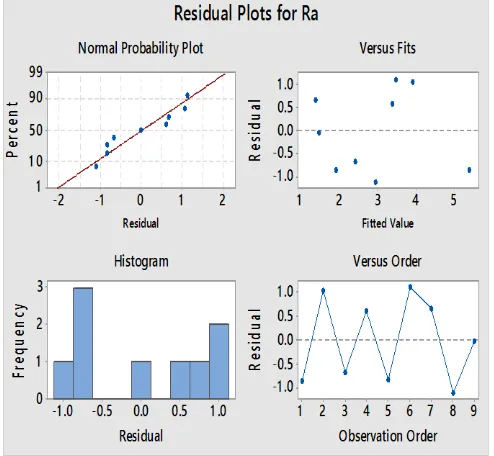
Fig -7: Residual plot for Ra
ANOVA for Ra
General Linear Model: Ra versus N, f, d
Analysis of Variance
Source DFAdj SS Adj MS F-Value P-Value N 2 6.263 3.1314 1.53 0.396 f 2 1.688 0.8440 0.41 0.708 d 2 7.517 3.7584 1.83 0.353 Error 2 4.100 2.0502
Total 8 19.568
Model Summary
S R-sq R-sq(adj) R-sq(pred) 1.43184 79.05% 16.18% 0.00%
© 2017, IRJET | Impact Factor value: 5.181 | ISO 9001:2008 Certified Journal
| Page 3467
[image:8.595.172.429.247.466.2]Rank 3 1 2
Fig -8: SN Ratio plot for MRR
Signal to noise ratio for MRR is increase with increase in speed, feed, and depth of cut.
Regression Analysis: MRR versus N, f, d
Regression Equation
MRR = -9424 + 7.89 N + 50344 f + 5438 d
Coefficients
© 2017, IRJET | Impact Factor value: 5.181 | ISO 9001:2008 Certified Journal
| Page 3468
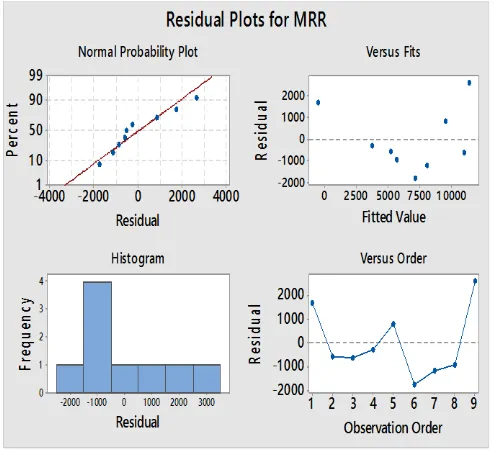
Fig -9: Residual plot for MRRANOVA for MRR
General Linear Model: MRR versus N, f, d
Analysis of Variance
Sor. DFAdj SS Adj MS F-Value P-Value N 2 15598632 7799316 1.11 0.473 f 2 54918162 27459081 3.93 0.203 d 2 46059714 23029857 3.29 0.233 Error 2 13990919 6995459
Total 8 130567427
Model Summary
S R-sq R-sq(adj) R-sq(pred) 2644.89 89.28% 57.14% 0.00%
From ANOVA it is clear that feed (P = 0.203) has highest effect on surface roughness. Second highest effective factor is depth of cut (P = 0.233) and speed (P = 0.473) has least effective factor for surface roughness
.
9. CONCLUSION
On the basis of presented research work, we can made following conclusion-
Depth of cut has highest effect on surface roughness followed by speed and Feed rate has lowest effect on surface roughness.
Minimum surface roughness is obtained at speed 800 rpm, feed 0.12 mm/rev and depth of cut 1.5 mm.
Surface roughness obtained corresponding to optimum cutting parameters by using regression equation was 0.9139 µm.
Feed has highest effect on MRR followed by depth of cut and speed has lowest effect on surface roughness.
Maximum MRR is obtained at speed 800 rpm, feed 0.18 mm/rev and depth of cut 1.5 mm.
© 2017, IRJET | Impact Factor value: 5.181 | ISO 9001:2008 Certified Journal
| Page 3469
[4] E. S. Kumar, P. S. K. Sharma.(2014).Optimization of Material Removal Rate in Cnc Turning of Mild Steel 1018 Using Taguchi Method, Int. J. Engg. Res. and Application.4(4):69-73.
[5] I. Asilturk, M. Çunkas.(2011).Modeling and predication of Surface Roughness in truing operations using artificial neural network and multiple regression method, Expert System with Applications.38:5826-5832.
[6] Ilhan Asilturk, Harun Akkus.(2011).Determining the effect of cutting parameters on surface roughness in hard turning using the Taguchi method, Measurement.44:1697-1704.
[7] Nilrudra Mandal, B. Doloi, B. Mondal, Reeta Das.(2011).Optimization of flank wear using Zirconia Toughened Alumina (ZTA) cutting tool using Taguchi method and Regression analysis, Measurement.44:2149–2155.
[8] A. Mohanty, G. Talla, S. Dewangan, S. Gangopadhyay.(2014).Experimental study of material Removal rate, surface roughness & Microstructure in electrochemical Machining of Inconel 825,5th International & 26th All india Manf.
Tech. Design and res. conference:174(1-6).
[9] H. Aouici, M. A. Yallese, B. Fnides, K. Chaoui, T. Mabrouki.(2011).Modeling and optimization of hard turning of X38CrMoV5-1 steel with CBN tool: machining parameters effects on flank wear and surface roughness, J. Mech. Sci. Technol.25(11):2843-2851.