1
On the Social Organization of the
Commons -
An Analytical Framework
Preliminary version, November 2020
Jorge Marcoa and Renan Goetzb Abstract
We study a game where agents form part of a complex social network and have to decide to adhere or not to a social norm in relation with a social dilemma. Based on moral ties, we develop an analytical approach that allows to signposts the minimal and maximal influence different types of social networks have on the agents’ decision profile. We find that equilibria are locally stable within the area of network influence and their stability is augmented when informal enforcement entails costs. We determine conditions that inform policy-makers about the availability of legal and informal policy options and their effectiveness for promoting cooperativeness. The design of optimal legal and informal enforcement policies shows that less-substantial interventions are required if social networks are considered. We also show that albeit a very high share of norm-complying agent cooperativeness is unlikely to prevail if social dilemmas are perceived as not severe.
Keywords: Cooperation, informal enforcement, moral ties, social dilemma, social networks. JEL Classification: C71, D85, Q25
a) J. Marco, University of Los Andes, Cra 1 Nº 18A - 12, 111711 Bogotá, Colombia b) R. Goetz, University of Girona, Carrer de la Universitat, 10, 17003 Girona, Spain
We would like to thank Santiago Rubio, Tomás Rodríguez Barraquer, Matthew Jackson and the participants of the 4th Annual Conference on Network Science and Economics, the 6th World Congress of Environmental and Resource Economists, the 24th Annual Conference of the European Association of Environmental and Resource Economists and the 3rd AERNA workshop on Game Theory and Environment for their helpful comments.
2 I. Introduction
Why do we observe some communities cooperating to solve social dilemmas like producing public goods or extracting common property resources and others not? Attributes of a community or of a public good that favor cooperation have been analyzed intensively in political science, psychology, sociology, and economics (Wenegrat et al. 1996, Ostrom 2000b, Ostrom et al. 2002, Nowak 2006, Hanaki et al. 2007, West et al. 2007). Sustained cooperation is traditionally explained by compliance with social norms (Fehr et al. 2002, Fehr and Gächter 2002, Fehr and Gintis 2007). The decision to comply with social norms is voluntary if governments or communities have no power to enforce them or if it is too costly to rely on their legal or formal establishment. However, agents that adhere to social norms may apply social pressure on agents who do not adhere (Fehr et al. 2002, Ali and Miller 2016).
Understanding how social norms emerge and prevail represents an important challenge in economics. Frequently, the literature considers social norms as exogenous and does not clarify why certain behavior becomes predominant and turns into a social norm (Elster 1989, Bicchieri 1990). As a possible explanation social scientists and economists suggest that the formation of social norms is the endogenous product of social interactions (Ullmann-Margalit 1977, Axelrod 1986, Ostrom 2000a, Bicchieri and Muldoon 2014). The economic literature (Bramoullé and Kranton 2007, Jackson 2014, Acemoglu and Jackson 2017) identified the structure of social interactions (often referred as a social network) as a driving factor for the emergence and perseverance of social norms.
The literature on direct reciprocity for instance in form of social pressure suggests that repeated interaction can alleviate the social dilemma but previous work has assumed that the public good or common property resource is constant over time (Grujic et al. 2012, García and van Veelen 2016, Hilbe et al. 2018a). However, more realistic seems the case that the severity of the social dilemma as a result of the state of the public good or common property ameliorates with more cooperation and deteriorates with less cooperation. Thus, sustained cooperation allows realizing cooperative gains in the long-run that cannot be realized otherwise whereas non-cooperation leads over time to a lower stream of payoffs. Taking account of the severity of the social dilemma is underlined by a recent study by Hilbe et al. (2018b). They found that the interaction between reciprocity and payoffs related to the severity of the social dilemma is crucial: neither repeated interactions in a constant environment nor single interactions in a changing environment yield similar cooperation rates.
In this paper, we offer a qualitative and quantitative description of the combination of the characteristics of social networks, the severity of the social dilemma and the behavior of the agents
3 that favor cooperativeness. We present an analytical framework for studying the evolution and prevalence of a social norm based on the dynamics of two interdependent systems: a social system (a community of resource-extracting-agents presented by a social network) and a natural system (a renewable common property resource). For a wide range of different social networks the analytical framework allows studying the scope of cooperation, the design of policies and offers answers to the following two questions:
1) Economists widely agree that social interactions are important for market outcomes and for cooperation in particular. However, the question: “To what extent the presence of social interactions and its underlying pattern (type of social network) influence equilibrium outcomes and cooperativeness” has received very little attention. The economic literature has introduced the concept of a tipping point which refers in our case to the minimum share of norm-complying agents needed to induce cooperativeness among all agents (de Zeeuw and Li 2016, Nyborg et al. 2016). However, tipping points, based on the share of norm-complying agents alone, are usually an imprecise predictor for cooperativeness (Chaudhuri 2011, Tavoni et al. 2012). By taking account of the agents’ rationality, the characteristics of the social network and the agents’ perception of the severity of the social dilemma we do not a obtain tipping point but rather a set of frontier lines. Based on a qualitative analysis, we determine the size of this set and signpost the maximal and minimal influence different types of social networks exercise on the use of common property resources and cooperativeness. We show that locally stable second-best solutions where norm-complying and non-norm-norm-complying agents coincides only exists within the area of network-influence. The stability of second-best solutions is augmented when social pressure is costly. The determination of the area of network influence open the door for network-orientated policies designed to increase cooperativeness by informal enforcement. These policies may comprise the foundation of a norm-complying user association, support of norm-complying agents by training workshops or other forms of privileges granted. The aim of this policy is to enhance cohesiveness among norm-complying agents and thereby increasing the peer pressure on non-norm-complying agents.
2) In this paper, we also attempt to offer an answer to the following question: “Under what conditions legal or informal enforcement policies are available to policy makers, are effective and how are they designed optimally? The paper determines initial conditions where only (i) legal enforcement, (ii) legal and informal enforcement and (iii) no enforcement policy at all are efficient policy options. Moreover, the analysis shows how the different policy options have to be designed
4 in order to achieve full cooperation. The results show that legal enforcement requires less-substantial interventions when social networks are taking into account. For example, the framework allows determining the number of non-compliers that need to be fined compared to the case where social networks are not considered. In the case of informal enforcement, the study allows determining the required increase in cohesiveness to attain a stable equilibrium with full cooperation. Yet, as shown in this paper, one has to keep in mind that a high number of norm-complying agents does not guarantee that an equilibrium where all agents are norm-complying is achieved it the severity of the social dilemma or scarcity of the resource is considered as not severe.
The paper is organized as follows. Section II explains the rationale of the modeling approach. In Section III we introduce the different elements of the economic framework, and in Section IV the concept for an analytical approach. In Section V we analyze the qualitative characteristics of the bioeconomic system. In Section VI we compare different enforcement policies to support equilibria and in section VII we analyze the effect of small changes in the policy instruments on the sustainable level of cooperativeness. Finally, in Section VI we draw some conclusions.
II. The rationale of the modeling approach
Within the framework of repeated non-cooperative games economists studied the behavior of agents within social networks (Haag and Lagunoff 2006, Jackson 2016). The results of these studies show that when agents have the opportunity to punish free riders, cooperation can be sustained, especially in small networks, but their applicability to real-life situations is limited because equilibria are mostly found on the basis of grim trigger strategies within the set-ups of infinitely repeated prisoner dilemma type games (Jackson 2016). Experimental works (Watabe 1992), field studies (Ostrom 1994) and theoretical models (Sethi and Somanathan 1996) found that successful cooperation is not based on grim trigger strategies because agents are leery of adopting such risky strategy in their community (Kollock 1998).
In contrast to the approach of repeated non-cooperative games, the framework of evolutionary games (Smith and Price 1973) assumes well-mixed communities where every agent is connected with all other agents (complete network). Moreover, it recognizes that agents frequently do not act fully rational. Bounded rationality seems reasonable if the social network is either large or topologically complex. Our study takes account of the complexity, vicinity and segregation patterns that occur between agents when interacting in a real-world social networks (Jackson et al. 2017). Determining the optimal strategic response to, for instance, thousands of other agents (each of whom
5 occupies a unique position in the social network), could stretch the assumption of rationality beyond its limits due to the complexity of the strategic decision problem.
There is a wealth of literature on social networks (Karlan et al. 2009, Jackson et al. 2012, Tavoni et al. 2012, Currarini et al. 2015) that studies the ability of a community to promote cooperativeness through reputation, trust or social pressure. In the case of social pressure, an agent that does not comply with the social norm (referred to as defector) might be exposed to social pressure from their neighbors who are complying with the norm (referred to as compliers). However, the share of compliers alone is a poor indicator for social pressure as it does not consider to what extent compliers can coordinate their action in order to augment social pressure on defectors. Thus, in the case of cooperativeness and the presence of social pressure, not only is the agents’ behavior important (Tabellini 2008, Tavoni et al. 2012) but also the characteristics of the social network (Jackson 2016).
The economic literature has identified characteristics of social networks such as (i) total number of social interactions or “network density” (Karlan et al. 2009, Currarini et al. 2015), (ii) total number of agents or “network size” (Nagendra 2007, Wolitzky 2013, Currarini et al. 2015) or (iii) “the tightness of the knit” (Tabellini 2008, Enke 2019) as driving factors for cooperation. Karlan et al. (2009) refer to the network density as being responsible for strengthening the effectiveness of trust to generate and support cooperativeness. However, while network density and size are well defined on their own, there is no single metric for any social network that considers these often-diametrical characteristics. The remarkable studies by Tabellini (2008) and Enke (2019) underscore the importance of tightly-knit networks for achieving adherence to social norms. Their studies are based on either the attributes of the agents (tightness of kinship, (Enke 2019)) or the geographical distance between agents (Tabellini 2008). While these elements give rise to the notion of tightly-knit network, they do not help to define its topological structure. Most importantly, these three characteristics of social networks are mostly independent of the agents’ behavior. In these studies, agents are only influenced by their neighbors’ attributes or by the distance that separates them from their neighbors, however, their neighbor’s choices (like adhering to the social norm or not) do not influence the agent’s behavior.
In view of these observations, we employ the concept of moral ties proposed by Marco and Goetz (2020). It is based on the agents’ behavior and local cohesiveness (Coleman 1988, Jackson 2016)
6 of a social network.1 The agents’ behavior is reflected by the share of the compliers of agent i's neighborhood, and local cohesiveness measures to what extent the neighbors of agent i are connected among each other (friends of my friends are also my friends). The concept of moral ties make use of a refinement of local cohesiveness as it measures to what extent the neighbors of agent i that are compliers are connected among each other, i.e., it only considers the neighbors of agent i that are compliers and not all neighbors. In this way it defines the maximal capability of compliers to interact with each other and to take collective actions if agent i is a defector (Coleman 1988). Trust and homophily (birds of a feather flock together) favor the decision to take collective action (Coleman 1988, Currarini et al. 2010, Bramoullé et al. 2014), but moral ties are a prerequisite (Coleman 1988) and as such it is important for the propagation and prevalence of a cooperation. For example, imagine a group of three agents (a triad) in which two agents are compliers and the third is a defector. If the three agents are connected (closed triad), one can expect (Coleman 1988) that compliers will exercise greater social pressure than if every complier were connected to a defector, but a link between compliers does not exist (open triad). In this case, compliers cannot coordinate their action because they are not connected.
The level of the remaining stock of the common property resource affects the agents’ payoff. The remaining stock s is limited above by smax 0 (abundance), and s=0 indicates depletion. As the number of defectors within the community increases the extraction of the resource is intensified. The remaining stock not only indicates the amount of the resource left but is also a synonym for the severity of the state of the social dilemma. Thus, both; the remaining level of the natural resource and the strength of moral ties affect the intensity of the social pressure exercised (Folke et al. 2005, Ostrom 2008, Armitage et al. 2009).
Based on individual choices to adhere to a social norm or not, we present the basis for the economic model in the following section. It offers an analytical framework that combines elements of evolutionary economics and social networks that accounts for the dynamics of the social dilemma and the complexity of the interaction between agents. All of these elements are fundamental in determining the scope of cooperative behavior.
1 An alternative measure of cohesiveness (called “support”) is employed by Jackson et al. (2012). “Support” measures whether links (social interactions) have friends or not in common. Although support and cohesiveness seem to be similar as both measures involve triads, support can be several times higher than cohesiveness. In this paper, we use cohesiveness (instead of support) because it is a well-established measure in the literature of networks and easily available for computation.
7 III. The economic model
We present an analytical framework for studying the evolution and prevalence of a social norm based on the dynamics and stability of two interdependent systems: a social system (a community of resource extracting agents, represented by a social network) and a natural system (a renewable common property resource), thereafter referred to as a bioeconomic system. Agents are identical and have access to the resource. They can choose between being a complier or a defector. To overcome overexploitation, compliers (denoted by C) have reached a common understanding of the characteristics of the socially optimal extraction path and may pressure defectors to follow this extraction path that could emerge as a social norm. Social pressure maybe costly. Compliers can choose to coordinate their action provided they are connected. Coordination among compliers increases the social pressure exercised.
In the following, we present the underlying assumptions of the economic model. In section III.A. we present the key components of the economic model and in section III.B its setup and timeline. III.A Assumptions.
The model is based on the following assumptions.
• A1. Net benefits and utilities. All compliers have the same net benefits from resource extraction, but their utilities may differ as sanctioning costs depend on the number of neighbors that are defectors. Likewise, all defectors obtain identical net benefits from resource extraction, but have non-identical utilities which depend on the social pressure received.
• A2. Monitoring. All agents are perfectly informed about their neighbors’ choices. There is no time delay between detecting non-compliance and exercising social pressure (informal enforcement). Legal institutions have the possibility to detect defectors but are uninformed about the underlying social network.
• A3. Bounded rationality. Agents do not act strategically and their decisions to be a complier or defector at time t are based only on the comparison of the current benefits and costs.
• A4. Coordination (coalitions on the micro-scale). Connected compliers may coordinate their action in order to increase social pressure, but do not free-ride on each other.
Assumptions 1 is self-explaining. Assumption 2 state that agents observe other agents’ choices at no costs. However, legal institutions can detect defectors only if they exercise some costly effort either in form of periodical control, by monitoring devices or by giving economic incentives to compliers to reveal their choice. In any case legal institutions have no information about the underlying social network of each agent and therefore, they are uninformed about the strength of social pressure defectors receive. Assumption 3 takes account of the fact that the indirect
8 interdependencies of every agent’s choice with the choices of all other agents as a result of the large and complex network and the high dimension of the state space as a result of its continuity leads to a highly complex decision problem. For this reason, we assume as in Gale and Kariv (2003) that individual choices are based on non-strategic behavior and they are taken by comparing payoffs. We thereby formulate an indirect evolutionary process where norms, customs, and values are internalized in preferences that shape the agents’ decisions (Sethi and Somanathan 1996, Sobel 2005, Dekel et al. 2007, Tavoni et al. 2012, Besley 2020)
Non-strategic behavior of the agents as the result of the complexity of the decision problem also implies that agents are not forward looking and therefore, an intertemporal preference rate does not need to be considered. Assumption 4 considers the case where connected agents may coordinate their behavior or act as a group so that the exercised social pressure is perceived as more severe by the defector. Moreover, Assumption 4 states that compliers cooperate in order to augment social pressure but they do not free-ride on each other.2 As suggested by laboratory experiments social pressure is the result of negative reciprocity where one agent is willing to use a costly punishment when another agent transgresses (Fehr et al. 2002, Fehr and Fischbacher 2003, Dohmen et al. 2009). Compliers are not motivated only by the defectors’ transgression but also because defectors’ extra benefits are gains that compliers cannot realize at a later point in time. In other words, defectors inflict economic losses on compliers and therefore, social pressure can be viewed as redemption for the privation suffered by the compliers.
III.B Utility, social networks and social pressure
1.Utility. Agents’ private net benefits are determined by their resource demand strategies.
2 If compliers were allowed to free ride on each other one had to distinguish between compliers that contribute
to social pressure and non-contributing compliers. Since the agents’ choice is based on the comparison of the current benefits and costs (Assumption 3) agents either choose to be a non-contributing complier or a defector but never a contributing complier. Contributing compliers only emerge if either non-contributing agents are sanctioned or if their rationality were not bounded. In the latter case they could choose to be a contributing complier because their future stream of payoffs is higher than the one resulting from other choices. However, given the complexity of the decision problem we think that bounded rationality adapts better to the considered scenario than complete rationality. Moreover, in order focus on the influence of social networks on the emergence of social norms we do not analyze the case where contributing compliers sanction non-contributing compliers. Embedding a social dilemma problem between compliers within a more general social dilemma problem between compliers and defectors would go beyond the scope of the present study.
9 Let C
( )
( ) 0i
w s t denote the amount of the resource extracted at time t if agent i is a complier and wiD
( )
s t( ) 0 if agent i is a defector. The available amount of the resource is denoted by0 ( )
s t . The values of wiC
(
s t( ))
are the solutions of a dynamic optimization problem where asocial planner maximizes the net benefits of the community over an infinite planning horizon and
(
( ))
D i
w s t are the solutions of a myopic agent that maximizes their private net benefits over the planning horizon of one year. Thus, for any given stock s t( ) it holds that defectors extract more than compliers, wiD
( )
s t( ) wiC( )
s t( ) , and their net benefits, denoted by D(
D(
( ))
)
0i wi s t
, are
never less than those of the compliers denoted by C
(
C(
( ))
)
0i wi s t , i.e.,
(
)
(
( ))
(
(
( ))
)
D D C C i wi s t i wi s t . Since the ordinal ranking of wiD
(
s t( ))
and(
( ))
C i
w s t is sufficient for the proposed solution concept, the mathematical details of the optimization problems are not presented. Although compliers cannot force defectors to comply with the social norm, they can exercise social pressure at cost i( ) 0(see section III.A.3 for further details). Social pressure reduces the defectors´ net benefits, which in turn favors the propagation and prevalence of the social norm. We denote the social pressure agent i receives from their neighbors by the function
( )
0i
(see section III.A.3 for further details). Given these definitions, the utility of agent i adhering to the social norm at time t, ( ) 0
C i U t , is given by
(
)
(
)
( )
( ) ( ) C C C i i i i U t = w s t − . (1) It indicates that the utility of a complier is equal to the difference between their private net benefits3 and the costs of social pressure.The defectors' extra benefits represent an abstraction of the common property resource and are considered a driving force for compliers to sanction defector i. The utility of the same agent i not adhering to the social norm at time t , UiD( )t 0, is given by
( )
(
)
( )
( ) ( ) , D D D i i i i i U t = w s t − − (2) where i 0 denotes a per capita subsidy, and i 0 a per capita fine as a result of implemented policies. Since legal institutions are not perfectly informed about the agents’ choices they cannot differentiate subsidies or fines
3 Although the specification of the utility function implies that agents are risk neutral, we opted for this
10 2. Social networks. Since the position of each agent within the social network affects the agents’ utility, we need to model the structure of social interactions. For this purpose, we define a social network g=( , )A L . It consists of a set A=
1,...,n
, n2 of agents and a set L of links that are the unordered pairs of elements from A. The elements in the set L consist of the values of the indicatrix link function l A A: →
0,1 . For any pair of agents,( )
i j, , the expression lij =1 indicates that the two agents are neighbors, such that( )
i j, L; and lij =0 indicates the two agents are not connected.4 If 1, ,ij
l = i j the network is complete , i.e., every agent is connected to all other agents. The set of neighbors of agent i is denoted by A gi( )=
j: ,( )
i j L
and its size( )
i i j ij
k = A g =
l indicates the number of neighbors (“degree”) agent i has, with ki
0,n)
. Thus, we can define local cohesiveness of the neighborhood of agent i as
(
)
: , ( ), 0,1 , , , ( 1) 2 uv i uv i i i l u v A g l L u v A u v k k = − (3)The denominator of eq. (3) indicates the maximal number of possible links among agent i’s neighbors, and the numerator indicates the number of existing links among them. The average local cohesiveness of the entire social network, denoted by , is quantified as
1 1 , with 0,1 n i i n = =
. Let AiC( )g denote the subset of compliers within agent i’s neighborhood, such that AiC( )g A gi( ) . As argued by Marco and Goetz (2020) an important characteristic of social networks to favor the exercise of social pressure and to foster cooperation is its strength of moral ties. It is based on two elements: (a) the share of compliers ( )
0,1( ) C i i i A g c A g
= , and (b) how close the set of compliers of the neighborhood of agent i is to being a complete network (neighborhood). Let
i
c
denote the strength of local cohesiveness of compliers that can be quantified as
(
)
: , ( ), 0,1 , , , ( 1) 2 i C uv i uv c i i l u v A g l L u v A u v k k = − . (4)4 We assume (i) the social network is undirected, 1 1
ij ji
l = l = ; (ii) agents are not linked to themselves (no self-loops), lii =0; and (iii) there is no more than one link between the pair
( )
i j,11 Equation (4) represents the strength of local cohesiveness of compliers as it measures how close the subset of compliers, C
( )
i
A g , is to being a complete network.The term
i
c
signals the maximal size of the coalition compliers can form to exercise social pressure at the micro-scale, i.e., at the neighborhood level.
To illustrate the influence different network-types have on the strength of moral ties, social pressure and, consequently, on cooperativeness, we focus on three different but representative types of social networks: random, scale free and complete networks. If the formation of new links is governed by a fixed probability and independent from individual preferences the formed network is classified as a random network. If individual preferences govern the formation of links the resulting network is a scale-free network and if every agent is connected with all other agents of the network the formed network is complete.
3. Social pressure. The two key elements of social pressure agent i (defector) receives from their neighbors are given by: (i) the strength of moral ties, and (ii) the compliers’ perception of the severity of the state of the social dilemma. Social pressure is denoted by the function
(
, i ,)
0eff i ci c s
and is based on moral ties given by the share of compliers and the effective strength of local cohesiveness of compliers, and also by the level of the remaining stock.
(i) Moral ties. As described in theoretical and empirical studies (Fehr and Gächter 2002, Calvó‐ Armengol and Jackson 2010, Bowles and Gintis 2011, Gächter et al. 2017), the higher the share of compliers in A gi( ), the greater the social pressure exerted on agent i. We stipulate that i is an increasing function in ci, such that
( )
0i i c i c = . 5
A high cohesiveness of all agents in AiC( )g does not necessarily imply that they are taking collective action and the strength of social pressure utilization may be lower than
i
c
. For this reason, we consider effective local cohesiveness of compliers
i eff c
, e.g., the strength of collective action actually put into effect by the compliers. For the effective local cohesiveness of compliersi eff c it holds that min max 0 1 i i i i eff c c c c
= = . Thus, the higher the effective local cohesiveness of compliers is, the
12 greater the social pressure that can be exerted on defectors (Coleman 1988). We stipulate that social pressure is an increasing function in
i
eff c
, such that eff 0
ci i i i eff c = .
(ii) Remaining level of the stock. In absence of critical uncertainty regarding resource dynamics (Holling 1978, Walters 1986), we consider the stock to be a driving force for cooperation (Sethi and Somanathan 1996) and we postulate that the scarcer the resource is
(
s t( )→0)
, the greater the social pressure the compliers exert on defector i. In other words, we stipulate that social pressure i is a decreasing function in s, such that 0s i i s = .
To summarize, the social pressure agent i (defector) receives from their neighbors,
(
, i ,)
0eff i ci c s
, is defined by i: 0 → a continuous, twice differentiable and increasing function in moral ties and the scarcity of the stock. Moreover, and following Bicchieri and Muldoon (2014), social pressure is (i) lower-bounded when there are no compliers at all,i
(
0, 0,s)
=0, and (ii) upper-bounded, 0i( ) , where the upper limit is equal or greater than one, i.e.,(
)
1i 1,1, 0 = .
After having defined the social pressure function, we specify the complier’s i cost function of social pressure, i
(
k ci, i)
0. It is defined by i: 0 → a continuous, twice differentiable and non-decreasing function in degree (ki) and non-increasing in the share of compliers (ci), with(
0,)
( )
,1 0i ci i ki
= = and i
(
n−1, 0)
=max
i( , )k ci i
.6 At micro-scale, the cost function increases with the number of neighbors that are defectors.IV. Analytical approach
The proposed game on a nonregular social network is highly complex since every agent has a particular situation in the network that influences their choice and varies with the choices of the other agents. This complexity and interdependency foreclose any qualitative analysis to describe the evolution of the game and the characteristics of its equilibria. For this reason, we propose to reduce the dimensionality of the game by approximating c ti
( )
and( )
i c t
for any type and size of social6 We concentrate on the first-order dilemma of public goods (provision of cooperation) by assuming that the
costs of exerting social pressure are strictly individual. In doing so, we avoid the second-order dilemma of public goods since compliers do not have to agree on how to divide the costs of exerting social pressure among themselves.
13 network by their expected values E c t i
( )
and( )
i
c
E t that are denoted for simplicity c t
( )
and( )
c t
.IV.A Approximation
The values of c t
( )
and
c( )
t not only provide information about the average share of compliers but also allow reduce the dimensionality further. Marco and Goetz (2020) demonstrated in Theorem 1 that
c( )
t can be approximated by c t( )
2. It allows determining the average strength of moral ties by the characteristic of the network and the average share of compliers c. This approximation is very helpful since is a characteristic of the network that is fixed throughout the game and not like c that changes as the share of compliers changes. Moreover, the dimensionality of the bioeconomic system at time t has been reduced from ( ) 1n n + to (1 1), given by c t( )
and( )
s t .
The proposed approximation paves the way for a qualitative analysis but the question remains whether the approximation is robust? As a response to this question one can evaluate the approximation error by determining the difference between the approximated social pressure function, denoted by ˆ
(
( )
2( ) ( )
)
, ,
c t c t s t
, and the approximated cost of sanctioning, denoted by
( )
(
)
ˆ ,k c t
, with the average social pressure
(
( )
( ) ( )
)
1 1 , , i n eff i c i c t t s t n
= and average sanctioning
costs
(
( )
)
1 1 , n i i i i k c t n
= respectively. Obviously, if
ceffi
cione obtains an additional approximationerror since we approximate
( )
i c t
and not( )
i eff c t
by
c( )
t . Notwithstanding, this approximation error is not important for a qualitative analysis since the approximation of
c( )
t =
c t2( )
leaves us with the parameter that is constant throughout the game. Hence, a variation of this parameter can reflect either a change in the structure of the underlying social network, or a reduction in the willingness to take collective actions to sanction defectors. In the latter case the value of the parameter has to be chosen below the cohesiveness of the social network, since( )
( )
2( )
i i
eff
c t c t c t
.Proposition 1: [Robustness of the approximation]
The error of the approximation of the social pressure function
( )
and of cost of sanctioning ( )
by ˆ(
c t( )
,c2( ) ( )
t ,s t)
and ˆ ,(
k c t( )
)
respectively vanishes as the underlying social network14 tends (i) to be complete, (ii) to be dense or regular, or (iii) to have a homogenous distribution of compliers and defectors.
Proof: See Appendix A.I
The conditions formulated in Proposition 1 guarantee that the social pressure each defector i receives and the sanction costs each compliers bear are similar to the average social pressure and the average sanction costs respectively. However, even when these conditions are not met the approximation error can be negligible small provided that the distribution of social pressure and sanctioning costs at the micro-level is symmetric around theirs means so that they cancel out at the macro-level.
At macro-scale it holds that the sanctioning cost are equal to zero when the average agent has no link, or if either all agents are defectors or compliers, i.e., ˆ
( )
0,c =ˆ( )
k, 0 =ˆ( )
k,1 =0. Thus,0 ˆ :
→ is a continuous, twice differentiable and non-decreasing function in average degree ( k) but for small/large average values of share of compliers
( )
c it approaches asymptotically zero and has a maximum at intermediate values, c ( )
0,1 , such that ˆ(
n−1,c)
=max
ˆ( , )k c
. The latter case corresponds to the situation where the maximal number of compliers and defectors are neighbors. By Assumption 2 legal institutions are uninformed about the agent’s social network so that they cannot adjust a fine according to the social pressure a defector receives or according to the costs of social pressure a complier has. Hence, fines or subsidies are uniformly applied such thatˆ , i
i A
= .
A qualitative analysis of the bioeconomic system has important implications in policy design as it contributes to answering the question as to what extent social networks influence the equilibrium outcomes and how they affect the availability and efficiency of policy options (see sections VI and VII).
Based on the assumption of bounded rationality (A3) agents choose in our dynamic game the action that offers a higher utility than the average utility obtained by the other agents of the social network. Thus, the evolution of cooperativeness is given by
(
C)
(
C(
C (1 ) D)
)
(1 )(
C D)
c c c U U c U cU c U c c U U t = − = − + − = − − , (5)15 where Udenotes the average utility of all agents, i.e., of UC and UD.7 Writing out the definitions of UC and UDand collecting term shows that
(
)
(
ˆ ˆ ˆ)
(1 ) C D
c==c −c − + + − . (6) In order to facilitate the analysis and interpretation of equation (6) we convert defector´s extra benefit as reference point with a value of one. Thus, dividing equation (6) by defector´s extra benefit yields
( ) ( ) ( )
(
( )
)
(
2 ˆ)
( )
( )
ˆ( , , ) 1 ˆ , (1 ) dc c c t c t s t k c t c t c t dt = = − + − − . (7) Since the interpretation of the functions and parameters ˆ , ˆ and
ˆ remains unchanged we maintain their notation in order to reduce the notational burden of the study. Equation (7) shows that the share of compliers increases if the social pressure is on average higher than the sum of the defectors’ extra benefits, normalized to one, legal enforcement in form a fine/subsidy and the costs of social pressure, i.e., ˆ − +1 ˆ ˆ. This inequality is in line with the assumption of bounded rationality as it implies that social pressure in the absence of legal enforcement is greater than the cost of social pressure. The term c(
1−c)
relates to the interaction rate between compliers and defectors. It graduates the evolution of cooperativeness, c, and is minimal if the share of compliers is either close to zero or one.Cooperativeness relates also to the evolution of the stock that is described by
( )
( )
( )
1 1 ( ) ( ) ( ) ( ( )) ( ( )) (1 ) ( ( )) cn n C D C D i j i j cn s s R s t w s t w s t R s t cnw s t c nw s t t = = + = − − = − − −
, (8)where R s t
( )
( ) 0 denotes the stock-dependent growth rate of the renewable resource. This variable could present for instance a forest or fishery under a common property regime or an aquifer where the recharge is constant so that R s t(
( ))
R.
7 Note that equation (5) is similar to the two-strategy replicatoras inBowles and Ginis (1998). However, the
replicator dynamic assumes that the social network is always complete and the evolution of a stock variable is not considered. The two-strategy replicator assumes that all agents, although constantly connected, meet with an identical and constant probability, which in turn conditions the propagation of the agents’ behavior within the community. In equation (5) such an assumption is not necessary as our model is influenced by the structure of the agents’ links and the severity of the social dilemma.
16 IV.B Setup and timeline of the game on social networks
The game is described as follows:
1. Setup. The game is initiated as follows:
• The structure of the social network g
(
A L,)
is static throughout the run of the game but its initial structure can be modified between different runs of the game. Its structure is characterized by the average local cohesiveness,
0,1 , which is fixed during the game.• The size of the network is finite but large and constant during the run of the game, i.e., A= n
.
• The game begins at time t=0 with an initial share of compliers, c t( = 0) c0
( )
0,1 , and the available stock, s t( = 0) s0(
0,smax
.2. Timeline. The timeline of the model within each period is as follows.
• At each moment of time t
1,T , the agent i in g will face a binary choice,
C D,
, where C represents compliance and D non-compliance with the social norm. As a result, the average share of compliers c t( )( )
0,1 evolves over time.• At time t the agents choose the action that offers a higher utility than the average utility of their neighbors, given the share of compliers in their neighborhood, and the available stock. All agents choose simultaneously and take the other agents’ choices as given.
• The time horizon of the game T is finite but very long. It ends when t=T or s=0 (depletion).
IV.C. Evolution of cooperativeness and social norms
Given the structure of the social network
0,1 , and any set of initial conditions,( )
0 0( )
0,1c = c and s
( )
0 = s0(
0,smax
, cooperativeness as a result of a social norm has emerged over time if c t( =T)(
0,1
; with t
0,T . On the contrary, if c t( =T)=0 and/or s t( =T)=0, cooperativeness has not emerged.First- and second-best solutions. Our interest is in identifying conditions for sustaining the all-complier equilibrium that by definition of wiC
( )
s t( )
is the first-best solution as it defines the socially17 optimally outcome. Alternatively, if the first-best solution cannot be achieved, we are interested in defining conditions that allow sustaining an interior equilibrium where compliers and defectors coexist (second-best solution).
The existence of interior equilibria of the bioeconomic system leads to the definition of a “frontier line” in Section V. The slope and the set of possible locations of the frontier line allow us to signpost the minimal and maximal influence social networks have on the use of common property resources and cooperativeness. This information is highly relevant for policy design as it provides policy-makers with information about the availability and effectiveness of legal and informal enforcement policies – see Sections VI and VII.
Definition 1 [Equilibrium conditions]: The stationary values for the social system and the natural system are given by c* and s respectively. An overall equilibrium of the non-linear bioeconomic * system is obtained when c* and s exist, and it holds that* s = =c 0.
For any fixed social network, the dynamics of the non-linear bioeconomic system is governed exclusively by c and s. An overall equilibrium is characterized by
( *) C( *) (1 ) D( *)
R s =cnw s + −c nw s and c=0, c=1 or ˆ( ,c effc s2, ) 1= − + ˆ ˆ
( )
k c, . The values( )
* 0 (lower), * 0,1 (interior), * 1 (upper)
c = =c c = c c = =c comply with the equation c=0, and
*
s with the equation s =0. The all-complier equilibrium is achieved when c*= =c 1, and the all-defector equilibrium is achieved when c*= =c 0.
V. Qualitative analysis of the bioeconomic system
Equations (7) and (8) allow us to determine (1) the influence social networks have on equilibrium outcomes and cooperativeness, and to identify (2) the dynamics of the frontier line and the basins of attraction of the bioeconomic system. Furthermore, it allows us to determine (3) the influence the stock variable has on the agents’ behavior.
18 V.A. Social network structure
Analytically, the approximation ˆ
(
2)
, ,
c c s
extends existing approaches8 for studying the influence different types of networks have on the qualitative behavior of the bioeconomic system. To guide the intuition behind our analysis, we focus on representative types of social networks9: random networks, scale free networks and complete networks. In random networks, links are formed with a fixed and usually small probability so that the agents’ capacity of interaction is conditioned by this probability. As a result, all agents are similarly poorly connected. In scale-free networks, some agents tend to be more (but not completely) connected than the others and therefore they interact more often. These networks offer a better match to real-world social networks, especially when communities are large. In complete networks, every agent interacts with everyone else. Given the agent’s limited capacity to be permanently linked to a large number of people, complete networks are likely to be a good match for small but not for large communities.
Marco and Goetz (2020) demonstrate in the proof of Proposition 4 that the range of the average local cohesiveness in random networks (RN) is given by 2 , 2
1 RN
n n
−
, so that it tends to zero for n sufficiently large, in different versions of scale-free networks (SF) it is given by 0,4
5
SF
, and in complete networks (CN) average local cohesiveness is maximal, i.e., CN =1. The effects social networks have on the equilibrium outcomes and cooperativeness can be seen from equations (7) and (8). The growth rate of the share of compliers increases as c and/or eff , bounded from
above by , increases which in turn affects the strength of moral ties and the level of the stock. Hence, social pressure is lowest in a random network and highest in a complete network for a given stock of the resource and a share of compliers and its willingness to collaborate.
The wide variety of real-world network topologies (scale-free networks) opens the door to design network-orientated policies that aim to enhance social pressure by increasing average local cohesiveness (see Sections VI and VII).
8 To date to our best knowledge studies that analyzed the influence of networks on the qualitative behavior of
economic models have focused on random networks or simple geometric figures like a line, star, triad or circle, in the absence of a stock variable.
19 V.B. Frontier and border line
While the boundary (lower and upper) stationary values of the c=0 isocline, stated in Definition 1, are straightforward, the intermediate case, c*= c
( )
0,1 , is more intriguing as it allows for a stationary value where compliers and defectors coexist. The isocline( )
2 ˆ
ˆ( ,c effc s, ) 1 ˆ k c, 0
− + − = presents an iso-social pressure line where agents are indifferent between the compliance or non-compliance. In this respect, it presents a frontier line for the agents’ choice. The following definition determines all possible locations of the frontiers lines in the ,s c- plane.
Definition 2 [Frontier line]: The set
( )
2 2 0,1 ˆ ˆ ˆ , ( , , ) 1 , 0 eff eff eff s c c c s k c = − + − = defines the area with all possible frontier lines in the s c - plane. The elements of the set , are the different sets eff .
The frontier lines with the minimal and maximal eff are given by
( )
0 ˆ ˆ( ,0, ) 1 ˆ , 0 eff c s k c = − + − = and( )
2 1 ˆ ˆ( , , ) 1 ˆ , 0 eff c c s k c = − + − = respectively. Afrontier line moves to the north-west in the ,s c- plane with an increase in eff
, so that 1
eff
= is to
the left of eff=0 - see Figure 1 below for an illustration. The frontier line of a random network
constitutes the right-hand-side boundary of the set , whereas the frontier line of a complete network the left-hand-side boundary if compliers collaborate. In this way, the sets
1
eff
= and eff=0 signpost the maximal and minimal influence the type of social network has on the cooperativeness. The frontier line presents a generalization of the concept of a tipping point (threshold) in the share of compliers. The concept of a tipping point emerges as a special case if (i) the interior equilibrium is unstable, (ii) the social network is complete and (iii) there is either no stock or the level of the stock is constant over time. The generalization of the concept of a tipping point and offers an answer to the first question raised in the introduction shows that the share of compliers as a single aspect of social interaction is an imprecise predictor for cooperation. An argument that is also supported by the evidence found by experimental economists (Chaudhuri 2011). If only the level of the stock were constant over time we would obtain a completely horizontal frontier line because the stock does not influence social pressure. This horizontal line shifts positionally to the left or to the right as a result of an increase or decrease in cohesiveness respectively.
The isocline s=0 offers the borderline between resource depletion (overexploitation) and resource replenishment (abundance). The slope of the borderline and frontier line is determined by
20 Proposition 2 below. The intersection of the frontier line and the borderline yields the overall equilibrium of the bioeconomic system *, *
(
c s)
in the ,s c- plane.Proposition 2: [Slope of the isoclines]
The slope of the borderline and the frontier line (nullclines) in the s c - plane are given by ,
(
)
0 ( ) ( ) ( ) 0, if (1 ) < 0 ( ) ( ) ( ) ( ) ( ) ( ) ( ) ( ) (1 ) 0, if (1 ) > 0 C D D C C D C D s R s w s w s cn c n n w s w s s s s s R s w s w s c R s w s w s cn c n cn c n s s s s s s = − − − − − = = − − − − − − (9) 0 ˆ ˆ 2 ˆ 0, ˆ c c c c s c s c = − + − = (10)Proof: Applying the implicit function theorem to the equations (7) and (8) respectively, yields the results of Proposition 2.10
Proposition 2 shows that the borderline (eq. 10) is upward sloping in the equilibrium if changes in resource growth are less than the increase in extractions as a result of an increase in the stock. This would be the case if the growth rate of the resource is independent from the stock, e.g., the natural recharge rate of an aquifer. Similarly, the borderline is downward sloping if resource is very responsive to changes in the stock but extraction is not, for example if extraction costs are completely independent from the remaining level of the stock. The frontier line is upward sloping if the social pressure function is more responsive to an increase in the share of compliers than the cost of social punishment. This is the always the case if the social punishment costs are either fixed, or if the costs of social punishment are hardly responsive to an increase in the share of compliers. If these conditions are not met the frontier line can be upward or downward sloping in the ,s c- plane. For the sake of concreteness, we concentrate on the case where the borderline line is upward sloping and the frontier line is either upward or downward sloping. Other combinations of the slopes of the nullclines can also be analyzed within the presented analytical framework. However, as they do not offer any new qualitative insights we do not present them in this study
10As defined previously with respect to
i
we also obtain for ˆ that,
ˆ ˆ ˆ ˆ 0, ˆ 0, ˆ 0 c c s c c s = = = .
21 V.C. Basins of attraction and policy options
Consistent with the first- and second-best solutions defined above, we want to identify the policies and conditions that best favor cooperation among the agents. This objective goes back to the second question posed in the introduction. Sections V.C aims to answer this question. Concretely, we want to define the conditions under which no-enforcement or informal enforcement, in form of network-orientated policies, or legal enforcement, in form of economic-network-orientated policies (e.g., fines or subsidies), may be best applied. We start by defining the basins of attraction.
Definition 3 [Basins of attraction]: For a given social network, e.g., for any given value of
0,1 eff
, the sets
( )
2 2 0,1 ˆ ˆ ˆ , ( , , ) 1 , 0 eff eff s c c c s k c = = − + − and
( )
2 2 0,1 ˆ ˆ ˆ , ( , , ) 1 , 0 eff eff s c c c s k c = = − + − define as the basin of attraction for the all-defector equilibrium (c*= =c 0), and as the basin of attraction for the all-complier equilibrium
(
c*= =c 1)
.1. No-enforcement corridor – It is independent of the type of network. Values of , c and s located in set eff=0 indicate that the social norm has emerged as a result of strong moral ties together
with the threat of a deteriorating state of the natural resource. For values located in 0
eff
= , the stable
equilibrium outcome is independent of any type of social network. The social norm and social pressure are sufficient for achieving the all-complier equilibrium. We refer to this set as the no-enforcement corridor. Policy-makers have to be aware that a high share of compliers alone may not be sufficient for the abandonment of enforcement policies – see Proposition 4 below.
2. Informal-enforcement corridor - It depends on the type of network. The set defines the lower and upper limits of network-orientated policies as it depends of the type of social network. The objective of informal enforcement (network-orientated policies) is to strengthen indirect moral ties, c, by increasing eff
, and, thus, these policies are able to reduce the minimum share of compliers necessary for cooperativeness. For this reason, we refer to set as the network-policy or informal-enforcement corridor. In the context of a natural resource, one can imagine, with respect to network-orientated policies, a compliers’ association and/or a non-governmental support organization being founded, or seminars and workshops being organized (Cumming 2018). Likewise, community leaders (referred to hubs in network terminology) may help to create links between her neighbors to increase the cohesiveness in the social network. The regulator or the
22 compliers themselves may take the initiative for these policies. Moreover, within set , network-orientated policies may be complemented or replaced by legal enforcement policies.
3. Legal-enforcement corridor – It is independent of social interactions at all. Values of , c and s located in set
1
eff
= indicate the non-emergence of the social norm and are independent of
the type of network. The equilibrium outcome for initial values located in 1
eff
= corresponds to the
all-defector equilibrium, and thus, it is identical to the situation where agents do not interact at all. Moral ties have not been sufficiently formed within the community and therefore no-enforcement or informal enforcement policies have to be discarded. Policy-makers are left only with the option of legal enforcement, for instance, direct regulations, if possible, or economic incentives. For this reason, we refer to set
1
eff
= as the legal-enforcement corridor. The objective of legal enforcement
is to strengthen direct moral ties by increasing c.
If agents were not interacting and no legal enforcement were exercised the equilibria would be given by c*= =c 0, and by c*= =c 1. In this case the basin of attraction of the all defector equilibrium were given by the set
s c, 2( )
−1 (1c − c) 0
, i.e. the entire admissible ,s c plane except c=1. In other word the traditional result of the tragedy of the commons.
The three corridors identify the policy options available and are analyzed in Section VI.
Proposition 3: [Social networks and location of equilibria]
The size of the set not only signposts the maximal and minimal influence of the types of social networks on cooperativeness but also the possible area of location of the second-best solution (stable equilibrium where compliers and defectors coexist).
Proof: Following Definition 1, an equilibrium exists if and only if c=0. According to Definition 2 the set contains all the cases where interior stationary values of the share of compliers exists, i.e., c*= c
( )
0,1 . Hence, any equilibrium of the bioeconomic system, s = =c 0, where compliers and defectors coexist has to be part of the set .In other words, Proposition 3indicates that any second-best solution, if it exists, is always located in the area of network influence where ( *, *s c = c) holds.
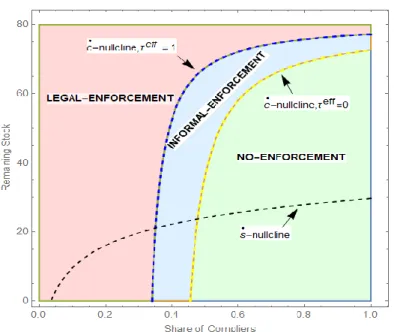
23 Figure 1 Basins of attraction of equilibrium points and the availability of enforcement policy options
Figure 1 illustrates the location of the two nullclines of c s, for the case where legal enforcement is absent and social pressure is costless, i.e., ˆ ,
( )
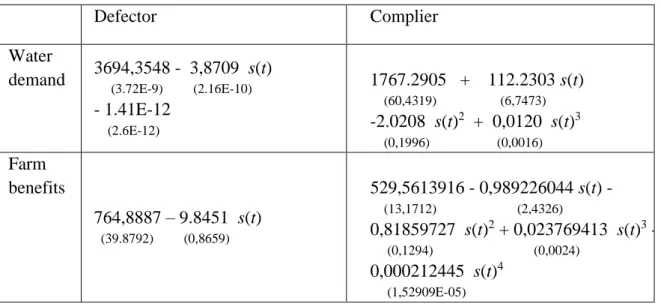
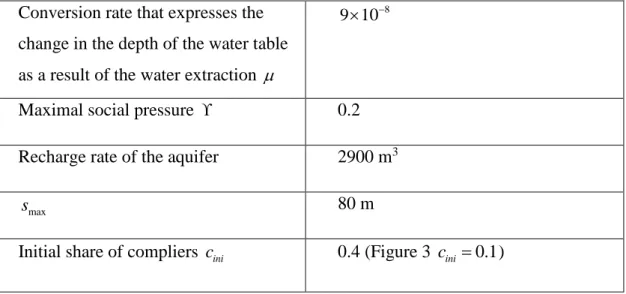
k c =0. For example, it could present the case of a water user association where farmers have their own well and extract water from a common property aquifer for irrigation. The employed functions for Figure 1 are obtained from the solution of a mathematical optimization model programed in GAMS and a subsequent econometric analysis of the output of the GAMS model. The required agronomic, economic and hydrological input data for the model was obtained from published data about the Western La Mancha aquifer in Spain. The online material presents detailed information about chosen values for the parameters and the specification of the employed function ˆ , Cw
and D
w . Moreover, given the normalization of the defector’s extra benefit to one we have limited social pressure by twice this value, i.e. i( ) =2. Other values for are possible but its choice does not change the qualitative results of our analysis. In Figure 1 the area is marked in red and the area in green. The area between the frontier line
1
eff
24 possible coexisting equilibria. It is marked in light blue and its size depends on eff
, the effective strength of cohesiveness of all agents.11
VI Implications of the analytical framework for policy design
In this section we analyze first the evolution and stability of the bioeconomic system as reference points for the design of enforcement polices and second determine the design of optimal polices for stable cooperation.
VI.A Stability analysis
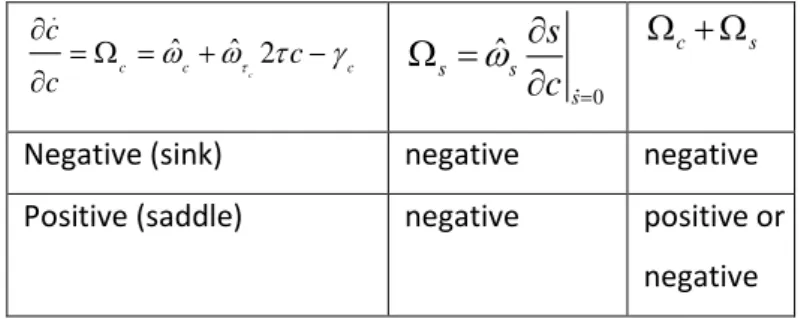
The intersections of the nullclines of c s, presents an interior equilibrium where compliers and defectors coexist. In Appendix III we present a stability analysis for possible interior equilibria of the bioeconomic system. It shows that an equilibrium-point where the slope of the frontier line at this point is superior to the positive slope of the border line is a saddle point (Observation A2). A numerical analysis confirms this result since the determinant of the Jacobian matrix of the equations (7) and (8) evaluated at the equilibrium point c2 =
( )
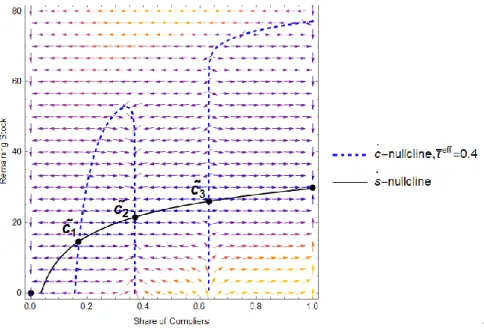
c s, =(0.40916, 22.43928) is negative with a value of -0.08968. However, since the analysis in Appendix III is based on the linearization of the nullclines evaluated at an interior equilibrium point it presents only an approximation. It describes the dynamics of the bioeconomic system in the neighborhood of the equilibrium point and little can be deduced about the dynamics of the bioeconomic system beyond the neighborhood of the equilibrium point. For this purpose, we present in Figure 2 the phase diagram for the entire ,c s space. It illustrates that the stable branch of the saddle point corresponds to a movement along thec nullcline and the unstable branch any point off the c nullcline. Given the narrow margin of the stable path, the chances that arbitrarily chosen initial values of ,c s, even if they are initially on the stable branch, belong to a path that ends up at the interior equilibrium is very limited. Figure 2 also illustrates that the equilibria, c* 0, * 1= c = are stable. Hence, the bioeconomic system is characterized by the three stable equilibria, c* 0, * 1, *= c = c =c. Each of them is indicated by a black circle.
11 The strength of cohesiveness of all agents depends on the availability of links between agents whereas
the strength of cohesiveness of compliers c depends on the availability of links between agents and the share of compliers. Both elements of c influences in the strength of social pressure.
25 Figure 2. Phase diagram of the bioeconomic system, nullclines and equilibrium points in the absence of policy interventions and any costs of social pressure.
Next, we analyze the influence of the average costs of social pressure on the equilibrium outcome. Let us assume that they are given by ˆ ,
( )
k c =( )
k c(1−c), where
( )
k is strictly positive and constant throughout the game. Based on the specification of the function ˆ( )
the costs of social pressure are bell-shaped and maximal if c=0.5. Note that the sum of the defector’s extra benefits and average costs of social pressure exceeds the maximal value of social pressure =2, if c=0.5and 4.
Figure 3 depicts the location of the two nullclines of c s, and the phase diagram of the bioeconomic system for the case where social pressure is given ˆ ,
( )
k c =4.3 (1c −c) and legal enforcement is absent, i.e., ˆ 0= . It shows that the bioeconomic system is characterized by the two boundary equilibria c* 0, * 1= c = and three interior equilibria, denoted by c c1, 2 and c3. The phase diagram of the bioeconomic system shows that the equilibria c* 0, * 1= c = are stable. Appendix III demonstrates that an interior equilibrium point is a sink if the slope of the frontier line at this point is negative while the slope of the border line is positive (Observation A1). Thus, equilibrium point2
c is a sink and the equilibrium points c1, and c3 are saddle points if the slope of the frontier and border line are upward sloping but the former one is more pronounced than the later one (Observation A2). A numerical analysis of the determinant of the Jacobian matrix of the equations