64 https://jbhost.org
Submitted 26th March 2020
Accepted 15th June 2020
FACTORS THAT DETERMINE BUYING INTERESTS
OF FOREIGN TOURISTS IN CHOOSING
ACCOMMODATIONS IN TEGALLALANG VILLAGE,
GIANYAR , BALI
Ni Putu Ratna Sari, Anak Agung Putri Sri
Tourism Faculty, University of Udayana, Bali, Indonesia Corresponding Author: [email protected]
ABSTRACT
A number of accommodations are available in Tegallalang Village, because of its location that is close to central Ubud. Along with the increase in foreign tourist arrivals, then this study aims to analyze the factors that determine the interest of foreign tourists in the selection of accommodation in the village of Tegallalang, Gianyar Bali. This study used 50 respondents with accidental sampling technique. Data will be analyzed by factor analysis. The results showed characteristics of tourists who stay at accommodation in Tegallalang Village were dominant Australian citizenship 18%, Length of their stay is 3-7 days (72%), based on age in 26-30 years old (36%). Characteristics based on occupation dominant as employed (48%) and purpose of visit for leisure (58%). Tourists choose villa for 68% as a place to stay, this is because the villa is more privacy than others. The factors that influence the buying interest of foreign tourists in choosing accommodation are the first is the factor of room quality, the second is the location factor, the third is the price factor and the fourth is accommodation security factor. The dominant factor that determines it is the room quality factor
The next research that will be conducted in the future is guest satisfaction toward accommodation in Tegallalang Village is highly expected.
Keywords: buying interest; tourist characteristics; room quality factors; Tegallalang Village.
INTRODUCTION
65 https://jbhost.org
restaurants, cafes and others. Many tourists come to stay overnight because this area offers tranquility and comfort with beautiful natural scenery. This village has a beautiful rice terraces. This rice field is made very beautiful with its winding shape and is located right on the hillside. In this place, tourists can see bali farmers doing their fields in a sloping place completed with an irrigation system. The terraces in Tegalalang are one of the iconic tourism objects in Ubud visited by many tourists every day. Tourists attraction of Tegallalang village is one of the destinations for foreign tourists to stay overnight. Various factors can make accommodation choices in Tegallalang village. The accommodation business in Tegallalang Village is developing along with the increasing number of tourist visits. Today various promotional efforts can be carried out in a very easy and cheap ways. Promotion through social media is very effective in introducing an accommodation business. Online promotions implemented by several accommodation providers in the village of Tegalallalang, were through some web sites including: tripadvisor, booking.com, and traveloka.com. The location which is close to the cultural center of Ubud makes Tegallalang village attractive as a place to stay. The calm atmosphere away from the crowds also strongly supports the existence of this accommodation.
Based on the 2018 tourism accommodation directory, the total accommodation in this village was 57, with the following details: 10 jasmine hotels, 47 tourist cottages. Room rates were between Rp 300,000.00 – Rp 500,000.00 for homestays including breakfast. Villa rentals were between Rp 500,000.00 - Rp 600,000.00 per night. Hotel room prices were between Rp 1,000,000.00 - Rp 2,000,000.00 per night. The length of stay of guests was usually around a month for guests staying at homestays and tourist lodges. The length of stay for the guests staying in villas and hotels was between 2-3 days but it might up to a week. Management of accommodation was still managed by local management by involving local residents to help manage the business. The high number of accommodations causes the competition for hotels, villas and homestays to be even higher. Factors affecting tourists who want to visit and stay include easy access to accommodations through online media. In addition, room price competition also determined the visiting factors in addition to room quality, comfort and others.
Along with the increase in tourist visits to the Gianyar tourist attraction which reached 70%, this study aims to: 1) to determine the characteristics of tourists who stay in Tegallalang Village, 2) to analyze the factors that determine the interest of foreign tourists in choosing accommodation in Tegalllang village, Gianyar Bali.
LITERATURE REVIEW
66 https://jbhost.org
67 https://jbhost.org
In the study of Yavas & Babakus (2005), three attributes: public facilities, core services and comfort dimensions are the main attributes that influence hotel decision choices for business and leisure travelers. Study of Chu & Choi (2000) used service quality, business facilities, value, room and front desk, food and recreation, and security factors in determining factors of choosing hotel in the Hong Kong hotel industry. Barsky & Labagh (1992) found that there are 3 factors that influence travelers to choose hotels (1) employee attitude, (2) Location, and (3) rooms. Choosrichom (2011) suggested that as Security and Safety the most influential in determining customers choosing hotels on Lanta Yai Island, security and safety are the most basic human needs. Even if the hotel is comfortable, if there is no security, there is no point in staying there.
METHODOLOGY
The research location is located in Tegallalang Village, Tegallalang District, Gianyar Bali. This research used qualitative and quantitative data. Data sources were primary and secondary data. Data were collected through observation, interview, questionnaire and literature review. Informants were local community leaders and tourism actors in Tegallalang village and village officials. Samples were foreign tourists who have stayed at accommodation in Tegallalang Village. The number of samples taken was 50 respondents (foreign tourists) who stayed at accommodations in Tegalallang. Samples were taken by accidental sampling. This study used 4 factors namely location, employee service, safety and comfort, and room quality. The sum of all indicators tested were 15. Data analysis techniques used are validity test, reliability test and factor analysis. The questionnaire used a Likert scale with a scale of 1 (very bad) - 5 (very good). Data received from the survey was processed by using the IBM SPSS 21.0. The steps of factor analysis were 1) KMO test and Barlett test of sphericity, 2) extraction process with Principal Component Analysis, 3) factor rotation with Varimax Method to determine the number of indicators that have a high eigen value for each factor, 4) Interpretation of factors with how to group factors that have a high loading factor into a factor of 0.5 as a loading factor. Factors that have been grouped would be named by another name.
RESULTS AND DISCUSSION
The characteristics of foreign tourists
68 https://jbhost.org
Figure 1. Respondents Characteristics Based on Country of Origin
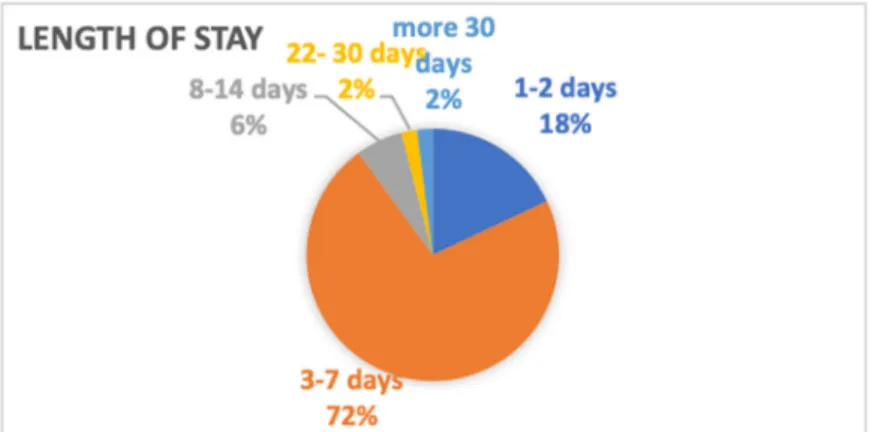
Respondents stated that their length of stay was 3-7 days accounting for 72%, 18% of respondents said they stayed 1-2 days, and some even stayed 8-14 days accounting for 6%. Respondents stayed 22-30 days even more accounting for 2%. The location of the village of Tegalalllang which is close to the cultural center of Ubud, close to natural attractions in Tegalllang makes them choose to be able to stay longer to enjoy a vacation
Figure 2. Respondents Characteristics Based on Length of Stay
69 https://jbhost.org
Figure 3. Respondents Characteristics Based on Age
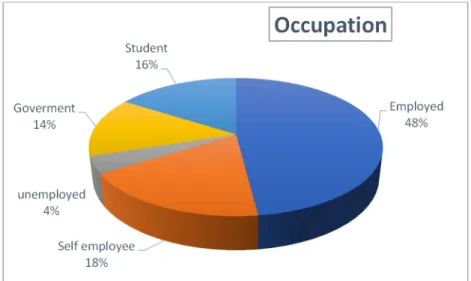
Based on occupation, the dominant respondents are working at companies 48%, then respondents who have their own business 18%.It’s only 4% of respondents who do not have a job. This is certainly those who already have their own income will be more able to travel for trips compared to those who are still in school and who do not have a job. Similarly, respondents who work in government will find it more difficult to arrange a schedule for travelling.
Figure 3. Respondents Characteristics Based on Occupation
They stated that the dominant tourists come and stay by the reason of leisure (leisure) for 58%. The lowest percentage is the reasons for visiting friends and business for 2%
Employed 48%
Self employee 18% unemployed
4% Goverment
14%
Student 16%
70 https://jbhost.org
Figure 4. Respondents Characteristics Based on Purpose of Visit
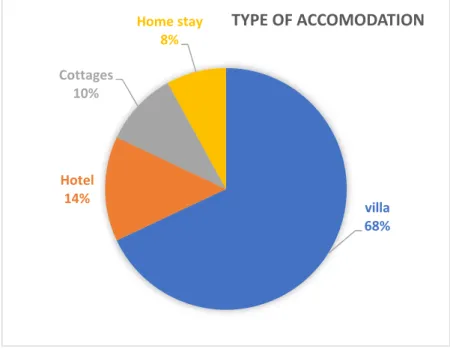
Mostly, tourists choose villa for 68% as a place to stay, this is because the villa is more privacy than others. The lowest is 8% of guets that chose homestays to stay.
Figure 5. Respondents Characteristics Based on Type of Accomodation
Mostly, tourists choose villa for 68% as a place to stay, this is because the villa is more privacy than others. The lowest is 8% of guets that chose homestays to stay.
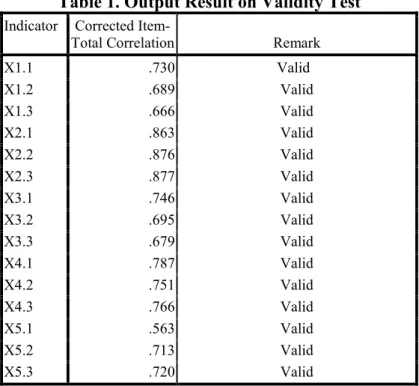
Factor Analysis 1. Validity Test
Based on Table 1, there are 15 sub-indicators, where all indicators are valid because the value is above 0.3.
Business 2%
Leisure 58% culture
22%
Visiting friends and
relative 2%
Health 12%
other 4%
PURPOSE OF VISIT
villa 68% Hotel
14% Cottages
10%
Home stay 8%
71 https://jbhost.org
Table 1. Output Result on Validity Test Indicator Corrected
Item-Total Correlation Remark
X1.1 .730 Valid
X1.2 .689 Valid
X1.3 .666 Valid
X2.1 .863 Valid
X2.2 .876 Valid
X2.3 .877 Valid
X3.1 .746 Valid
X3.2 .695 Valid
X3.3 .679 Valid
X4.1 .787 Valid
X4.2 .751 Valid
X4.3 .766 Valid
X5.1 .563 Valid
X5.2 .713 Valid
X5.3 .720 Valid
Source: Data processing results, 2019
Reliability Test
Reliability test is carried out to determine the consistency of the measuring instrument. Based on Table 2, all of the sub-indicators are declared reliable because the Cronbach alpha value is above 0.6, which is 0.951
Table .2 Reliability Statistics
Cronbach's Alpha N of Items
.951 15
Source: Data processing results, 2019
From Table 3, it shows that the kaiser mayer olkin measure of sampling (KMO) shows a value of 0.848, this means that the KMO requirements meet the minimum requirements that exceed the value of 0.5, which means the indicator is worth factoring.
Table 3
KMO and Bartlett's Test Kaiser-Meyer-Olkin Measure of Sampling Adequacy.
.848
Bartlett's Test of Sphericity Approx. Chi-Square 893.298
df 105
Sig. .000
Source: Data processing results, 2019
Test of Bartlett’s Test Of Sphericity
72 https://jbhost.org
value of Bartlett's test of sphericity is obtained with a value of 893,298 with a significant value of 0,000. This shows that the chance of error for non-independent sub-indicators is accounting for 0%, thus the sub-indicators have a correlation.
Test of Measure Of Sampling Asequancy (MSA)
KMO test requirements have been met then it is necessary to observe the 15 sub-indicators with the Test of Measure of Sampling Asequancy (MSA). Based on Table 4 it can be seen that 15 sub indicators used do not obtain an MSA value (measure of sampling aquency) <0.5, which means that the MSA requirements (measure of sampling aquency) have already met and the factor analysis process can be continued.
Table 4. Measure Value of Sampling Asequancy (MSA) With 15 Sub IndicatorsonAnti Image Matrices
No. Sub indicator MSA Value
Accommodation Location
1. Location is accessible 0,839
2. Location near by touristic & cultural sites 0,859
3. Location is close to supporting facilities (restaurants, cafes and bar), shopping center).
0,834
. Staff Service
4. Staff are helpful 0,837
5. Staff are polite and friendly 0,788
6. Staff are provide efficient service 0,831
. Security and Safety
7 Security personnel are responsible 0,950
8. Fire alarms 0,826
9. Sprinkler system 0,821
Room Quality
10. Room comfort 0,847
11. Hotel and Room cleanliness 0,935
12. Room is quiet 0,860
Price
13. Price is relatively cheap 0,843
14. Price is compatible with service they offered 0,839
15. Price is compatible with facilities offered 0,859
Source: Data processing result, 2019.
Factor Extraction
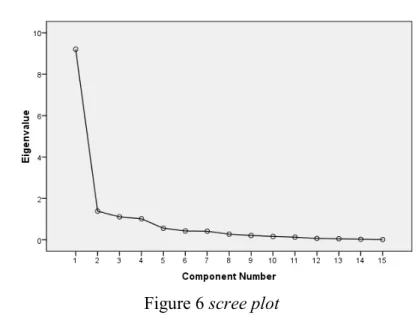
Based on Table 5, there are 15 components that represent sub-indicators and there are 4 (four) factors that have more than 1 (one) eigenvelues with values owned, 9,209, 1,380, 1,105, 1,014. This value determines the components or factors used to explain total diversity can be seen from the large value of eigenvalues, components whose value is more than 1 (one) is the component used.
73 https://jbhost.org
and a factor of 84,720%. Based on the reason of the value of eigenvalues of the five factors that are more than one and the cumulative percentage of the five factors accounting for 61,391% is able to explain the total variance of the 15 existing sub-indicators.
Table 5
Total Variance Explained Compon
ent
Initial Eigenvalues Extraction Sums of Squared Loadings
Rotation Sums of Squared Loadings
Tot al
% of Variance
Cumulat ive %
Tot al
% of Variance
Cumulativ e %
Total % of Variance
Cumulative %
1 9.209 61.391 61.391 9.209 61.391 61.391 4.167 27.781 27.781 2 1.380 9.199 70.590 1.380 9.199 70.590 3.127 20.847 48.628 3 1.105 7.370 77.960 1.105 7.370 77.960 3.005 20.033 68.661 4 1.014 6.760 84.720 1.014 6.760 84.720 2.409 16.059 84.720
5 6
.553
.425
3.687
2.834
88.407
91.241 7 .412 2.748 93.989 8 .268 1.784 95.772 9 .205 1.368 97.141 10 .160 1.064 98.205 11 .124 .824 99.029 12 .065 .432 99.461 13 .047 .312 99.774 14 .025 .166 99.939 15 .009 .061 100.000
Source: Data processing results, 2019.
The scree plot of the eigenvalue can be seen in Figure 6 :
Figure 6 scree plot Source: Data processing result, 2019
74 https://jbhost.org
from 5-15 are on the y axis under 1. This shows that there are 4 factors that are best for explaining the 15 sub-indicators.
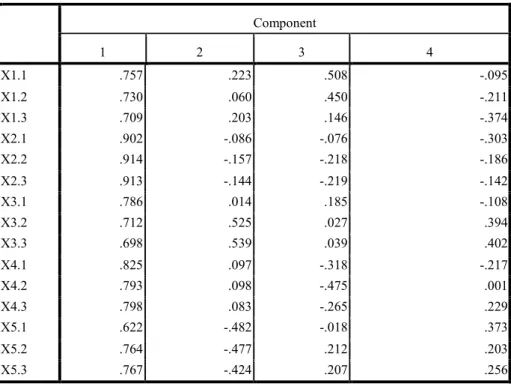
In Table 6, it can be seen that some variables still have a significant correlation value of several factors from the four factors that are formed, making it difficult to make an appropriate interpretation of these factors. To facilitate the interpretation of these four factors, a factor rotation must be performed.
Table 6. Component Matrixa
Component
1 2 3 4
X1.1 .757 .223 .508 -.095
X1.2 .730 .060 .450 -.211
X1.3 .709 .203 .146 -.374
X2.1 .902 -.086 -.076 -.303
X2.2 .914 -.157 -.218 -.186
X2.3 .913 -.144 -.219 -.142
X3.1 .786 .014 .185 -.108
X3.2 .712 .525 .027 .394
X3.3 .698 .539 .039 .402
X4.1 .825 .097 -.318 -.217
X4.2 .793 .098 -.475 .001
X4.3 .798 .083 -.265 .229
X5.1 .622 -.482 -.018 .373
X5.2 .764 -.477 .212 .203
X5.3 .767 -.424 .207 .256
Source: Data processing result, 2019
Factor rotation
The following is the table of Rotated Component Matrix that can be seen in Table 7.
Table 7. Rotated Component Matrixa
Component
1 2 3 4
X1.1 .146 .821 .239 .371
X1.2 .217 .792 .277 .180
X1.3 .472 .673 .032 .171
X2.1 .725 .527 .325 .102
X2.2 .788 .365 .413 .136
X2.3 .770 .346 .424 .172
X3.1 .397 .577 .339 .241
X3.2 .260 .284 .150 .877
X3.3 .239 .284 .140 .885
75 https://jbhost.org
X4.2 .814 .082 .217 .384
X4.3 .587 .120 .377 .515
X5.1 .265 .034 .814 .155
X5.2 .258 .347 .837 .100
X5.3 .242 .330 .825 .170
Extraction Method: Principal Component Analysis, Rotation Method: Varimax with Kaiser Normalization.
Source: Data processing results, 2019
Based on the results value of the rotation, factors are grouped into 4 factors. The results of the rotation factors can be seen in Table 8:
Table 8. Identification of Rotation Results of Buying Interest Factors of Foreign Tourists in the Selection of Accommodations in Tegalalang Village
No Sub Indicator Factor Eigenvalue Loading Faktor
Percent Of Variance
1
(Hotel and Room cleanliness)
(X4.2) Room quality 9,209 0,814 61,391
(Room comfort) X4.1 0,807
(Room is quiet) X4.3
0,587
2.
(Location is accessible) (X1.1)
Location 1.380
0,821
9,199
(Location near by touristic &
cultural sites) (X1.2)
0,792
(Location is close to
supporting facilities
(restaurants, cafes and bar),
shopping center). X1.3
0,673
(Security personnel are
responsible ) X3.1
0,577
(Staff are helpful ) X2.1 0,527
3 (Price is compatible with
service they offered) X5.2
Price 1,105
0,837
7.370
(Price is compatible with
facilities offered) X5.3
0,825
(Price is relatively cheap)
X5.1
0,814
4.
Sprinkler system (X3.3)
Safety of Accommod ation
1.380
0,885
9.199
Fire alarms (X3.2) 0,877
76 https://jbhost.org
Based on the rotation value of factors grouped into 4 factors consisting of the first factor that are 3 factors with an eigenvelue value accounting for 9,209, the second factor has 5 with an eigenvalue accounting for 1.380, the third factor has 3 factors with an eigenvalue value accounting for 1.105, the fourth factor has 2 factors with an eigenvalue value accounting for 9,199.
Interpretation of Factors
The results of factor rotation obtained 4 main factors that are believed to be able to present 15 indicators contained in each of these factors. Of the 15 sub-indicators put into 4 factors that can explain 61,391% of the total variance. The factors consist of:
1. The first factor has 3 significant factor weights. The sub-indicator with the highest weight on this factor is sub-indicator X4.2 (Cleanliness of hotels and rooms) has a correlation value of 0.814. This factor can be defined as a "room quality" factor and is considered capable of presenting existing sub indicators such as room comfort and quiet room atmosphere.
2. The second factor has 5 weighting factor that is significant. The sub-indicator with the highest weighting on this factor is the sub-indicator X1.1 (easily accessible location) having a correlation value accounting for 0.821. This factor can be referred to as the "Location" factor and is considered capable of presenting existing sub-indicators such as proximity to attractions and central culture. The location is close to other facilities such as restaurants, cafes, bars, and shopping centers. Security staffs are very responsible, and employees are very helpful.
3. The third factor has 3 significant factor weights. The sub-indicator with the highest weighting on this factor is X5.2 (Price in accordance with the services provided) which has a correlation value of 0.837. This factor can be defined as the "Price" factor and is considered capable of presenting existing sub-indicators such as, Prices in accordance with the facilities offered, and room prices are relatively cheap.
4. The fourth factor has 2 significant factor weights. The sub-indicator with the highest weight on this factor is X3.3 (There is a Sprinkler system in accommodation) which has a correlation value at 0.885. This factor can be defined as an "accommodation security" factor and is considered capable of presenting sub-indicators of fire alarms.
The result shown that the room quality factor is the dominant factor with the greatest Eigen value, which is 9,209, which can influence buying interest of tourists in choosing accommodation. The quality of the rooms consisting of the cleanliness of the hotel and the rooms, the comfort of the rooms and the quiet atmosphere can affect the interest of tourists. This research was supported by Atkinson (1988) and
77 https://jbhost.org
determining factor was location. Close proximity to central Ubud, shopping centers, road access was also very good and easy to get transportation to make a choice for tourists to stay. They could also rented a motorbike easily at the lodge to travel around other destinations.
Ananth et al. (1992) stated that the price was the most factor that determined the choice of accommodation but in this study the price was as the third factor. This was due to the price of accommodation in accordance with budget travelers. Generally, young people did not have a high income because almost of them achieved a low position on their jobs. With a longer stay up to a week or even a month, of course they would choose an affordable and cheap price. They would also choose to stay in a villa or homestay owned by the local community. The safety factor of accommodation becomed the fourth choice for tourists which influences the choice of accommodation. Most of the villas where they stayed used sprinklers to anticipate fires. This differed from the finding of Chosrichom (2011), Lewis (1985) and Marshall (1993) in which his findings revealed that Factor 1 Security and Safety was the most important factor for security minded travelers. Availability of security personnel were responsible in making the decision to choose a hotel / resort. Tourists considered Bali was still safe and they believed in the safety of accommodation because it also belonged to the local community. In contrast to the research of Choi and Chou (2001) that room quality was the second factor, but in this study room quality was the dominant factor that determined the choice of accommodation. The safety factor however had similarities with this research as a last resort factor. Tat Choi (2000) also stated that security was the last choice for tourists to choose hotels in the Hong Kong hotel industry
CONCLUSION
Characteristics of tourists who stay at accommodation in Tegallalang Village were dominant Australian citizenship 18%, Length of their stay is 3-7 days (72%), based on age in 26-30 years old (36%). Characteristics based on occupation dominant as employed (48%) and purpose of visit for leisure (58%). Tourists choose villa for 68% as a place to stay, this is because the villa is more privacy than others. Factors influencing the buying interest of foreign tourists in choosing accommodation in Tegallalang village are the first is the factor of room quality, the second is the factor of location, the third is factor of price and the fourth is factor of accommodation security. Of the 15 sub-indicators put into 4 factors that can explain 61,391% of the total variance The dominant factor determining it is the room quality factor.
ACKNOWLEDGEMENT
Our thanks to all those who helped us in the preparation of this research including Tegallalang Village Leader, Accomodation business owners, and the visitors of Tegallalang Village.
REFERENCES
78 https://jbhost.org
Atkinson, A. (1988). Answering the eternal question: what does the customer want. Cornell Hotel and Restaurant Administration Quarterly, 29(2), 12–14. Barsky, J. D., & Labagh, R. (1992). A strategy for customer satisfaction. Cornell
Hotel and Restaurant Administration Quarterly, 33(5), 32–40.
Choi, T. Y., & Chu, R. (2001). Determinants of hotel guests’ satisfaction and repeat patronage in the Hong Kong hotel industry. International Journal of Hospitality Management, 20(3), 277–297.
Choosrichom, J. (2011). Factor influencing the selection of hotels/resort in Lantai Yai island, Krabi, Thailand by international travellers. THAIJO, 4(2). Chu, R. K. S., & Choi, T. (2000). An importance-performance analysis of hotel
selection factors in the Hong Kong hotel industry: a comparison of business and leisure travellers. Tourism Management, 21(4), 363–377.
Clow, K. E., Garretson, J. A., & Kurtz, D. L. (1995). An exploratory study into the purchase decision process used by leisure travelers in hotel selection. Journal of Hospitality & Leisure Marketing, 2(4), 53–72.
Gilani Nia, S. (2010). Introduction to Industrial Marketing. Kadvsan Press.
Knutson, B. J. (1988). Frequent travelers: Making them happy and bringing them back. Cornell Hotel and Restaurant Administration Quarterly, 29(1), 82– 87.
Kotler, P., Bowen, J., & Makens, J. (2003). Marketing for hospitality and tourism (3rd ed.). Pearson.
Kotler, Philip, & Keller, K. L. (2008). Manajemen Pemasaran (13th ed., Vol. 1). Macana Jaya Cemerlang.
Lee, F.-H., & Wu, W.-Y. (2011). Moderating effects of technology acceptance perspectives on e-service quality formation: Evidence from airline websites in Taiwan. Expert Systems with Applications, 38(6), 7766–7773.
Lewis, R. C. (1985). Predicting hotel choice: The factors underlying perception. Cornell Hotel and Restaurant Administration Quarterly, 25(4), 82–96. Marshall, A. (1993). Safety tops guest’s priority list; sell security as No. 1 amenity.
Hotel & Motel Management, 208(11), 21.
Morosan, C., & Jeong, M. (2008). Users’ perceptions of two types of hotel reservation Web sites. International Journal of Hospitality Management, 27(2), 284–292.
Richard, A., & Masud, I. (2016). Factors influencing consumer choice in hotel selection in Ghana. International Journal of Economics, Commerce and Management, 4(11), 564–582.
Swarbrooke, J., & Horner, S. (2007). Consumer behaviour in tourism. Routledge. Yavas, U., & Babakus, E. (2005). Dimensions of hotel choice criteria: congruence