THE EVOLUTION OF SURFACES IN ROMANIA, BY CATEGORY OF USE
DURING 2000-2012
MILUȚ MARIUS,CĂLINA JENICA, CROITORU ALIN
University of Craiova, Faculty of Agriculture, e-mail: [email protected]
Key words: area, use category, land fund
ABSTRACT
The work has a a documentary character, based on data provided by the National Institute of Statistics and the specialized work of the cadastre. There are presented data on the distribution of land by use of Romania between 2000-2012 and an analysis of the evolution of these areas in the last decade.
INTRODUCTION
Land use category, individualized by a code, is one of the attributes in the plot and its highlighting in technical cadastre is necessary both to compile the Land Registry and for the establishment of the burdens imposed to real estate.
In Romania, the land fund is divided into two groups: group for agriculture and non-agricultural utilities group, each having five categories of use and approx. 56 subcategories of use.
The surface of use categories can increase or decrease, these developments are closely related to needs of society and market demands.
MATERIAL AND METHOD
Data used in preparing the paper are taken from the National Statistics Institute, therefore they stop at the level of 2012. Are compared the surfaces by category of use in Romania, beginning with year 2000.
DISCUSSIONS
As is known, the surface of the land fund of Romania is 23,839,100 ha, consisting of agricultural and non-agricultural land with small variations that took over the survey period. For the year 2000 data show the following distribution of land use categories:
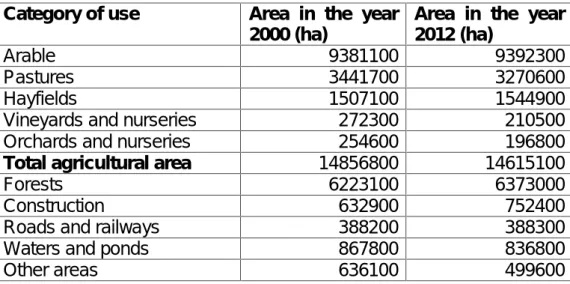
Table 1 Total land fund, by use, in the year 2000 and 2012
Category of use Area in the year
2000 (ha)
Area in the year 2012 (ha)
Arable 9381100 9392300
Pastures 3441700 3270600
Hayfields 1507100 1544900
Vineyards and nurseries 272300 210500
Orchards and nurseries 254600 196800
Total agricultural area 14856800 14615100
If we take as a reference year 2000, the first referred to this study, reveals in 2012 a growth of arable and hayfields areas and a decrease of pastures, vineyards and orchards areas, due to a decrease in agricultural area over 240000 ha. For non-agricultural categories, a significant increase had forests and construction categories, while surface of other areas category (unproductive land) had a significant decrease of over 136,000 ha.
To get a clearer picture of the evolution of these categories of use, is presented the situation for each category of use for 2000 and 2007- 2012 years.
Table 2 Surfaces by category of use and by year (ha)
Category of use Year
2000 2007 2008 2009 2010 2011 2012
Arable 9381100 9423300 9415100 9422500 9404000 9379500 9392300
Pastures 3441700 3330000 3333000 3313800 3288700 3279300 3270600
Hayfields 1507100 1531400 1532400 1528000 1529600 1554700 1544900
Vineyards and vine
nurseries 272300 218000 214500 215400 213600 211300 210500 Orchards and tree
nurseries 254600 206600 207300 205200 198600 196700 196800 Forests 6223100 6314900 6309300 6334000 6354000 6362500 6373000
Construction 632900 685700 692100 703300 728300 749400 752400
Roads and railways 388200 390100 390400 389800 388900 388200 388300
Waters and ponds 867800 849900 849300 833300 833900 822200 836800 Other areas 636100 463200 476400 474900 495400 498700 499600
(www.insse.ro)
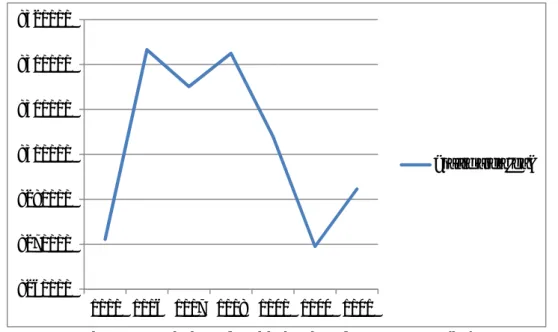
As shown also in Figure 1, arable land fluctuated between 9.379 million ha in 2011 and 9.423 million ha in 2007.
Figure 1. Variation of arable land surfaces per year (ha)
When referring to pastures category, is observed in Figure 2 continues the downward trend of these areas, from 3,441,700 hectares in 2000 to 3,270,700 ha in the last year studied.
9370000 9380000 9390000 9400000 9410000 9420000 9430000
2000 2007 2008 2009 2010 2011 2012
Figure 2. Variation of pastures surfaces in Romania, per year (ha)
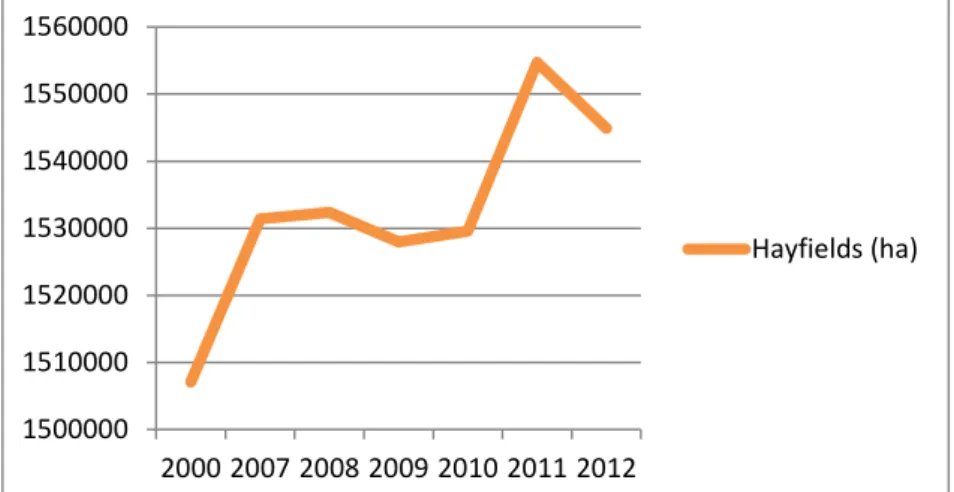
In what concerns the hayfields areas, they had a inverse trend compared with pastures. In Figure 3 is observed their growth every year, except 2012, which do not fit into this trend.
Figure 3. Variation of hayfields surfaces in Romania, per year (ha)
And in the case of areas under vineyards same downward trend recorded over the period studied, leading to 210500 ha in 2012 (Figure 4).
3100000 3200000 3300000 3400000 3500000
2000 2007 2008 2009 2010 2011 2012 Pastures…
1500000 1510000 1520000 1530000 1540000 1550000 1560000
2000 2007 2008 2009 2010 2011 2012
Hayfields (ha)
180000 190000 200000 210000 220000 230000 240000 250000 260000 270000 280000
2000 2007 2008 2009 2010 2011 2012
Figure 5. Variation of orchards surfaces in Romania, per year (ha)
In the case of forests, the statistics show a small but steady increase of surfaces occupied by this category of use, leading in 2012 to an area of 6.373 million ha (Figure 6).
Figure 6. Evolution of forest areas in Romania, by year (ha)
The area occupied by construction has a permanent increase over the period, starting from 632 900 ha in 2000 and reaching to 752 400 ha in 2012 (Figure 7).
150000 200000 250000 300000
2000 2007 2008 2009 2010 2011 2012
Orchards (ha)
6100000 6150000 6200000 6250000 6300000 6350000 6400000
2000 2007 2008 2009 2010 2011 2012
Figure 7. Evolution of construction areas in Romania, by year (ha)
The areas of roads and railways, also waters and ponds remained relatively constant over the period.
In Figure 8 presents the evolution of surfaces in the category Other Areas in Romania. There has been a sharp decrease in these areas between 2000 and 2001 from 636 100 ha to 494 400 ha, followed by a small but steady increase annually, reaching 499 600 ha in 2012 (Figure 8).
Figure 7. The evolution of surfaces occupied by the category Other Areas in Romania, by year (ha)
CONCLUSIONS
1. Surface of use categories can increase or decrease, these developments are closely related to needs of society and market demands.
2. Of the total area of 23839100 ha Land Fund, agricultural use categories were
560000 580000 600000 620000 640000 660000 680000 700000 720000 740000 760000
2000 2007 2008 2009 2010 2011 2012
Construction (ha)
0 100000 200000 300000 400000 500000 600000 700000
2000 2007 2008 2009 2010 2011 2012
4. For other categories of agricultural land - vineyards and orchards, the area had a decreasing trend over the period.
5. For categories of non-agricultural use, land occupied by construction has a permanent increase over time.
6. In the case of forests statistics contradict any idea that their area has decreased. It is observed increase the area covered by forests, from 6.223 milion ha in 2000 to 6.373 million in 2012.
BIBLIOGRAPHY
1. Călina A. and colab., 2010 – Topografie generală şi inginerească, Editura Sitech, Craiova, ISBN 973-657-945-X;
2. Miluț M., Călina Jenica, Călina A., Croitoru Alin, 2014, Elaborating documentations for changing the category of use to construct a field of photovoltaic panels, Annals of the University of Craiova - Agriculture, Montanology, Cadastre Series, pag. 127-131, Vol. XLIV/2 2014;
3.Călina Jenica, Călina A., Miluț M., Băbucă N.-Surveying data processing for extension, land registration and construction improvement, Annals of the University of Craiova - Agriculture, Montanology, Cadastre Series, pag. 47- 57, Vol. XLIV/2 2014;