Volume 3 No. 2 | December 2018: 110-115 DOI: 10.15575/join. join.v3i2.2
05
Received: May 25, 2018; Revised: January 25, 2018; Accepted: January 25, 2019; Published: February 1, 2019
110
Analysis of Backpropagation Algorithm in
Predicting the Most Number of Internet Users
in the World
Sunil Setti
1, Anjar Wanto
21,2
STIKOM Tunas Bangsa, Pematangsiantar, Indonesia
1[email protected],
2[email protected]
Abstract- The Internet today has become a primary need for its users. According to market research company e-Marketer, there are 25 countries with the largest internet users in the world. Indonesia is in the sixth position with a total of 112.6 million internet users. With the increasing number of internet users are expected to help improve the economy and also education in a country. To be able to increase the number of internet users, especially in Indonesia, it is necessary to predict for the coming years so that the government can provide adequate facilities and pre-facilities in order to balance the growth of internet users and as a precautionary step when there is a decrease in the number of internet users. The data used in this study focus on data on the number of internet users in 25 countries in 2013-2017. The algorithm used is Artificial Neural Network Backpropagation. Data analysis was processed by Artificial Neural Network using Matlab R2011b (7.13). This study uses 5 architectural models. The best network architecture generated is 3-50-1 with an accuracy of 92% and the Mean Squared Error (MSE) is 0.00151674.
Keywords- Analysis, Backpropagation, Prediction, Internet, World
Abstrak- Internet saat ini sudah menjadi kebutuhan primer untuk para penggunanya. Menurut lembaga riset pasar
e-Marketer, ada 25 negara teratas dengan pengguna internet terbanyak di dunia. Indonesia berada pada posisi keenam dengan jumlah pengguna internet sebanyak 112,6 juta jiwa. Dengan semakin meningkatnya jumlah pengguna internet diharapkan dapat ikut memajukan perekonomian dan juga pendidikan di suatu negara. Untuk dapat meningkatankan jumlah pengguna internet, khususnya di Indonesia maka perlu dilakukan prediksi untuk tahun-tahun mendatang sehingga pemerintah dapat menyediakan sarana dan pra-sarana yang memadai guna untuk mengimbangi pertumbuhan jumlah pengguna internet dan sebagai langkah antisipasi saat terjadi penurunan jumlah pengguna internet. Data yang digunakan pada penelitian ini fokus pada data jumlah pengguna internet di 25 negara tahun 2013-2017. Algoritma yang digunakan yaitu Jaringan Syaraf Tiruan Backpropagation. Analisa data dilakukan dengan metode Jaringan Syaraf Tiruan menggunakan software Matlab R2011b (7.13). Penelitian ini menggunakan 5 model arsitektur. Arsitektur jaringan terbaik yang dihasilkan adalah 3-50-1 dengan tingkat akurasi 92% dan nilai Mean Squared Error (MSE) adalah 0,00151674.
Kata kunci- Analisis, Backpropagation, Prediksi, Internet, Dunia
I. INTRODUCTION
Since the discovery of internet technology in the 1990s, the use of internet technology has expanded because it’s seen as providing enormous benefits for the smooth process of various activities [1]. In this information era, internet has placed itself as one of the centers of information that can be accessed from various places without being limited by space and time. The internet is called a barrier free information center because it can connect one site to another site in short time [2].
Internet has become a primary need for its users nowadays [3]. The growth of internet users is increasing along with the increasingly diverse benefits of the internet itself. With the increasing number of internet users, it is expected to be able to advance the economy and also education in the country concerned.
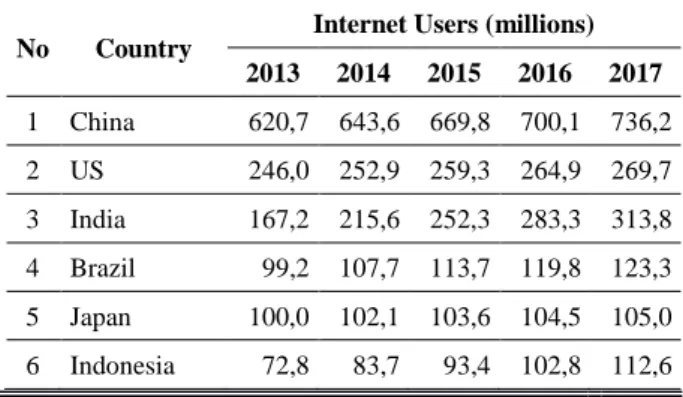
According to the market research institute, e-Marketer, there are 25 top countries with the highest number of internet users in the world. Until now it is known that China is the country with the most internet users with
a total of 736.2 million users in 2017. In Indonesia alone internet users continue to increase from year to year with an extraordinary percentage increase [4], at present Indonesia is in sixth place after Japan with 112.6 million internet users. And ranked 25th by South Africa with 29.2 million internet users. For more details can be seen in table 1 below:
Table 1. Internet Users In The Top 25 Countries In The World
No Country Internet Users (millions) 2013 2014 2015 2016 2017
1 China 620,7 643,6 669,8 700,1 736,2
2 US 246,0 252,9 259,3 264,9 269,7
3 India 167,2 215,6 252,3 283,3 313,8
4 Brazil 99,2 107,7 113,7 119,8 123,3
5 Japan 100,0 102,1 103,6 104,5 105,0
111
No Country Internet Users (millions)2013 2014 2015 2016 2017
7 Russia 77,5 82,9 87,3 91,4 94,3
8 Germany 59,5 61,6 62,2 62,5 62,7
9 Mexico 53,1 59,4 65,1 70,7 75,7
10 Nigeria 51,8 57,7 63,2 69,1 76,2
11 UK 48,8 50,1 52,3 52,4 53,4
12 France 48,8 49,7 50,5 51,2 51,9
13 Philippines 42,3 48,0 53,7 59,1 64,5
14 Turkey 36,6 41,0 44,7 47,7 50,7
15 Vietnam 36,6 42,5 44,4 48,2 52,1
16 South Korea 40,1 40,4 40,6 40,7 40,9
17 Egypt 34,1 36,0 38,3 40,9 43,9
18 Italy 34,5 35,8 36,2 37,2 37,5
19 Spain 30,5 31,6 32,3 33,0 33,5
20 Canada 27,7 28,3 28,8 29,4 29,9
21 Argentina 25,0 27,1 29,0 29,8 30,5
22 Colombia 24,2 26,5 28,6 29,4 30,5
23 Thailand 22,7 24,3 26,0 27,6 29,1
24 Poland 22,6 22,9 23,3 23,7 24,0
25 South Africa 20,1 22,7 25,0 27,2 29,2
One of the advantages of increasing internet users is the increasing public insight especially among students. Another advantage is that it can increase business opportunities for the community, both middle and upper class, for example by having online shops and online transportation. With the increasing business opportunities, it also helps open employment opportunities for the community and this also helps increase per capita income from a country, especially Indonesia. Therefore, one way we can do to increase internet users, especially in Indonesia is to make predictions (forecasting) for the years to come. Thus, the government can provide adequate facilities and pre-facilities to offset the growth of internet users and vice versa the government can also take steps to anticipate when there is a decline in internet users. But the prediction process is not easy, it takes a basic model and time series data from these problems, which are generally complicated by estimating accuracy that is not easily achieved, so that it requires more advanced techniques [5]. Backpropagation is one method that is quite good at making predictions (forecasting). It is expected that with the use of this method the results will be as desired, because the backpropagation algorithm allows to avoid difficulties by using learning rules that are similar to the plasticity of time spikes that depend on synapses.
In previous studies, [6] conduct research to predict the value of the rupiah exchange rate against US Dollar using Backpropagation Gradient Descent Time Series with Conjugate Gradient optimization. The results show the MSE value in the basic backpropagation gradient descent algorithm of 1.02159 and the conjugate gradient produces
MSE of 0.0198012. From these results, the conjugate gradient algorithm is superior because it produces smaller errors. Furthermore, [7] predicts stock price movements for BRI as a government bank and BCA as a private bank which is the best bank based on its core capital which is above 30 trillion Rupiah in 2013 with the Backpropagation Neural Network method. This study produced the smallest RMSE of 0.0626 and MAE namely 0.0456 with an architectural model of 10-5-1 for closing prices at BCA and for the closing price at BRI the smallest RMSE results were 0.084 and MAE 0.0487 with the same architectural model. Research by [8] conducted to predict the inflation rate in Indonesia using the Backpropagation method. Data were analyzed using Cross Validation techniques. Based on the results of the study, it was found that neural networks with cross validation 80% Training and 20% validation and testing as well as learning rate 0.1 and the number of epochs 10000 were able to provide small MSE and MAE values, and forecasting results approached actual data.
II. METHOD
A. ANALYSIS
Analysis is defined as solving or separating a communication (event, understanding) into its constituent elements, so that the idea (understanding, concept) is relatively clearer and / or the relationship between ideas is more explicit [9].
B. BACKPROPAGATION
Backpropagation is one method in artificial neural networks that uses supervised learning that is popular and has advantages in its learning abilities [10]. The backpropagation algorithm is used for training. The backpropagation algorithm is an easy and simple iterative algorithm that usually performs well, even with complex data. Unlike other learning algorithms (such as Bayesian learning), backpropagation has good computing properties especially when large-scale data is presented [11]. Training with backpropagation is like training on other neural
networks. During the training process with
backpropagation, weights are arranged iteratively to minimize errors that occur [12].
C. PREDICTION
Prediction (forecasting) is estimating something in the future based on past data that is analyzed scientifically [13][14]
D. INTERNET
Analysis of Backpropagation Algorithm in Predicting the Most Number of Internet Users in the World
(Sunil Setti, Anjar Wanto)
112
internet, the number of internet users every year around the world and in Indonesia also has increased [17].
E. THE RESEARCH FRAMEWORK
The research framework used in solving this research problem.
Figure 1. The research framework
Based on the framework in figure 1, each step can be described as follows:
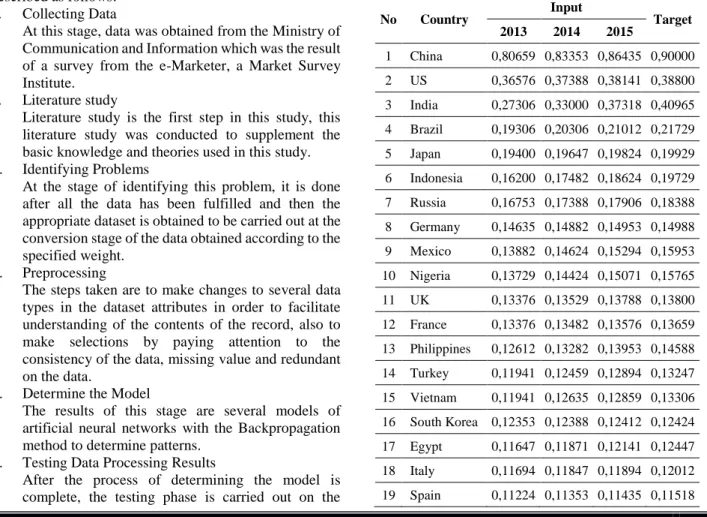
1. Collecting Data
At this stage, data was obtained from the Ministry of Communication and Information which was the result of a survey from the e-Marketer, a Market Survey Institute.
2. Literature study
Literature study is the first step in this study, this literature study was conducted to supplement the basic knowledge and theories used in this study.
3. Identifying Problems
At the stage of identifying this problem, it is done after all the data has been fulfilled and then the appropriate dataset is obtained to be carried out at the conversion stage of the data obtained according to the specified weight.
4. Preprocessing
The steps taken are to make changes to several data types in the dataset attributes in order to facilitate understanding of the contents of the record, also to make selections by paying attention to the consistency of the data, missing value and redundant on the data.
5. Determine the Model
The results of this stage are several models of artificial neural networks with the Backpropagation method to determine patterns.
6. Testing Data Processing Results
After the process of determining the model is complete, the testing phase is carried out on the
results of data processing using Matlab R2011b Software (7.13).
7. Predict
Predictions are made to compare the number with the Artificial Neural Network model with the most accurate Backpropagation method.
8. Final evaluation
9. Final evaluation is done to find out whether the data processing testing results are as expected.
F. DATA USED
The data used in this study is data on the number of Internet users in 25 major countries in the world in 2013-2017 (can be seen in Table 1 in the previous discussion). The training data that will be used are data from 2013-2015 with a target for 2016. While the testing data to be used is data for 2014-2016 with a target for 2017.
G. DATA NORMALIZATION
Before processing, the data is normalized first using the Sigmoid function (never reaches 0 or 1), then the data transformation is carried out at smaller intervals, namely [0.1; 0.9], indicated by equation (1).
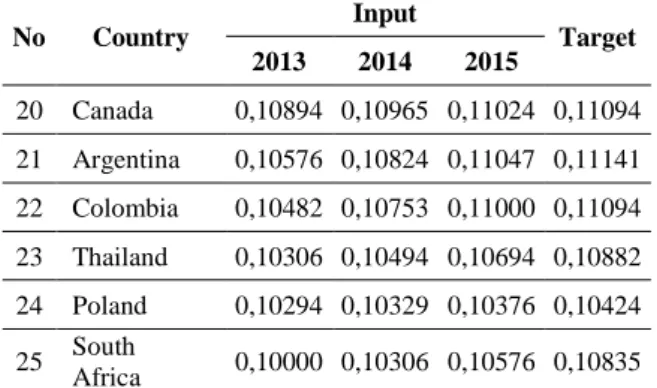
In tables 2 and 3 can be seen training data and data testing that has been normalized using the equation (1)
Table 2. Data Training Normalization
No Country
Input
Target 2013 2014 2015
1 China 0,80659 0,83353 0,86435 0,90000
2 US 0,36576 0,37388 0,38141 0,38800
3 India 0,27306 0,33000 0,37318 0,40965
4 Brazil 0,19306 0,20306 0,21012 0,21729
5 Japan 0,19400 0,19647 0,19824 0,19929
6 Indonesia 0,16200 0,17482 0,18624 0,19729
7 Russia 0,16753 0,17388 0,17906 0,18388
8 Germany 0,14635 0,14882 0,14953 0,14988
9 Mexico 0,13882 0,14624 0,15294 0,15953
10 Nigeria 0,13729 0,14424 0,15071 0,15765
11 UK 0,13376 0,13529 0,13788 0,13800
12 France 0,13376 0,13482 0,13576 0,13659
13 Philippines 0,12612 0,13282 0,13953 0,14588
14 Turkey 0,11941 0,12459 0,12894 0,13247
15 Vietnam 0,11941 0,12635 0,12859 0,13306
16 South Korea 0,12353 0,12388 0,12412 0,12424
17 Egypt 0,11647 0,11871 0,12141 0,12447
18 Italy 0,11694 0,11847 0,11894 0,12012
19 Spain 0,11224 0,11353 0,11435 0,11518
1 . 0 ) ( 8 . 0
' +
− − =
a b
a x
x
(1)
Start
Collecting Data Literature Study
Preprocessing
Predicting
Final Evaluation Results of Data Processing
Determining Pattern
Journal, Proceeding, and Artificial Neural Network Books
Problem Identification
113
No Country Input Target
2013 2014 2015
20 Canada 0,10894 0,10965 0,11024 0,11094
21 Argentina 0,10576 0,10824 0,11047 0,11141
22 Colombia 0,10482 0,10753 0,11000 0,11094
23 Thailand 0,10306 0,10494 0,10694 0,10882
24 Poland 0,10294 0,10329 0,10376 0,10424
25 South
Africa 0,10000 0,10306 0,10576 0,10835
Table 3. Data Testing Normalization
No Country
Input
Target 2014 2015 2016
1 China 0,79617 0,82555 0,85952 0,90000
2 US 0,35811 0,36528 0,37156 0,37694
3 India 0,31629 0,35744 0,39219 0,42639
4 Brazil 0,19530 0,20203 0,20887 0,21280
5 Japan 0,18903 0,19071 0,19172 0,19228
6 Indonesia 0,16840 0,17927 0,18981 0,20080
7 Russia 0,16750 0,17243 0,17703 0,18028
8 Germany 0,14362 0,14429 0,14463 0,14485
9 Mexico 0,14115 0,14754 0,15382 0,15943
10 Nigeria 0,13924 0,14541 0,15203 0,15999
11 UK 0,13072 0,13319 0,13330 0,13442
12 France 0,13027 0,13117 0,13196 0,13274
13 Philippines 0,12837 0,13476 0,14081 0,14687
14 Turkey 0,12052 0,12467 0,12803 0,13139
15 Vietnam 0,12220 0,12433 0,12859 0,13296
16 South Korea 0,11985 0,12007 0,12018 0,12041
17 Egypt 0,11491 0,11749 0,12041 0,12377
18 Italy 0,11469 0,11514 0,11626 0,11659
19 Spain 0,10998 0,11076 0,11155 0,11211
20 Canada 0,10628 0,10684 0,10751 0,10807
21 Argentina 0,10493 0,10706 0,10796 0,10875
22 Colombia 0,10426 0,10662 0,10751 0,10875
23 Thailand 0,10179 0,10370 0,10549 0,10718
24 Poland 0,10022 0,10067 0,10112 0,10146
25 South Africa 0,10000 0,10258 0,10505 0,10729
III.RESULT AND DISCUSSION
A. ANALYSIS
Before the training is carried out, the desired parameter value is first determined to obtain optimal results. The general parameters used which will later be included in the Matlab 2011b application for training and testing can be seen in the following code:
>>net=newff(minmax(P),[Hidden,Target],{'logsig','pureli n'},'traingd');
>> net.LW{1,1}; >> net.b{1}; >> net.LW{2,1}; >> net.b{2};
>> net.trainParam.epochs=10000; >> net.trainParam.goal=0.001; >> net.trainParam.Lr=0.01; >> net.trainParam.show=1000; >> net=train(net,P,T);
B. RESULT
This study uses 5 architectures, including 3-5-1, 3-7-1, 3-19-3-7-1, 3-43-3-7-1, 3-50-1. Of these 5 architectures, the best architecture is 3-50-1 with an accuracy rate of 92% and epoch as many as 4218 iterations.
Figure 2. Best Data Training with Architecture 3-50-1
From Figure 2, it can be explained that the Epoch which occurred was 4218 with a duration of 19 seconds. The architectural model 3-50-1 means that 3 is input data, 50 is a hidden layer while 1 is the output or result.
Analysis of Backpropagation Algorithm in Predicting the Most Number of Internet Users in the World
(Sunil Setti, Anjar Wanto)
114
Table 4. Best Architecture with Backpropagation Data Testing
Pola Target Output Error SSE Result
1 0,90000 0,96340 -0,06340 0,00401956 1
2 0,37694 0,52770 -0,15076 0,02272718 1
3 0,42639 0,32680 0,09959 0,00991837 0
4 0,21280 0,22350 -0,01070 0,00011457 1
5 0,19228 0,21500 -0,02272 0,00051631 1
6 0,20080 0,18130 0,01950 0,00038021 0
7 0,18028 0,18280 -0,00252 0,00000635 1
8 0,14485 0,15200 -0,00715 0,00005113 1
9 0,15943 0,15460 0,00483 0,00002328 1
10 0,15999 0,15310 0,00689 0,00004742 1
11 0,13442 0,13790 -0,00348 0,00001210 1
12 0,13274 0,13710 -0,00436 0,00001901 1
13 0,14687 0,14240 0,00447 0,00001996 1
14 0,13139 0,13140 -0,00001 0,00000000 1
15 0,13296 0,13260 0,00036 0,00000013 1
16 0,12041 0,12420 -0,00379 0,00001439 1
17 0,12377 0,12410 -0,00033 0,00000011 1
18 0,11659 0,11990 -0,00331 0,00001093 1
19 0,11211 0,11480 -0,00269 0,00000724 1
20 0,10807 0,11060 -0,00253 0,00000639 1
21 0,10875 0,11140 -0,00265 0,00000705 1
22 0,10875 0,11100 -0,00225 0,00000508 1
23 0,10718 0,10890 -0,00172 0,00000297 1
24 0,10146 0,10400 -0,00254 0,00000646 1
25 0,10729 0,10880 -0,00151 0,00000229 1
Total 0,03791849
92%
MSE 0,00151674
In table 5 we can see a comparison of the 5 network architecture models used. From the 5 architectural models, the Epoch level and time are obtained using the Matlab 2011b application, while the MSE and Accuracy of each architectural model are obtained using calculations in Microsoft Excel. Based on table 5, the best architectural models are 3-50-1 with an accuracy rate of 92%.
Table 5. Comparison of Accuracy of All Architectural Models
No Architecture Training Testing Epoch Time MSE Accuracy
1 3-5-1 3942 00:15 0,00093729 80%
2 3-7-1 1136 00:05 0,00071043 68%
3 3-19-1 2726 00:12 0,00113505 56%
4 3-43-1 705 00:03 0,00102460 48%
5 3-50-1 4218 00:19 0,00151674 92%
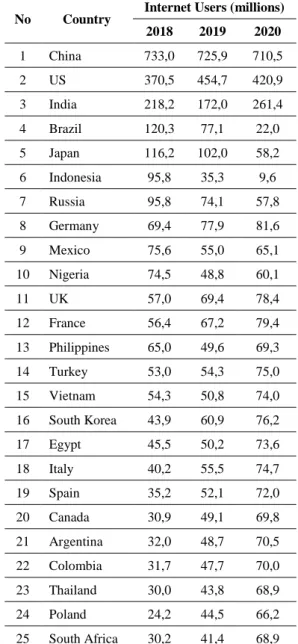
In table 6, we can see the prediction of the number of internet users in the world for the next 3 years, namely 2018-2020. The results are obtained from calculations with the best architectural model (3-50-1) using the Matlab 2011b application and Microsoft Excel, just as in the previous discussion.
Table 6. Prediction of the Number of Internet Users in the World for the Next 3 Years with the Backpropagation algorithm
(Year 201-2020)
No Country Internet Users (millions) 2018 2019 2020
1 China 733,0 725,9 710,5
2 US 370,5 454,7 420,9
3 India 218,2 172,0 261,4
4 Brazil 120,3 77,1 22,0
5 Japan 116,2 102,0 58,2
6 Indonesia 95,8 35,3 9,6
7 Russia 95,8 74,1 57,8
8 Germany 69,4 77,9 81,6
9 Mexico 75,6 55,0 65,1
10 Nigeria 74,5 48,8 60,1
11 UK 57,0 69,4 78,4
12 France 56,4 67,2 79,4
13 Philippines 65,0 49,6 69,3
14 Turkey 53,0 54,3 75,0
15 Vietnam 54,3 50,8 74,0
16 South Korea 43,9 60,9 76,2
17 Egypt 45,5 50,2 73,6
18 Italy 40,2 55,5 74,7
19 Spain 35,2 52,1 72,0
20 Canada 30,9 49,1 69,8
21 Argentina 32,0 48,7 70,5
22 Colombia 31,7 47,7 70,0
23 Thailand 30,0 43,8 68,9
24 Poland 24,2 44,5 66,2
25 South Africa 30,2 41,4 68,9
IV.CONCLUSION
From this research, conclusions can be taken as follows:
1. With the 3-50-1 architectural model, it can make predictions with 92% accuracy.
2.
The selection of network architecture models and parameters used greatly affects the level of accuracy [18][19].115
4. The advantages of this research are the results of predictions that are not much different from the initial data.
V. REFERENCES
[1] S. P. Lestari, “Hubungan antara Terpaan Iklan
(Advertising Exposure) dan Kualitas Produk Dengan Keputusan Menggunakan Telkom Speedy di Wilayah Kota Semarang,” Majalah Ilmiah Inspiratif, vol. 3, no. 5, pp. 1–15, 2018.
[2] I. Novianto, “Perilaku Penggunaan Internet di Kalangan Mahasiswa,” Libri_Net, vol. 2, no. 1, pp. 1–40, 2013. [3] Y. Warisyah, “Pentingnya ‘Pendampingan Dialogis’
Orang Tua Dalam Penggunaan Gadget Pada Anak Usia Dini,” in Inovasi Pembelajaran untuk Pendidikan Berkemajuan, 2015, no. November 2015, pp. 1–9.
[4] Dulkhatif, Andi Tri Haryono, and Moh Mukeri Warso,
“Pengaruh Kualitas Pelayanan, Kepuasan Pelanggan dan Lokasi terhadap Loyalitas Pelanggan pada penyedia jasa internet Study PT Noken Mulia Tama Semarang,” J. Manage., vol. 2, no. 2, pp. 1–34, 2016.
[5] A. Wanto, “Penerapan Jaringan Saraf Tiruan Dalam Memprediksi Jumlah Kemiskinan Pada Kabupaten/Kota Di Provinsi Riau,” Kumpul. J. Ilmu Komput., vol. 5, no. 1, pp. 61–74, 2018.
[6] H. Y. Sari, “Optimasi Conjugate Gradient Pada
Algoritma Backpropagation Neural Network Untuk Prediksi Kurs Time Series,” J. Gema Aktual., vol. 5, no. 1, pp. 86–90, 2016.
[7] A. Novita, “Prediksi Pergerakan Harga Saham Pada
Bank Terbesar Di Indonesia Dengan Metode
Backpropagation Neural Network.”
[8] I. Saluza, “Aplikasi Metode Jaringan Syaraf Tiruan Backpropagation dalam Meramal Tingkat Inflasi di Indonesia,” J. Gradien, vol. 11, no. 1, pp. 1075–1078, 2015.
[9] J. Geofana, B. Mallo, and D. Ismaimuza, “Analisis Penyelesaian Soal Tingkat Tinggi pada Materi Luas Permukaan dan Volume Prisma Oleh Siswa Kelas IX Smp Negeri 4 Palu,” J. Elektron. Pendidik. Mat. Tadulako, vol. 4, no. 4, pp. 473–480, 2017.
[10] R. R. M. Salim and A. S. Jauhari, “Perancangan Pengenalan Karakter Alfabet menggunakan Metode Hybrid Jaringan Syaraf Tiruan,” J. SIFO Mikroskil, vol. 17, no. 1, pp. 109–118, 2016.
[11] S. P. Siregar and A. Wanto, “Analysis of Artificial Neural Network Accuracy Using Backpropagation Algorithm In Predicting Process ( Forecasting ),” Int. J. Inf. Syst. Technol., vol. 1, no. 1, pp. 34–42, 2017. [12] F. R. D. B. Simangunsong and S. D. Nasution, “Aplikasi
Jaringan Saraf Tiruan Untuk Memprediksi Jumlah Pasien Rawat Inap dengan Metode Back Propagation,” J. Ris. Komput., vol. 2, no. 6, pp. 43–47, 2015.
[13] P. Sutanto, A. Setiawan, and D. H. Setiabudi, “Perancangan Sistem Forecasting di Perusahaan Kayu UD . 3G dengan Metode ARIMA,” J. Infra, vol. 5, no. 1, pp. 325–330, 2017.
[14] A. Wanto, M. Zarlis, Sawaluddin, and D. Hartama,
“Analysis of Artificial Neural Network
Backpropagation Using Conjugate Gradient Fletcher Reeves in the Predicting Process,” J. Phys. Conf. Ser., vol. 930, no. 1, pp. 1–7, 2017.
[15] A. T. Yudha, “Game Online dan Berpikir Kreatif,” J. FLOW, vol. 2, no. 12, pp. 1–10, 2016.
[16] I. F. Amir, H. Cangara, and M. Farid, “Implementasi Program M-PLIK Kemkominfo Terhadap Pengenalan
Dan Pemanfaatan Internet Bagi Masyarakat Kabupaten Maros Dan Jeneponto,” J. Komun. KAREBA, vol. 3, no. 3, pp. 170–178, 2014.
[17] C. Nisak and N. Lubis, “Pengaruh Harga, Keragaman Model Produk, Kualitas Informasi dan Kepercayaan Terhadap Keputusan Pembelian Online pada Toko Tas Online Sabilla Store,” J. Ilmu Adm. Bisnis, vol. 5, no. 3, pp. 1–12, 2016.
[18] A. Wanto, “Optimasi Prediksi Dengan Algoritma
Backpropagation Dan Conjugate Gradient Beale-Powell Restarts,” J. Teknol. dan Sist. Inf., vol. 3, no. 3, pp. 370– 380, 2017.