Sanata Dharma University, Yogyakarta, Indonesia
21
ENHANCING DESCRIPTIVE WRITING ACHIEVEMENT BY APPLYING PROCESS APPROACH THROUGH ENVIRONMENTAL
OBSERVATION
Riana Febriyanti, Rita Inderawati, and Fiftinova Sriwijaya University
[email protected], [email protected], and [email protected] DOI: doi.org/10.24071/llt.2018.Suppl2103
received 25 March 2018; revised 9 June 2018; accepted 20 June 2018
Abstract
This study aimed at finding out whether or not: (1) there was a significant difference in descriptive writing achievement after they were taught by using process approach through environmental observation and (2) there was a significant difference in descriptive writing achievement between the students who were taught by using process approach through environmental observation and those who were not. By employing a quasi-experimental design, the sample of this study was 80 students of tenth graders of SMA Negeri 9 Palembang taken by using purposive sampling method. The data were analyzed by using paired sample and independent sample t-test. The result of this study showed that: (1) there was significant improvement in descriptive writing achievement of the experimental group; mean difference of post-test and pre-test was 7.500 and the significance value was 0.000 (p-value<0.05), and (2) there was significant difference in descriptive writing achievement between the students who were taught by applying process approach through environmental observation and those who were not. The mean difference of the post-test of the experimental group was higher than the control group (7.537>0.128) and the significance value was 0.000 (p-value<0.05). Therefore, process approach through environmental observation is effective to enhance students’ descriptive writing achievement.
Keywords: Process Approach, Environmental Observation, Descriptive Writing Achievement
Introduction
22
Besides, ASEAN Economic Community (AEC) also becomes a great challenge for Indonesian. Many kinds of products and labors from other ASEAN countries will come freely to Indonesia. It means that the competition in finding a job will become more competitive. Martin (as cited in Situmorang, 2015) says that English proficiency is closely related to economic competition. Not only multinational companies but also local companies require spoken and written English as one of the main capabilities. Karmawan (as cited in Supriadi, 2015) also states that English is required in the workplace as communication skill and to support business communication, such as negotiation and report writing. Unfortunately, based on the research of ASEAN Studies Center (as cited in Supriadi, 2015), the quality of Indonesian workers are still inadequate, particularly in terms of English competence.
Furthermore, based on curriculum 2006, the tenth graders of Senior High School are required to be able to write various types of genres such as recount text, narrative text, procedure text, and descriptive text. And the main focus for the second semester of the tenth grade is writing descriptive text. However, the fact shows that tenth grader students’ descriptive writing achievements are still far from good. Three of the five studies (Hami (2014); Prastihana (2014); Purnomo (2014); Nurfarhati (2015); and Riyanti (2015)) found by the writer about descriptive text show that students’ descriptive writing achievement do not increase too significant.
Although most students have learned English writing from Elementary School up to Senior High School, most of them cannot write well. Based on the data during Teaching Practice Program (PPL) and the data from an interview with the English teacher of tenth graders of SMA Negeri 9 Palembang, it was found that the students have problems in writing. The minimal completeness criterion (KKM) is 70, but their average score of writing skill is 59. Besides, the students also lack interest to write and they intend to copy some passages from the internet to fulfill their assignment. The teachers of the tenth graders is also a problem. She is not very active in the classroom and she only gives the students some exercise with a little explanation in every meeting. Therefore, creative strategies to make teaching writing more effective and interested were entailed
Based on the statement above, teachers have to be able to organize teaching-learning activity. Teachers have to use fun method, technique, or strategy to attract the students’ attention and make them able to write. Teachers also have to apply an approach that can control the learning process to prevent fraud.
23
When the teacher taught by using the process approach, the environmental observation also was used to revive the learning vigor of students. This strategy is important in order to make the learning process alive. A research using environmental observation strategy was ever undertaken by Harmenita and Tiarina (2013) from FBS Negeri Padang University. The study showed that this strategy can increase the students’ attention and motivation during classroom writing activity. More importantly, Paragraph Writing course had been implemented by applying environmental observation strategy. The students were observing many kinds of aspects such as person, place, and other things. It also showed that this strategy was successfully improving students’ writing achievement.
Based on the explanation above, the problems of this study were formulated in questions below:
a. Was there any significant difference in descriptive writing achievement of the tenth graders of SMA Negeri 9 Palembang after they were taught by using process approach through environmental observation?”
b. Was there any significant difference in descriptive writing achievement of the tenth graders of SMA Negeri 9 Palembang who were taught by using process approach through environmental observation and those who were not?
Writing is the medium to express the ideas, opinion, and thought to inform other people. Brannan (2009, p. 10) states, "Writing is a creative process. It is an intellectual exercise that results a symbolic product, be it a book, story, play report, essay, memo, letter, or paragraph.” According to Hogue (2003, p. 255), “Writing is a process of creating, organizing, and polishing”. Webster (1999) states that writing as a way of discovering ideas as well as a way of expressing them. In other words, writing is the creative process of communicating the ideas, thought, or feeling on the written form. Obviously, the purpose of writing is to inform and communicate other people about the writers’ ideas.
A descriptive paragraph is a part of factual genres. Its social function is to describe a particular person, place or thing (Wardiman & Artono, 2008, p. 122). Hammound (2010, p. 121) also says that the primary purpose of the descriptive text is to describe a person, place, or thing in such way that the picture is formed in the readers’ mind.
The process approach is an approach developed by Flower and Hayes in 1981. Process approach emphasizes the writing process, not the final product. In the end, learners surely need to and require to complete their products, yet the writing process itself is stressed more (Onozawa, 2010, p. 154). Tribble (1996, p. 160) also states that a process approach is an approach which focuses on the creativity of the individual writer, and which pays attention to the development of the good writing practices rather than the product. Sun and Feng (2009: 155) in their research concluded that It is concluded that teaching writing by applying the process approach could achieve an optimal teaching effect.
24
p. 492). Then, observation is the act of watching somebody or something carefully for a period of time, especially to learn something (Hornby, 2010, p. 1013). Lake (2009) says that observation is a method of collecting data in which the situation, the relevant fact, action, and behavior are recorded. Therefore, Harmenita and Tiarina (2013, p. 32) state that environmental observation is an observation technique which involves observing a behavior as it occurs in the natural environment.
Tribble (1996, p. 9) proposes a typical four states model of process approach: pre-writing, composing/drafting, revising, and editing. And environmental observation takes place in the pre-writing stage.
Step 1: Pre-writing (Generating Idea/ Observing through Environmental Observation)
First, the students will be given knowledge about descriptive text and environmental observation. Then, they will be given a theme to describe. They will have some times to generate idea by observing the thing or place that they will describe. While observing, the students have to take note of it to help them formulate the paragraph afterward.
Step 2: Composing/drafting
The second step is the time for the students to write their description of the note without worrying too much about spelling and grammar. What is important in this step is that the writer keeps on their writing and let their ideas flow.
Step 3: Revising
In this step, the students will be asked to work in pairs. They will be correcting their work each other. The components that have to revise such as order, meaning, spelling, grammar, and punctuation. To help the students revise the paragraph, the writer provides guidance, as shown below:
Descriptive writing rubric for students: 1. What is the topic of the text?
2. Does the topic of the text reflect the title?
3. What do you think about your friend’s paragraph? Explain your reason! 4. Is the arrangement of the text suitable for the generic structure?
5. Give opinion about your friend’s first paragraph (identification)? 6. Give opinion about your friend’s description?
7. Is there miss-spelling, wrong grammar, and punctuation in your friend’s paragraph?
(Source: adapted from Oshima & Hogue, 1999) Step 4: Editing
In the last step, the students rewrite the part of the paragraph which has already revised by their friend.
The most difficult step in this study was revising. It was because the students did not have a great foundation in grammar and punctuation.
Method
25
they control some but not all of the sources of internal invalidity." This design consisted of two groups which were the control group and experimental group. The population of this study was 320 tenth grade students at SMA Negeri 9 Palembang, and the sample of this study was 80 tenth grade students. Each group had 40 students. The technique of selecting the sample was purposive sampling by having X.D as the experimental group and X.E as the control group because they were taught by the same English teacher and they had the same English level.
In this study, only the experimental group was given the treatment while the control group was not given any treatment. During the treatment, the experimental group was taught by applying process approach through environmental observation for 20 meeting including pretest and posttest.
To collect the data, both experimental group and control group were assigned a writing test. The students were assigned the test twice as pretest and posttest. The pretest was administered before the writer started the experimental study. Meanwhile, the posttest was administered after the end of writing experimental teaching.
The test was constructed based on content validity that was consulted to two experts. Creswell (2012, p. 618) states, “Content validity is the extent to which the questions on the instrument and the scores from these questions are representative of all the possible questions that a researcher could ask about the content or skills.” To know the test is appropriate or not, the curriculum, syllabus, and students' textbook used by the tenth graders of SMA Negeri 9 Palembang were checked their appropriateness. Next, two expert judgments were needed. The test item was constructed based on the table of test specifications so that the writing test had a high degree of content-related evidence of validity.
To check the reliability of the test, two raters were employed to give scores of student’s writing test based on the suitable rubric. The result of students’ writing was correlated using Pearson Product Moment and calculation was run by SPSS 22 version. It was found that the result of the reliability of the writing test was 0.606. As the result, the test was considered medium or sufficient correlation since the reliability coefficient was between 0.40 – 0.70.
After assuring the validity and reliability, paired sample t-test and independent sample t-test were used for analyzing the data. Paired sample t-test was used to analyze the data obtained from pretest and posttest of the experimental group. Meanwhile, independent sample t-test was used to analyze the data obtained from the control group and experimental group.
After running the paired sample t-test and independent sample t-test analyses, the significance level (in the two-tailed test) was found.
Findings and Discussion
Score Distribution Based on Five Categories
26
Table 1: The Score Distribution of the Experimental Group
Score
Interval Category
Pretest Posttest
Frequency % Frequency %
80-100 Very good 0 0% 12 30%
70-79 Good 0 0% 17 42.5%
60-69 Enough 4 10% 8 20%
41-59 Low 18 45% 3 7.5%
0-40 Failed 18 45 % 0 0%
Total 40 100% 40 100%
As shown in Table 1, based on the result of pre-test most of the students were categorized in low and failed level. There were 18 students (45%) in low level and 18 students (45%) were in failed level. Meanwhile, the rest of the students were in the enough and no student was in good and very good level. After they got exposed to the treatment, 12 students (30%) were in the very good level, 17 students (42.5%) were in the good level, eight students (20%) were in enough level, three students (7.5%) were in low level and no student was in failed level. By comparing the mean scores of pre-test (44) and post-test (74), it can be said that there was a significant improvement in their descriptive writing achievement. The results of pre-test and post-test of control group can be seen in Table 2.
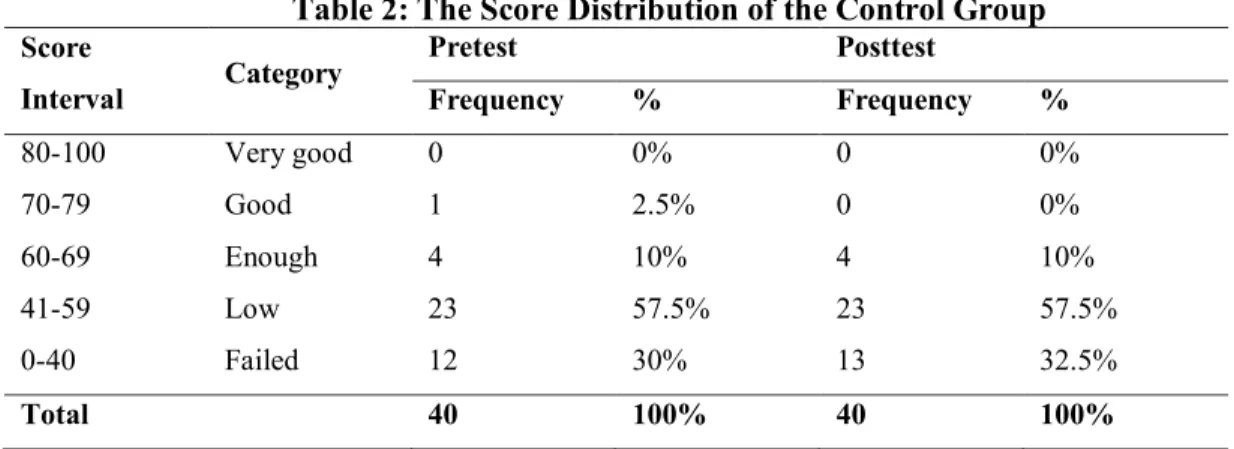
Table 2: The Score Distribution of the Control Group
Score
Interval Category
Pretest Posttest
Frequency % Frequency %
80-100 Very good 0 0% 0 0%
70-79 Good 1 2.5% 0 0%
60-69 Enough 4 10% 4 10%
41-59 Low 23 57.5% 23 57.5%
0-40 Failed 12 30% 13 32.5%
Total 40 100% 40 100%
27
23 students (57.5%) were in low category, four students (10%) were in enough category and no student (0%) was in the good and very good category.
Normality and Homogeneity of the Data
Before doing the t-test, the normality of the data was checked by using One-Sample Kolmogorov-Smirnov test. Based on the results, the significance (2-tailed) of pretest and posttest of the experimental group were 0.200 and 0.200, while the significance (2-tailed) of pretest and posttest of the control group were 0.190 and 0.200. Since all of the significance values were higher than 0.05, it can be concluded that the data were normally distributed. The normality of the data of experimental and control group can be seen in table 3.
Table 3: The Results of Normality Test
Group Pretest Posttest
Mean Std.
Dev.
Sig. Kolmogorov-Smirnov Z
Mean Std.
Dev.
Sig. Kolmogorov-Smirnov Z Exp.
Group 10.463 2.619 .200 0.093 18.063 2.501 .200 0.106
Control
Group 11.238 2.766 .190 0.116 11.163 2.542 .200 0.101
Homogeneity test was done in order to find out whether the sample groups from the population had the similar variance. The Levene's test was used to examine the homogeneity of the sample groups. The data are homogeneous if the significance value is higher than 0.05. The significance value of pretest and posttest in the experimental group was 0.459, it means the data in the experimental group was not homogenous, and the significance value of pretest and posttest in control group was 0.000 which is mean the data in control group was not homogenous. The significance value of posttest data in experimental and control group was 0.012, it means the data was not homogenous. Azwar (2010, p.4) describes, “The assumption of homogeneity of variance can be ignored without a large risk as long as we have the same number (N) in each sample.”The homogeneity of the data of experimental and control group can be seen in table 4.
Table 4: Homogeneity of the Data of Experimental and Control Group
Group Levene Statistic df1 df2 Sig
Pretest and posttest in exp. group 1.012 9 23 0.459
Pretest and posttest in con. group 5.469 13 23 0.000
28 The Result of Paired Sample T-test
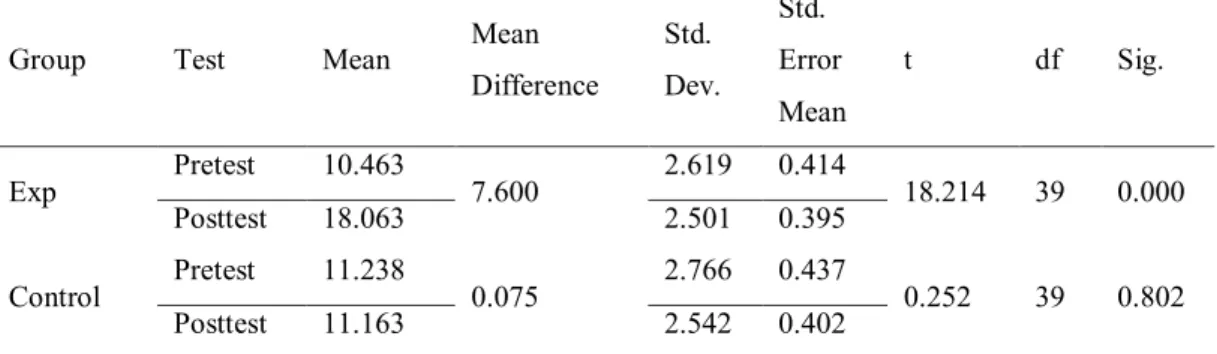
After checking the normality and homogeneity of the data, the t-test can be applied. In this study, the writer used paired sample t-test and independent sample t-test. The result of paired sample t-test can be seen in table 5.
Table 5: The Results of Paired Sample T-test of Experimental and Control Group
Group Test Mean Mean
Difference
Std. Dev.
Std. Error Mean
t df Sig.
Exp Pretest 10.463 7.600 2.619 0.414 18.214 39 0.000
Posttest 18.063 2.501 0.395
Control Pretest 11.238 0.075 2.766 0.437 0.252 39 0.802
Posttest 11.163 2.542 0.402
Based on the result of paired sample t-test (Table 5), the mean difference score of the experimental group was 7.600, while the control group was 0.075. Because the significant values for the experimental group (0.000) were lower than 0.005, it means that the mean difference was significant. However, the significant value for the control group (0.802) was higher than 0.05, the mean difference between pre-test and post-test of the control group was not significant.
The Result of Independent sample t-test
To see the difference between pre-test and post-test score of both experimental and control group, independent sample t-test was done. The result of independent sample t-test of post-test of both groups is presented in Table 6.
Table 6: The Result of Independent Sample T-test of Posttest of Experimental and Control Group
Group Mean Std. Dev.
Std. Error Mean
Sig.
(2-tailed) t df Mean Difference
Experimental 18.063 2.5018 0.3956 0.000 12.233 78 6.9000
Control 11.163 2.5429 0.4021
Based on the table above, the mean score of the posttest in the experimental group was higher than the mean score of the posttest in the control group (18.063 > 11.163). Since the -value (sig. (2-tailed)) was less than 0.05 (0.000 < 0.05), it can be concluded that there was a significant difference in the post-test between the experimental and control group.
29
treatment, and (2) there is a significant difference in descriptive writing achievement between the experimental group and the control group.
The first finding showed that the experimental group performance was better in posttest after they were treated by applying process approach through environmental observation for 18 times. It can be seen from the mean score of the posttest (18.063) was higher than the mean score of the pretest (10.463) with the mean difference of 7.600. Then, it was found that the t-obtained (18.214) was higher than t-table (2.021). In another word, there was an significant difference in descriptive writing achievement of the experimental group before and after they were taught by applying process approach through environmental observation.
According to the findings above, it could be assumed that the improvement was caused by the strategy applied. Process approach through environmental observation facilitates the students generating the ideas and focusing on language errors to improve their grammatical accuracy and writing fluency. It also helped the teacher to prevent the fraud that usually made by the students. For example, when the writer taught the students using environmental observation in pre-writing, the students keep in touch with the real object they should describe which helps them generating ideas how to describe it as real as they see. It is relevant to the statement of Harmenita and Tiarina (2013, p. 32) which describes that if students observe their environment, they will be more easily describing it because it is familiar from them. In composing phase of the process approach, the students had to describe the person, the place, and the thing they saw in front of their eyes, so they could not cheat by a look at the internet. It means this approach could help the teacher prevent the fraud because they focused on the students' writing process. Tribble (1996, p. 160) states that a process approach is an approach which focuses on the process, not only the product.
In revising phase of the process approach, the students were very passionate finding their pair error and discussing it together as discovered by Sun and Feng (2009: 155) that an optimal teaching effect was resulted by the teaching writing with the process approach.
This stage should be able to help them to improve their writing skill grammatically and well organized. As Zhou (2015, p. 90-91) states that in writing process students can freely discuss their writing with their peers or teacher and get feedback which focused on content, grammar, and organization from them so the students can learn how to write. Unfortunately, the students do not have a strong basis of grammar and punctuation. So, this aspect could not improve significantly.
For the control group, there was no significant difference in descriptive writing achievement. It can be seen from the mean score of the posttest (11.163) was lower than the mean score of the pretest (11.238) with the mean difference of 0.075 and t-obtained was lower than t-table (0.252 < 2.021). It happened because they did not learn about the descriptive test as intensive as the control group, and their willingness and vigor to study were less than experimental group.
30
students also learned about descriptive text. Mostly, the teacher gave them an explanation of the generic structure of the descriptive. They were barely exposed to create a text. Brannan (2009, p. 10) explains that writing is a creative process and intellectual exercise which produce a product such as a paragraph, essay, or story. And Hogue (2003, p. 255) also states that writing is composing, arranging, and polishing. It means when people learn about writing, they have to produce something. Because the students were only asked to answer questions related to the text and were insisted to know which was the identification and description, their writing achievement did not improve significantly.
From the explanation above, the experimental group performed better than a control group. It could be concluded that the students who received the treatment have significant improvement in descriptive writing achievement. Therefore, it can be stated that process approach through environmental observation was effective to increase descriptive writing achievement of the experimental group. Hence, using process approach through environmental observation is considered effective in teaching descriptive writing to the tenth graders of SMA Negeri 9 Palembang.
Conclusion
Based on the previous chapter, enhancing descriptive writing achievement by applying process approach through environmental observation was effective. The data showed that the score of the students in the experimental group was significantly improved after treatment. The statistical analysis of paired sample t-test showed that there was a significant difference in descriptive writing achievement before and after they were taught by using process approach through environmental observation. It was also proved by the independent sample t-test that there was a significant difference in mean score between students' pretest and posttest both in the experimental and control group. The mean score of posttest in the experimental group was higher than the mean score of posttest in control group. It means that process approach through environmental observation was effective to improve students' descriptive writing achievement. Unfortunately, process approach through environmental observation only helped the student in generating ideas and improving writing organization knowledge but it did not help the students in correcting grammar and punctuation errors. Therefore, to implement the approach, teachers have to more focus on the grammar and so do the punctuation.
References
Azwar, S. (2010). Asumsi-asumsi dalam inferensi statistika. Retrieved from
Gadjah Mada University website:
http://azwar.staff.ugm.ac.id/files/2010/04/Asumsi-asumsi-dalam-Inferensi-Statistika1.pdf/
31
Brannan, B. (2009). A writing workshop: Crafting paragraph, building essays (1st ed). New York: McGraw-Hill.
Creswell, J. W. (2012). Educational research: Planning, conducting, and evaluating quantitative and qualitative research (4th ed). Boston, MA: Pearson.
Depdiknas. (1989). Sistem pendidikan nasional. Jakarta: Depdiknas RI. Retrieved from http://www.dpr.go.id/
Hami, W. (2014). Improving students’ ability in writing descriptive text through wholesome scattering game. (Unpublished undergraduate thesis). Walisongo State Institute for Islamic Studies Semarang, Indonesia). Retrieved from http://library.walisongo.ac.id/
Hammound, Y. M. (2010). Creative writing. Riyadh: Zahrat Al-Sahra’a International School.
Harmenita, R. Y., & Tiarina, Y. (2013). Teaching writing a descriptive text by using environmental observation strategy. Journal of Language Teaching,
1(2), 31-37. Retrieved from http://www.ejournal.unp.ac.id/
Hogue, A. (2003). The essentials of English: A writer’s handbook. New York: Pearson Education ESL.
Hornby, A. S. (2010). Oxford advanced learner’s dictionary of current English
(8th ed). Oxford: Oxford University Press.
Lake, L. (2009). Observation. Retrieved from http://www.marketing.about.com/-od/marketingglossary/g/observationef.htm
Nurfarhati. (2015). Improving students’ writing in descriptive text by using quartet card: A classroom action research at class X.C students of SMAN 1 Kediri in academic year 2014/2015. (Unpublished undergraduate thesis). Mataram University, Indonesia. Retrieved from http://indojm.com
Onozawa, C. (2010). A study of the Process Writing Approach. (Unpublished undergraduate thesis). Kyoai Gakuen Univerisity, Japan. Retrieved from http://kyoai.ac.jp/
Oshima, A., & Hogue, A. (1999). Writing academic English (2nd ed). New York: Longman.
Prastihana, I. G. D. (2014). Improving descriptive paragraph writing through animation pictures of the eighth-grade students in SMP N 3 Amlapura in academic year 2013/2014. (Unpublished undergraduate thesis). Mahasaraswati Denpasar University, Indonesia. Retrieved from http://unmas-library.ac.id/
Purnomo, A. (2014). Improving descriptive writing skill through mind-mapping technique. (Unpublished undergraduate thesis). State Institute for Islamic Studies Salatiga, Indonesia. Retrieved from http://www.perpus.iainsalatiga.ac.id/
Richards, J. C., & Renandya, W. A. (2002). Methodology in language teaching: An anthology of current practice. New York: Cambridge University Press. Riyanti, Y. (2015). Improving students’ descriptive writing through role,
32
Sharples, M. (1999). How we write: Writing as creative design. London: Routledge.
Situmorang, H. D. (2015, November 6). Pentingnya kompetisi bahasa Inggris di era MEA. Retrieved from: http://www.berita-bersatu.com/
Sun, C. & Feng, G. (2009). Process approach to teaching writing applied in different teaching models. English Language Teaching, 2 (1), 150-155. Retrieved from https://files.eric.ed.gov/fulltext/EJ1082330.pdf
Supriadi, C. (2015, Maret 09). Jelang MEA, sektor pendidikan jadi prioritas. Marketing newsletter. Retrieved from http://www.marketing.co.id/
Tribble, C. (1996). Writing. Oxford: Oxford University Press.
Tuckman, B. W. (1978). Conducting educational research (2nd ed). San Diego: Harcourt Brace Jovanovich, Publishers.
Wardiman., & Artono. (2008). English in focus: For grade VII junior high school (SMP/MTs). Jakarta: Pusat Perbukuan DEPDIKNAS.
Webster, N. (1999). Webster’s new world dictionary. Columbus: A Division of Simon & Schuster, Inc.