R E S E A R C H A R T I C L E
Open Access
Pivoting of microtubules driven by
minus-end-directed motors leads to spindle
assembly
Lora Winters
1†, Ivana Ban
2†, Marcel Prelogovi
ć
2†, Iana Kalinina
1, Nenad Pavin
2*and Iva M. Toli
ć
1,3*Abstract
Background:At the beginning of mitosis, the cell forms a spindle made of microtubules and associated proteins to segregate chromosomes. An important part of spindle architecture is a set of antiparallel microtubule bundles connecting the spindle poles. A key question is how microtubules extending at arbitrary angles form an antiparallel interpolar bundle.
Results:Here, we show in fission yeast that microtubules meet at an oblique angle and subsequently rotate into antiparallel alignment. Our live-cell imaging approach provides a direct observation of interpolar bundle formation. By combining experiments with theory, we show that microtubules from each pole search for those from the opposite pole by performing random angular movement. Upon contact, two microtubules slide sideways along each other in a directed manner towards the antiparallel configuration. We introduce the contour length of microtubules as a measure of activity of motors that drive microtubule sliding, which we used together with observation of Cut7/kinesin-5 motors and our theory to reveal the minus-end-directed motility of this motor in vivo.
Conclusion:Random rotational motion helps microtubules from the opposite poles to find each other and subsequent accumulation of motors allows them to generate forces that drive interpolar bundle formation.
Keywords:Mitotic spindle, Mitosis, Spindle assembly, Antiparallel microtubule bundles, Overlap bundles, Microtubule rotation, Motor proteins, Kinesin-5, Forces, Fission yeast
Background
During cell division, the genetic material is divided into two equal parts by the mitotic spindle. This complex dynamic micro-machine is made of microtubules (MTs) emanating from the spindle poles, chromosomes, and a variety of
accessory proteins [1, 2]. Some MTs extending from the
spindle pole are bound to kinetochores on the chromo-some, whereas others are bound to MTs extending from the opposite pole, in an antiparallel configuration known as interpolar or overlap bundles [3–6]. These bundles interact laterally with kinetochore MTs and regulate the forces acting on chromosomes and spindle poles [7–12].
MTs within interpolar bundles are crosslinked by specific proteins, which can be divided into three classes: (i) motors that slide the MTs and thus the spindle poles apart by walking along the MTs away from the pole, i.e., towards the plus end of the MT, such as kinesin-5
mo-tors Cut7/Cin8/Eg5/KIF11 [13–15]; (ii) motors that pull
the poles together by walking along the MTs towards the pole, i.e., towards the minus end of the MT, such as
kinesin-14 motors Ncd/HSET/KifC1 [16, 17]; and (iii)
proteins that crosslink MTs without walking along the MTs, such as Ase1/PRC1 [18]. Remarkably, in vitro studies have shown that kinesin-5 motors can also move towards the minus end of the MTs, when walking on a single MT or in a non-crowded environment on
antipar-allel MTs [19–23]. Likewise, kinesin-14 motors can
reverse the direction of movement under a low external force [24]. Stability of antiparallel bundles for combina-tions of motors and crosslinkers has been explored theoretically [25,26].
© The Author(s). 2019Open AccessThis article is distributed under the terms of the Creative Commons Attribution 4.0 International License (http://creativecommons.org/licenses/by/4.0/), which permits unrestricted use, distribution, and reproduction in any medium, provided you give appropriate credit to the original author(s) and the source, provide a link to the Creative Commons license, and indicate if changes were made. The Creative Commons Public Domain Dedication waiver (http://creativecommons.org/publicdomain/zero/1.0/) applies to the data made available in this article, unless otherwise stated.
* Correspondence:[email protected];[email protected]
†Lora Winters, Ivana Ban and Marcel Prelogovićcontributed equally to this
work. 2
Department of Physics, Faculty of Science, University of Zagreb, Bijenička cesta 32, 10000 Zagreb, Croatia
1Max Planck Institute of Molecular Cell Biology and Genetics, Pfotenhauerstr.
108, 01307 Dresden, Germany
While the already formed antiparallel bundles in meta-phase have been to a large extent described, little is known about how these highly organized structures are formed during prometaphase. The reason is that this dynamic process is not accessible by current experimental techniques due to a high number of MTs extending from the spindle poles in prometaphase in higher eukaryotic cells [27], which may form antiparallel bundles. In yeast cells, which have a
small number of MTs and a rod-shaped spindle [4,6], the
study of the antiparallel bundle formation in living cells is challenging because the spindle poles are next to each other at the onset of prometaphase. Yet, the advantage of yeasts as experimental systems is that their spindles consist of only one antiparallel bundle. Electron tomography on early spin-dles in yeast showed MTs interacting at oblique angles [28], suggesting that such interactions may be an intermediate step during the formation of antiparallel bundles.
Alignment of MTs into an antiparallel configuration may be achieved by rotation of MTs that initially extend at an oblique angle. Indeed, live-cell imaging in fission yeast showed that MTs change their angle as they rotate (i.e., pivot) around the spindle pole [29]. Eventually, these MTs join the spindle, with help from Ase1 crosslinkers [30]. Ex-periments on budding yeast showed that cells lacking kinesin-14 motors have more MTs extending at an oblique angle with respect to the spindle and fewer antiparallel MTs than wild-type cells do [31]. Based on this finding, the authors hypothesized that minus-end-directed motors align the MTs, which was verified by computer simulations [31]. Spindle assembly starting from a monopole has been ex-plored by extensive computer simulations including motors of different directionalities and passive crosslinkers [32]. Ex-periments together with simulations showed that spindles can form even in the absence of motors, in which case MT
growth and Ase1 crosslinkers play an important role [33–
35]. Even though the formation of antiparallel bundles has been explored theoretically, a direct observation of interpo-lar bundle formation in vivo is missing.
Results
Assay for spindle reassembly in fission yeast
At the onset of mitosis in the fission yeast Schizosaccharo-myces pombe, the two spindle pole bodies (SPBs) are em-bedded in the nuclear envelope, which remains intact during mitosis [36]. The SPBs nucleate polar MTs with minus ends at the SPBs and the plus ends in the
nucleo-plasm [4,37]. MTs extending from the opposite SPBs
inter-act and form an antiparallel interpolar bundle and together with MTs that bind to kinetochores assemble the spindle. The interactions between antiparallel MTs occur when the SPBs are next to each other [38], making it difficult to study the dynamics of this process. To increase the dis-tance between the SPBs, we used a spindle reassembly assay, in which we disassembled the spindle by exposing
the cells in metaphase to cold temperature (1°C, Fig. 1a;
Additional file 1: Figure S1a), adapting the approach that
was previously used to study kinetochore capture [29,39].
SPBs were visualized by Sid4-GFP and MTs by
GFP-tubulin. When the temperature was increased to per-missive temperature (24 °C), the SPBs were more than 1μm apart in 61 ± 5% of cells (n= 84; results are mean ±
s.e.m. unless otherwise stated) (Additional file 1: Figure
S1b). Thus, this assay allowed us to investigate the process of antiparallel bundle formation, i.e., spindle reassembly.
a
b
c
d
e
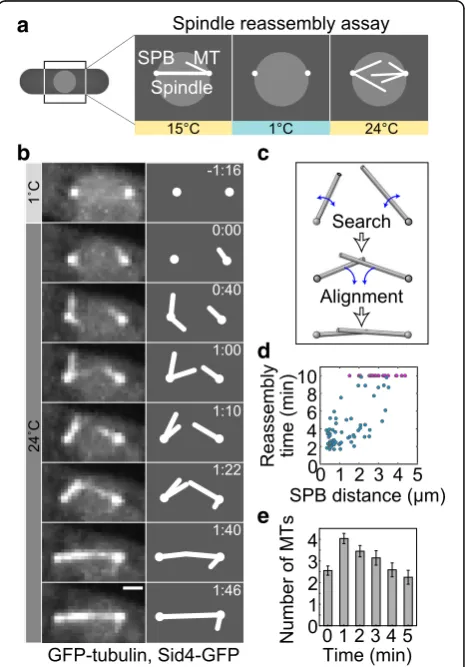
Fig. 1Spindles reassemble by rotational movements of MTs.aSpindle reassembly assay. Mitotic cells were cooled to 1 °C to depolymerize MTs (Methods). Once the temperature was increased to 24 °C, MTs grew from the SPBs and reassembled the spindle.bTime-lapse images of spindle reassembly in a wild-type cell expressing GFP-tubulin and Sid4-GFP (strain KI061). Images are maximum-intensity projections, time is given in min:s, scale bar, 1μm. Corresponding schemes are shown to the right.
Antiparallel microtubule bundles are formed in two steps After the cold treatment was ended and the cells returned to permissive temperature, 75 ± 5% (65 out of 87) spindles reassembled within 10 min, which is a typical duration of prophase and metaphase in unperturbed mitosis [40]. Shortly after the return to permissive temperature, MTs started growing from each of the two SPBs (defined as
time 0, Fig. 1b). The structure that appears as a MT is
likely a bundle of a few MTs, but because they move as a single object, we will refer to them simply as a MT. MTs did not extend in a defined direction, but instead pivoted
around the SPB (Fig. 1b, 0:00–1:22), in agreement with
our previous observations [29]. Eventually, a MT extend-ing from one SPB came into contact with a MT from the
other SPB (Fig. 1b, 1:22). At the time of initial contact,
MTs were typically not aligned in an antiparallel manner, but interacted at an oblique angle (Fig.1b, 1:22). In 21 out of 31 cells that reassembled their spindles and had the
SPBs separated by more than 1μm, MTs interacted at an
oblique angle, in 6 they met at the pole-pole axis and in 4 one MT grew directly to the opposite pole. Following the initial contact, MTs rotated into antiparallel alignment (Fig.1b, 1:22–1:46, Additional file 2: Movie S1; note that not every apparent contact leads to alignment). Thus, formation of an antiparallel bundle occurs in two steps: (i) MT growth and random rotation before their contact, which we refer to as search, and (ii) directed rotation of MTs towards an antiparallel configuration, which we term aligning (Fig.1c).
Quantification of spindle reassembly
To quantify the kinetics of spindle reassembly, we mea-sured the spindle reassembly time, defined as the time needed for the formation of an antiparallel MT bundle be-tween the SPBs, which includes both steps of this process.
The average reassembly time was 7.3 ± 0.9 min (n= 87
cells). The cells with a larger initial distance between the SPBs took a longer time to reassemble the spindle or did not reassemble the spindle within 10 min (Fig.1d).
To describe the first step of bundle formation, in which MT contact is established, we quantify polar MTs and their movement. During the process of spindle re-assembly, the average number of polar MTs per cell in-creased from 0 to 2.5 during the first minute and to 4 in the second minute (n= 28 cells, Fig.1e). Afterwards, the number of MTs decreased. MTs typically reached a length of 1.5μm and spent most of their lifetime at a
ra-ther constant length (Additional file 1: Figure S1c),
whereas their angular diffusion coefficient was 4.5°2/s
(Additional file 1: Figure S1d), in agreement with our
previous measurements [29]. Note that, because the structure that appears as a polar MT is likely a bundle of a few MTs, our measurements correspond to the bundle.
Microtubules slide sideways towards each other’s minus end during the process of alignment
In the second step of bundle formation, MTs rotate into antiparallel alignment by sliding sideways along each
other towards the SPB (Fig. 2a). To quantify the
geom-etry of this system over time, we first measured the
angle between the MTs, α(Fig. 2b), starting 10 s before
the antiparallel bundle was formed. We found that the
a
b
c
d
e
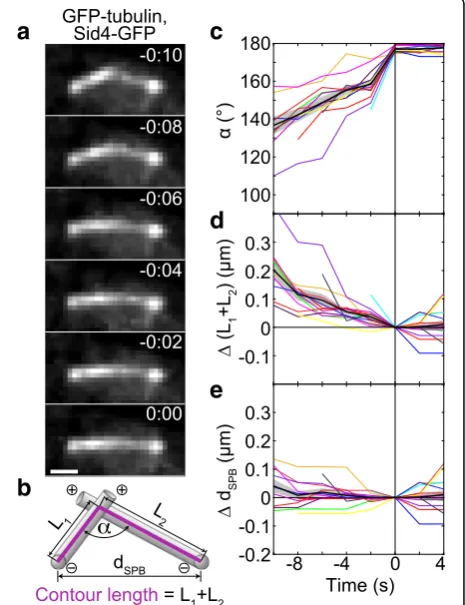
Fig. 2MTs slide sideways towards each other’s minus end during alignment.aTime-lapse images of a wild-type cell expressing GFP-tubulin and Sid4-GFP (strain KI061) during the formation of an antiparallel bundle. Images are maximum-intensity projections, time is given in min:s, scale bar, 1μm.bMeasurement of the angle between the MTs,α, the contour length of MTs,L1+L2, and the
distance between the SPBs,dSPB. The contour length of the MTs is
defined as a segmented line (magenta) starting at one SPB, passing through the contact point between the MTs, and ending at the other SPB. SPBs are represented as spheres and MTs as rods; plus and minus signs designate the respective ends of MTs.cAngle between MTs,α, as a function of time.dContour length difference as a function of time. The contour length difference is defined as the difference between the contour length,L1+L2, at a given time
and the contour length att= 0,Δ(L1+L2) =L1+L2−(L1+L2)|t= 0. eThe difference of distances between the SPBs as a function of time, defined as the difference between the SPB distance,dSPB, at a
given time and the distance att= 0,ΔdSPB=dSPB−dSPB|t= 0. In
angle increased towards 180°, which represents the
bundled configuration (Fig. 2c). During the subsequent
4 s, the angle remained constant (Fig.2c).
Sideways sliding of MTs towards antiparallel alignment may be driven by motors at the MT contact point. To as-sess the direction and velocity of the movement of these motors, we introduce a measure termed the contour length of the MTs. We define the contour length of the MTs as a segmented line starting at one SPB, passing through the contact point between the MTs, and ending
at the other SPB (Fig. 2b; Additional file 1: Figure S1e;
Methods). Note that, due to limitations in spatial reso-lution, we cannot determine whether this contact point is at the MT end or at the side of the MT. Thus, we use sideways sliding as a more general interpretation of the observed movement. We found that the contour length of the MTs decreased during the rotation of the MTs into antiparallel alignment and remained constant afterwards (Fig.2d). The contour length decreased in a roughly linear manner, which allowed us to introduce the measure termed contour velocity, defined as the velocity at which the contour length changes. We measured a contour vel-ocity of−18 ± 2 nm/s (n= 14 cells). Contrary to the con-tour length, the distance between the SPBs was constant
both during the alignment and afterwards (Fig.2e). Given
that MTs do not undergo poleward flux in fission yeast [41], our results reveal that during the alignment the con-tact point between the MTs moves in a directed manner towards the minus end of each MT, which is at the SPB. Thus, the alignment may be driven by minus-end-directed motors. The velocity at which the motors slide the MTs with respect to each other equals the contour velocity. If these motors are dimeric and walk along one MT, while their tail is attached to the other MT, their velocity is roughly 20 nm/s. On the other hand, if the motors are tetrameric and walk along both MTs simultaneously, their velocity along each MT is roughly 10 nm/s.
Cut 7 (kinesin-5) is important for spindle reassembly We explored the role of candidate motor proteins and a non-motor MT crosslinker in spindle reassembly. First, we focused on Cut7, a kinesin-5 family member, because it is essential for spindle formation and localizes to the
spindle midzone and poles [13,42]. Moreover, Cut7 can
move towards the minus end of the microtubule in vitro [20], suggesting that it can drive MT alignment. On the other hand, spindles are able to assemble without any of
the other eight kinesins in S. pombe [43–48], dynein
[49], and the non-motor crosslinker Ase1/PRC1 [50,51].
We used a temperature-sensitive cut7.24ts mutant in
our spindle reassembly assay and set the final
temperature to 37 °C to abrogate Cut7 activity. Similar temperatures do not disrupt spindle assembly and com-pletion of mitosis in wild-type cells [40]. We estimate
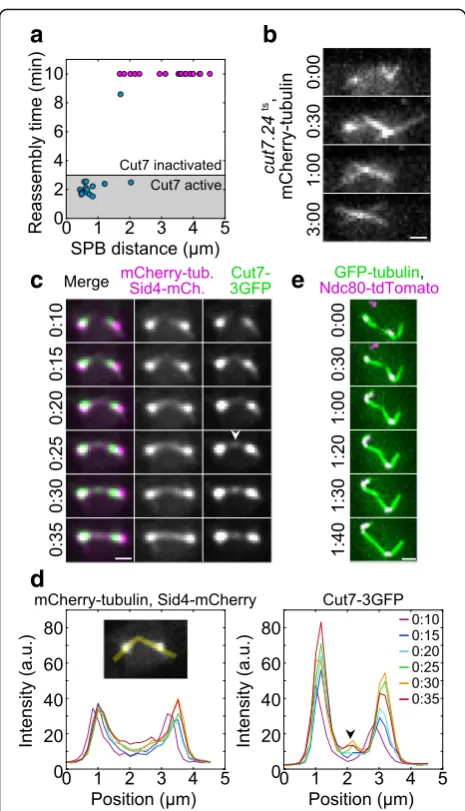
that Cut7 was inactivated within 3 min, given that it took about a minute to raise the temperature from 1 °C to 37 °C and the mutation response time was estimated to be 2 min [48]. We found that only 5 ± 5% (1 out of 19) spin-dles incut7.24tscells reassembled at times longer than 3
min (Fig.3a). In the remaining cells, the MTs extending
from the two SPBs did not form an antiparallel bundle, often crossing each other in an X-shaped conformation
(Fig. 3b; Additional file 3: Movie S2). The fraction of
reassembled spindles was smaller than the fraction of reassembled spindles in wild type at times longer than 3 min (63 ± 6%, or 38 out of 60, calculated from data in Fig.1d). To exclude the possibility that this difference is due to different distances between the SPBs, we took into account only the cells in which this distance was in
the range 1–5μm and found that 14 ± 8% (3 out of 21)
spindles in thecut7.24tsmutant reassembled, whereas in
wild type this fraction was 58 ± 7% (31 out of 53).
Additional comparisons are shown in Additional file 1:
Figure S1 f. We conclude that Cut7 is important for the formation of an antiparallel bundle in the spindle re-assembly assay.
We also applied the spindle reassembly assay to the mutants lacking the proteins that have been shown to regulate spindle length in metaphase: kinesin-8 motor
protein Klp5 [52,53], kinesin-14 motors Pkl1 and Klp2
[43, 44], and the crosslinker Ase1 [50, 51]. We found that spindles were able to reassemble in the absence of
these proteins (Additional file 1: Figure S1 g, S1 h). In
all the studied mutants, the reassembly time increased with an increase in the distance between the SPBs,
similarly to wild type, except in the klp5Δ mutant in
which a similar correlation was not evident, possibly
due to longer distances between the SPBs
(Additional file1: Figure S1i).
To comparecut7.24tscells with the other mutants and
wild type, we analyzed only the cells that reassembled spindles at times longer than 3 min or did not reassem-ble. Whereas in wild type and all the mutants except
cut7.24ts more than 50% of the spindles reassembled, in
cut7.24ts, this fraction was only 5% (Additional file 1: Figure S1j). Taken together, our experiments on a set of mutants suggest that Cut7 has a function in the trans-formation of oblique MT contacts into antiparallel bun-dles to reassemble the spindle.
Cut7 is found at the contact site between microtubules during microtubule rotation into antiparallel alignment To explore the localization of Cut7 and thus the poten-tial sites where it may exert forces that align the MTs from the opposite SPBs into antiparallel configuration, we used cells expressing Cut7-3GFP as well as
mCherry-tubulin and Sid4-mCherry in our assay (Fig.3c;
S3). During cold treatment, Cut7-3GFP showed a diffuse signal in the nucleus (Additional file 4: Movie S3). When the temperature was increased and MTs started to nu-cleate from the SPBs, Cut7 appeared close to the SPBs (n= 50 out of 50 cells; Fig.3c, 0:10). We first analyzed the cells in which the SPBs were separated by more than
1μm after the cold treatment (n= 19 out of 50 cells).
We found that MTs pivoted around the SPBs and
even-tually formed a bundle connecting the SPBs (n= 15 out
of 19 cells; Fig.3c, 0:10–0:35), in agreement with our
re-sults shown in Fig. 1b. Interestingly, when MTs
extend-ing from the two SPBs established contact, Cut7 was
found at the contact site (n= 8 out of 8 cells in which
the initial MT contact was clearly visible; Fig.3c, 0:25; in the remaining 7 cells, the initial MT contact site was un-clear). Intensity profiles of the Cut7-3GFP signal along the contour length of MTs show that Cut7 appeared at the contact point and was present at this point during
the process of MT alignment (Fig.3d, 0:25–0:35). When
the angle between the MTs changed from an oblique to the straight angle, Cut7 distribution changed from a spot to a broader distribution along the spindle, resulting in
several Cut7 streaks along the spindle (n= 14 out of 15
cells; Additional file 4: Movie S3). Similar examples are
shown in Additional file1: Figure S2a and S2b.
In the cells in which the SPBs were separated by less than 1μm after the cold treatment (n= 31 out of 50 cells), Cut7 was found at the SPBs upon temperature increase (n = 31 out of 31 cells). The spindles reassembled (n= 30 out of 31 cells), but it was not possible to observe the ini-tial contact between the MTs extending from the opposite SPBs and the distribution of Cut7 at that time due to the
short distance between the SPBs (Additional file1: Figure
S2c). Note that the kinetics of spindle reassembly in the
cells expressing Cut7-3GFP (Additional file1: Figure S2d)
was similar to that in wild-type cells shown in Fig.1d, sug-gesting that labeling of Cut7 did not perturb this process.
Based on our experiments in which Cut7 and MTs were visualized, we conclude that Cut7 near the SPBs cannot contribute to the alignment of MTs extending from the opposite SPBs and interacting at an oblique angle, because all MTs extend from the same SPB in that region. We speculate that Cut7 found at the site of MT interaction may exert forces that align the MTs into antiparallel configuration.
Finally, kinetochores may have a role in MT alignment, because interactions between kinetochores and microtu-bules are important for spindle structure [54]. To inves-tigate this possibility, we followed the kinetochores during spindle reassembly and found that MT alignment occurs without kinetochores being present close to the
MT contact point (Fig. 3e; Additional file 1: Figure S2e
and S2f ). We also found that spindle reassembly time was similar in cells that have a free kinetochore in the
a
b
c
d
e
Fig. 3Cut7-GFP is found at the initial contact points of MTs.aReassembly time as a function of the distance between the SPBs for cut7.24tscells (strain CF.391) at non-permissive temperature (37 °C),n= 34 cells. Pink data points denote cells in which the spindle was not reassembled within 10 min.b
nucleoplasm and in those in which all the kinetochores
were at the SPBs (12 ± 3 min,n= 19, and 11 ± 3 min,n=
24, respectively; here we used cells withdSPB> 1.5μm to
compare cells with similar dSPB in both groups, see
Additional file1: Figure S2f ). These results suggest that kinetochores do not significantly influence the formation of antiparallel MT bundles.
Theoretical model
To explore how the MTs, which extend in arbitrary di-rections, become aligned into an antiparallel bundle con-necting the spindle poles, we introduce a simple physical
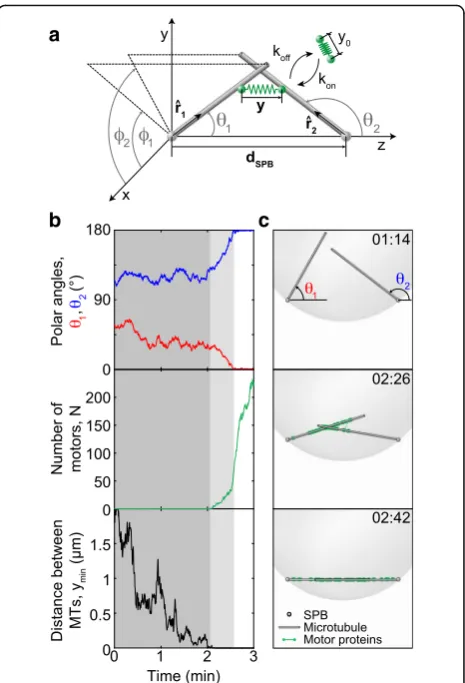
model (Fig. 4a and Methods). The central idea of our
theoretical approach is that MTs perform rotational movement around the spindle pole, allowing them to explore the space as they search for the MTs extending from the opposite pole and to establish a configuration required for spindle assembly. In our model, two types of forces drive the rotational movement of MTs: forces generated by motor proteins and thermal forces. The forces generated by motors appear when MTs get into close proximity allowing the motors to attach in this region and thus crosslink the MTs. In our model, motors attach simultaneously with both ends to two MTs
extending from the opposite spindle poles (Fig. 4a). A
motor is described as an elastic spring, whose two ends can move along two MTs. The motors move towards the MT minus end, which is at the spindle pole, generating a directed force on the MTs that rotates them towards the pole-pole axis. A motor is considered as a force gen-erator, whose velocity decreases under load. In contrast to motor-generated forces, thermal forces are random and always present irrespective of the distance between the MTs. To keep the model simple, we consider straight MTs of a constant length extending from each spindle pole. MTs are pinned at one end at the nuclear envelope of a spherical shape. We use this model to calculate the dynamics of antiparallel bundle formation.
We solved the model numerically to obtain the time course for MT orientations and the number of attached motors. MT orientations are parametrized by angular
coordinates, the polar and the azimuthal angle (Fig. 4a).
For parameters given in Table 1 and discussed in the
Methods section, solutions of the model show that MTs
initially preform random angular movement (Fig. 4b,
top). This movement of MTs is predominantly driven by thermal forces, as there are no motors attached to them
(Fig. 4b, middle) because the MTs are not yet in contact
(Fig. 4b, bottom). Our calculations show that this
ran-dom movement ends when the MTs come close enough
to each other so that motors can attach (Fig. 4b,
bot-tom). Subsequently, polar angles change in a directed manner towards the antiparallel configuration (light gray
region in Fig. 4b, top). This directed movement is the
a
b c
Fig. 4Theoretical model and solutions for MT dynamics.aScheme of the model. Each MT (gray rod) is freely joint to its respective SPB (gray sphere). Orientations of two MTs are represented with unit vectors^r1 and^r2respectively, while the SPBs are at fixed points separated by the distancedSPB. Motor proteins (green springs with rest lengthy0) can
attach to and detach from MTs with rateskonandkoff, respectively, and
when attached, their elongation isy. In the Cartesian coordinates, the SPBs are at points (0, 0, 0) and (0, 0,dSPB). The MT orientations are
described by the polar anglesθ1andθ2and by the azimuthal angles φ1andφ2for the first and the second MT, respectively.bA sample
path representing a bundling event. Top, polar angles denoted with a blue and a red line for the first and second MT, respectively. In the antiparallel configuration,θ1= 0°,θ2= 180° (seeafor parametrization).
Middle, number of attached motors. Bottom, distance between the two closest points on the MTs. Shaded regions: the search (dark gray) and the aligning phase (light gray); white region represents the bundled state. Simulation is performed with parameter values R1,2= 1.5μm,dSPB= 2 μm,nMT= 2, and other values from
result of the accumulation of motors that generate forces
(Fig. 4b, middle). The movement stops when the polar
angles approach 0° and 180° for the first and the second
MT, respectively (Fig. 4b, top), thereby forming a stable
antiparallel bundle. This directed movement of MTs and the accompanying accumulation of motors correspond to the experimental observations that characterize the
alignment step (Figs. 2and 3). In the model, the motors
accumulate most rapidly after the MTs have become
aligned (white region in Fig. 4b, middle), which is not
observed in experiments (Fig.3c, d). This difference may
be due to a larger MT overlap and a larger pool of mo-tors in the model compared to experiments. The entire time course of the MTs and the behavior of motors
cal-culated from the model and corresponding to Fig. 4b is
illustrated in Additional file 5: Movie S4, and the still frames from the animation representing the search,
aligning and bundled state are shown in Fig. 4c, top,
middle, and bottom, respectively.
The model predicts that bundle formation is faster for small distances between the SPBs, large MT number, and fast MT diffusion
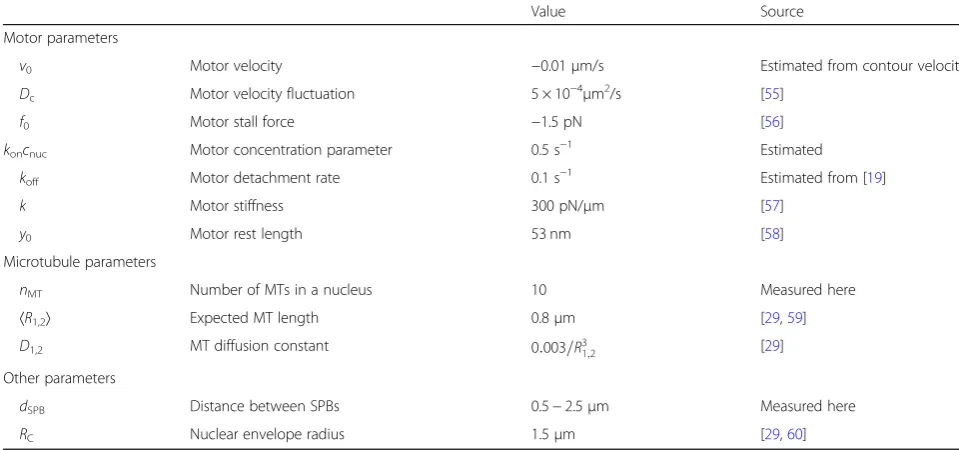
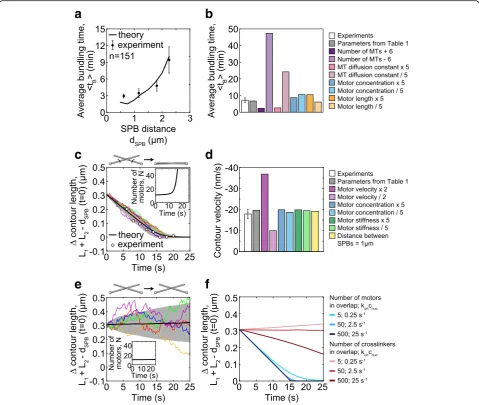
To provide a quantitative measure that can be compared with experiments, we calculate the average bundling time, defined as the time required for MTs to form an antiparal-lel bundle, which takes into account both steps in bundle formation, i.e., search and alignment (Methods). We found that the average bundling time is roughly 1–10 min for pa-rameters in Table1and random initial conditions (Fig.5a). The average bundling time increases as the SPB distance
increases (Fig. 5a). To compare these results with
experiments, we calculated the average spindle reassembly time for different distances between the SPBs in wild-type cells and found that our model reproduces the experimen-tal measurements (Fig.5a). There is a discrepancy at small SPB distances, possibly due to the smaller MT numbers at
the onset of MT growth (Fig.1e), which is the time window
relevant for reassembly in this case. We conclude that the agreement between the model and experiments supports the hypotheses used to build our model.
We further explored the predictions of the model by varying the parameters of the model and calculating the
resulting average bundling time (Fig.5b). We found that
an increase in MT number by a factor of 1.6 accelerates bundle formation by a factor of 3, whereas a decrease in MT number slows down this process. Similarly, MT dif-fusion affects bundle formation, though to a smaller
extent (Fig.5b). On the other hand, the concentration of
motors and their rest length have a minor contribution
even when changed by a factor of 5 (Fig. 5b). The
con-centration of motors is not a critical parameter within the tested range, as long as a few motors can bind to the MT contact point, which are sufficient to drive the formation of an antiparallel bundle. Thus, bundling time depends mainly on MT number and diffusion.
Minus-end-directed motors align the MTs into an antiparallel bundle at a constant velocity
In our experiments, we found that the contour length of MTs decreased during their rotation into antiparallel alignment. To help us interpret these results, we used the model to explore the change in MT contour length. Here we start our calculations from the configuration in Table 1Parameters used in the model
Value Source
Motor parameters
v0 Motor velocity −0.01μm/s Estimated from contour velocity
Dc Motor velocity fluctuation 5 × 10⁻⁴μm2/s [55]
f0 Motor stall force −1.5 pN [56]
koncnuc Motor concentration parameter 0.5 s−1 Estimated
koff Motor detachment rate 0.1 s−1 Estimated from [19]
k Motor stiffness 300 pN/μm [57]
y0 Motor rest length 53 nm [58]
Microtubule parameters
nMT Number of MTs in a nucleus 10 Measured here
〈R1,2〉 Expected MT length 0.8μm [29,59]
D1,2 MT diffusion constant 0:003=R31;2 [29]
Other parameters
dSPB Distance between SPBs 0.5−2.5μm Measured here
RC Nuclear envelope radius 1.5μm [29,60]
which the MTs are in contact (Fig.5c is for a symmetric and Additional file1: Figure S3a for an asymmetric initial configuration). We find that the contour length difference decreases towards zero and remains constant afterwards (Fig.5c). This process is driven by motors, which initially accumulate slowly, whereas the accumulation accelerates
when the MTs approach the aligned configuration (Fig.5c,
inset). The contour length decreases linearly at a velocity close to 2v0, twofold the velocity of motors along each MT.
The value of the parameterv0was chosen to reproduce the
experimentally measured contour velocity (Table 1 and
Methods). To explore the predictions of the model, we var-ied the parameters and found that the contour velocity is
proportional to the motor velocity, whereas the
a
b
c
d
e
f
Fig. 5Bundling time and contour length.aAverage bundling times in theory (black line) and experiments (circles with error bars) measured as spindle reassembly time fordSPB< 2.5μm (n= 109, strain KI061;n= 42, strain LW042). The average bundling time,〈tB〉=ttot/nB, wherettotis the
total time the MTs were observed or simulated andnBis the number of bundling events in that time.bAverage bundling times in experiments,
for 1.5μm <dSPB< 2.5μm (white bar, data froma), and in theory for varied parameters (colored bars,dSPB= 2μm).cContour length difference,
calculated asL1+L2−dSPB, (main graph) and the number of motors (inset) as a function of time. In the simulations, MTs start from a symmetric
configuration andα= 120°,ymin= 0μm (seeMethods). Average value (black line), standard deviation (shaded area), 5 sample paths for simulations
(colored lines) fordSPB= 2μm,R1,2= 2μm, andnMT= 2. Mean experimental values (white dots) from Fig.2d (from cells where the motors were not
tagged in order to avoid potential effects of tagging on motor velocity), with times shifted by 16 s.dContour velocity in experiments (white bar; data from Fig.2d) and in theory for varied parameters (colored bars);R1,2= 2μm,dSPB= 2μm, except for the last barR1,2= 1μm,dSPB= 1μm.eContour
length difference (main graph) and the number of passive crosslinkers (inset) as a function of time, with same color code as inc. Parameters for passive crosslinkers: diffusion constantDc= 0.05μm2/s [61], and the rest lengthy0= 40 nm [62].fAverage contour length difference from theory for
concentration of motors, their stiffness, and the SPB dis-tance have a minor contribution within the tested range (Fig.5d; Additional file1: Figure S3b; other parameters are investigated in Additional file1: Figure S3c). Note that our model does not include crowding of motors and the ac-companying changes of motor directionality [20].
Interestingly, the prediction that the contour velocity does not depend on the SPB distance implies that this vel-ocity is robust to changes in the geometry of the system. To test this prediction, we divided the cells into two groups, those with the SPB distance smaller or larger than
1.85μm. Indeed, we found that the contour velocity was
not different between these groups (−18 ± 5 nm/s and−
24 ± 6 nm/s for the cells with SPB distance of 1.69 ± 0.03μm and 2.3 ± 0.2μm, respectively;n= 14;p= 0.5 from a t-test for velocities). Taken together, our results suggest that the minus-end-directed motors align the MTs into an antiparallel bundle and allow us to identify their velocity.
Our model together with experiments shows that the search times are several-fold longer than the duration of MT aligning. Thus, the average bundling time, which in-cludes both search and aligning, describes predominantly the time scale of the search process, which is on the order of minutes. The change of contour length captures only the time scale of the aligning step, which is on the order of sec-onds. Our model, which is based on the known properties of MTs and motors, explains the process of antiparallel bundle formation covering different time scales.
An alternative scenario is that motor activity is not re-quired for antiparallel bundle formation, but passive
cross-linkers may drive this process [34, 35]. In order to
investigate this possibility, we use our model to describe the interactions between MTs mediated by passive crosslinkers (Methodsand Fig.5e). In contrast to the case with motors, we find that with passive crosslinkers, the contour length is almost constant over time and MT alignment does not occur on relevant time scales (Fig.5e), even though
cross-linkers remain attached to the MTs (inset in Fig.5e). The
experimentally observed alignment is not reproduced even for a two orders of magnitude higher concentration of crosslinkers, whereas the alignment driven by motors is in agreement with experiments irrespective of motor
concen-tration (Fig. 5f). Yet, passive crosslinkers can drive MT
alignment on a relevant time scale if the distance between the SPBs is small and the number of crosslinkers is high (Additional file1: Figure S3d). Thus, the model with passive crosslinkers instead of motors cannot reproduce MT align-ment observed in our experialign-ments.
Discussion
Microtubule pivoting around the spindle pole facilitates their encounter
Our results based on live-cell imaging provide a direct ob-servation of interpolar bundle formation in vivo, which is a
missing piece of information critical for the understanding of spindle assembly. By using a spindle reassembly assay, we found that the formation of an antiparallel bundle oc-curs in two steps, search and aligning (Fig.1c). During the search step, MTs extending from the opposite SPBs rotate around the SPB, which helps the MTs to find each other. MT rotation during the search step is passive angular diffu-sion, which is thermally driven and does not require ATP [29]. Previous computer simulations of spindle assembly in fission yeast indicate that a decreased MT rotation results in fewer MTs in the bundle connecting the two SPBs and shorter spindles [32]. Thus, previous work and our model together with experiments show that rotation of MTs is required for the process in which they search for each other to form an antiparallel bundle.
MT rotation has been observed before in fission yeast during mitosis and meiosis [29,59], in budding yeast [63], and inDrosophilaS2 cells [64]. In general, pivoting helps the MTs as they search for targets such as kinetochores [29,59,65], cortical anchors in vivo [63] and in vitro [66],
or other MTs [30, 64]. This motion allows MTs to swipe
through space, which increases the explored volume and makes the search process more efficient [2,67].
Dynamics of the microtubule contour length reveals that minus-end-directed motors align the microtubules into antiparallel bundles
emanating from one SPB by kinesin-5 motors clustered at the opposite SPB, which subsequently induce antipar-allel sliding of the MTs [68]. In higher eukaryotic cells, the majority of interpolar bundles form when the cen-trosomes are apart [69], which is similar to our reassem-bly assay and thus our results on search and alignment are likely relevant for these systems.
During MT alignment, MTs slide sideways along each other like a skater on a handrail. We introduce the contour length of MTs as a measure of activity of motors that drive MT sliding. This measure provides information about motor directionality and velocity. Thus, the approach developed in this work may be used to study the activity of any motor of interest or their combinations in a mitotic context that has not been studied so far.
Our finding that the contour length of MTs decreases during their rotation, together with our theory, implies that the motors accumulated at the contact site walk to-wards the minus ends. Our measurement that the con-tour length decreases at a velocity of roughly 20 nm/s indicates that the motors walk at this velocity. This rea-soning holds for fission yeast spindles where poleward flux is absent [41]. In the case of a tetrameric motor, the motor walks along each MT at a half of that velocity.
The velocity measured here is similar to the velocity of
the minus-end-directed motility of kinesin-5 and
kinesin-14 motors, but smaller than dynein velocity, in yeasts. In gliding assays in vitro, the kinesin-5 Cut7 from fission yeast moves at a velocity of 30 nm/s [23], and Cin8
from budding yeast at 30–50 nm/s [19]. The kinesin-14
Pkl1 from fission yeast moves at a velocity of 33 nm/s in a gliding assay [70], while the truncated Kar3 from budding yeast moves at 20 nm/s in a gliding assay [71] and the full-length Kar3-Cik1 at 45 nm/s in a stepping assay [31]. Finally, cortically anchored dynein in fission yeast moves the nucleus at a velocity of 100 nm/s [72], and single dyneins move at 140 nm/s along the MT [73], whereas full-length purified budding yeast dynein glides MTs in vitro at 90 nm/s [74].
Molecular players involved in resolving oblique microtubule contacts
We propose that Cut7, a kinesin-5 family member, plays a role in MT rotation into antiparallel alignment, based on the literature and our experiments on candidate motor proteins and a non-motor crosslinker. Previous works have shown that Cut7 is essential for spindle formation [13], un-like the other 8 kinesins ofS. pombe [43–48], dynein [49]
and the non-motor crosslinker Ase1/PRC1 [50, 51]. The
key role of Cut7 in spindle formation was revealed by in-activation of Cut7 in temperature-sensitive mutants, which resulted in cells with monopolar spindles [13]. Similarly, Cut7 inactivation during metaphase leads to spindle col-lapse into an aster pattern [48]. Electron micrographs of
monopolar spindles produced by Cut7 inactivation showed that MTs extending from the two SPBs are roughly parallel, suggesting that Cut7 is required for MT interdigitation [75]. Our experiments showing accumulation of Cut7 at the site of initial MT contact, together with low efficiency of spindle reassembly in a temperature-sensitive cut7.24ts
mutant, are consistent with a role of Cut7 in the formation of antiparallel MT bundles starting from oblique MT inter-actions. Importantly, our data provide experimental evi-dence for minus-end-directed motility of Cut7 in vivo and the biological role of this directionality. It would be inter-esting to apply the spindle reassembly assay tocut7double mutants, to cells with targetedcut7mutations, and to those expressing Cut7 forms of different directionalities, in order to explore the role of specific interactions and potential additional mechanisms.
Other motors, such as the minus-end-directed kinesin-14
motors Pkl1 and Klp2 [43,44] and dynein [49] might
con-tribute to MT rotation into antiparallel alignment. Yet, we found that spindles were able to reassemble in cells lacking Pkl1 or Klp2, which is consistent with previous observa-tions that spindles can reassemble in cells lacking Pkl1, Klp2 or dynein after MT depolymerization in kinetochore capture assays [39, 76]. Additionally, cells lacking any of these three motors or even all three of them are able to
form spindles under normal conditions [44, 49]. Thus,
Pkl1, Klp2 and dynein are not crucial for the resolution of oblique MT contacts during spindle assembly.
Finally, it is possible that MT rotation into antiparallel alignment occurs without motor activity. Our theoretical results show that MT alignment can be driven by passive crosslinkers for small distances between the spindle
poles, in agreement with previous works [33–35].
How-ever, for spindle pole distances relevant for our experi-ments, our theory together with our measurements of contour length suggests that the action of minus-end-di-rected motors is required for MT alignment. Our experiments on Cut7 together with the previously observed minus-end-directed motility of Cut7 [23] sug-gest a role of Cut7 in this process.
Change in the direction of forces after microtubule alignment
minus-end-directed motors. These forces may be generated by plus-end-directed motors such as kinesin-6/Klp9 [48], or by pushing forces generated by the interaction of
grow-ing MT plus ends with the opposite SPB [33,34].
More-over, the motors that align the MTs into the antiparallel bundle may change their direction of motion after the bun-dle is formed. Crowding on the MT has been suggested to convert the Cut7 motor from minus-end-directed to plus-end-directed stepping [20]. Similarly, single Cin8 mo-tors from budding yeast were shown to move towards the minus end on individual MTs, but they switch to plus-end-directed motility when working in a group of
mo-tors on antiparallel MTs [19,21]. Exciting new
experimen-tal and theoretical investigations await in this field to reveal how the regulation of motor protein activity and MT dy-namics govern spindle formation and function.
Methods
Strains and sample preparation
The strains (Additional file 1: Table S1) were obtained
by crossing, followed by random spore analysis [77]. The cells were grown on Yeast Extract with supplements (YES) medium agar plates at 25 °C [77]. A loopfull of cells was further cultured in liquid YES medium in a shaking incubator (ISF-1-W, Kuehner Shaker, Birsfelden,
Switzerland) at 25 °C for 2–3 h. For the strains CF.391,
I1_2_10, KI013, and LW042, 3 mM hydroxyurea (Sig-ma-Aldrich) was added to liquid YES medium in order to obtain lengthy cells with normal MT dynamics [78, 79] and with lengthy spindles, the cells were kept for
11–14 h in the shaking incubator at 25 °C, and
subse-quently the liquid culture was diluted with liquid YES medium at a ratio 1:3. The wall of a 35 mm (No1.5) cul-ture dish (MatTek Corporation, Ashland, MA, USA) was cut to 2 mm height. The original coverslip was re-moved from the dish bottom and the remaining dish was soaked in 70% ethanol overnight. Cover slips (Corn-ing 22 mm × 22 mm, Sigma-Aldrich) were washed in 2-propanol and attached to the pre-washed culture dish with transparent nail polish. The dish was coated with lectin (L2380, Sigma-Aldrich, St Louis, MO, USA) 30
min prior to usage. 200μl of liquid culture was placed
on the pretreated culture dish for 25 min for
sedimenta-tion. The cells were washed 3 times with 200μl of YES
medium. The dish was closed with a cover slip (Corning, Inc.) to prevent the sample from drying out.
Microtubule depolymerization by cold shock
To quickly depolymerize metaphase spindles, a thermo-electric device based on a Peltier element was designed and tested with an independent type K thermocouple (Omega Engineering, Deckenpfronn, Germany) and a Fluke 50 Serie II Thermometer (Fluke Corporation, Ev-erett, WA, USA). Prepared samples were loaded onto
the microscopy stand and a pre-cooled thermoregulation at 15 °C, to slow down mitosis and thus facilitate our search for a field of view with a high number of cells in
metaphase (Additional file 1: Figure S1a). Following
image acquisition, the temperature was set to 0 °C. Once set to 0 °C, the temperature dropped to 1 °C within 60 s inside the sample and was maintained typically for 15 min. To ensure a constant temperature, the objective was lowered to at least 2 cm away from the sample dish. Subsequently, the objective was returned to the initial position, the same field of view was placed into focus, and image acquisition was initiated. Within 20 s of ac-quisition, the temperature was set to 24 °C. The temperature inside the sample reached this value within 30 s. Because of the change in temperature, the sample was manually refocused during the acquisition. Once the temperature in the sample was stabilized at 24 °C, the
focus remained constant. In experiments with cut7.24ts
cells, the final temperature was set to 37 °C instead of 24 °C to inactivate Cut7. Live-cell imaging was per-formed for 10 min.
Time-lapse live cell imaging
Charge Coupled Device (EMCCD, Andor Technology plc., Belfast, UK), cooled to−80 °C, electron multiplication gain 300. The resulting xy-pixel size in the images was 168 nm. The system was controlled by Andor iQ software version 2.9 (Andor Technology plc., Belfast, UK). For short-term acquisitions (10–20 s), sequential time-lapse z-stacks (2-s time interval between each image pair) of 13 optical
sections with 0.5-μm z-spacing was performed using a
DualView image-splitter (Optical Insights, Photometrics). For main acquisitions (10-min), time-lapse z-stacks of 13 optical sections with 0.5-μm z-spacing were taken every 2 s with exposure times of 0.06 and 0.08 s. In the case of main acquisitions (10-min) of strain LW042, sequential time-lapse z-stacks (5-s time interval between each image pair)
of 13 optical sections with 0.5-μm z-spacing was
per-formed, with exposure times of 0.08 and 0.1 s for GFP and mCherry, respectively.
Theoretical model Orientations of the MTs
We model the MTs as two thin, rigid rods of fixed length R1andR2(here and in the rest of this text,
indi-ces 1 and 2 represent the first and the second MT, re-spectively), each with one end freely joint (pinned, but not clamped) at the respective SPB. Their orientations are represented by unit vectors ^r1;2 (Fig. 4a), and the SPBs are positioned at the origin and at dSPB¼dSPB^z, with^zbeing the unit vector in the direction of the Car-tesian z-axis. The MTs pivot around their respective SPB with the angular velocitiesω1,2. The orientations of MTs
change in time,t, as
d^r1;2
dt ¼ω1;2^r1;2: ð1Þ
In the overdamped limit, the angular friction experi-enced by the MTs is balanced by the total torque,
γ1;2ω1;2¼T1;2; ð2Þ
where γ1,2 is the angular friction coefficient of the
MTs. The total torque consists of two contributions,
T1;2¼τ1;2þσ1;2½^r1;2η1;2ðtÞ, where the first term is the
deterministic torque, τ1,2, caused by the forces exerted
by the crosslinking proteins attached to the MTs and the second term is the stochastic term describing the noise. In our model, the noise is thermal, so its intensity is
cal-culated from the equipartition theorem as σ1;2
¼ ffiffiffiffiffiffiffiffiffiffiffiffiffiffiffiffiffiffi2kBTγ1;2
p
, with kBT being the Boltzmann constant
multiplied by the temperature. The 3-dimensional
ran-dom vector η1,2 has components that are normally
dis-tributed with zero mean and unit variance. The noise is uncorrelated in time and its components are independ-ent, 〈ηi(t),ηj(t′)〉=δ(t−t′)δij, with δ(t−t′) being the
Di-rac delta function and δij is the Kronecker delta
function. Using these definitions and eq. (2), we obtain the equations for the angular velocities of the MTs,
ω1;2¼D1;2 τ1;2
kBTþ
ffiffiffiffiffiffiffiffiffiffiffi
2D1;2 p
^r1;2η1;2ð Þt
h i
; ð3Þ
whereD1,2=kBT/γ1,2denotes the angular diffusion
co-efficient of the MTs.
Forces, torques and movement of crosslinking proteins The torques in Eq. (3) depend on the distributions of the crosslinking proteins which are attached at a given time, τ1;2¼
PN
i¼1r1;2;if1;2;i. The indices i= {1, ..,N},
refer to crosslinking proteins attached to both MTs. A crosslinking protein that is attached to the MTs is
modeled as a Hookean spring with the rest length y0,
and ends attached at the positions r1;2;i¼r1;2;i^r1;2 from the respective SPBs, wherer1,2;iis the position along the
MTs. The vector describing the elongation of the spring is yi=r2;i+dSPB−r1;i, and the elastic force exerted by
the spring reads
f1;2;i¼ kyi 1−
y0
yi
j j
; ð4Þ
wherekis the spring stiffness.
The model introduced so far applies to any type of crosslinking proteins, including motor proteins and pas-sive crosslinkers. However, the velocity of a crosslinking protein along the MTs depends on whether its move-ment is driven by an active process, as in the case of motor proteins, or it is thermal, as in the case of passive crosslinkers. If the crosslinking protein behaves as a motor protein, its velocity along MTs is given by
v1;2;ið Þ ¼t v0 1−f1;2;i∙^r1;2;i
f0
þ ffiffiffiffiffiffiffiffi2Dc p
η1;2;ið Þt ; ð5Þ
where the first, deterministic term is the motor vel-ocity described by a linear force-velvel-ocity relationship and the second, stochastic term describes velocity fluctu-ations. Velocity of a motor head at zero load and the stall force are denotedv0, andf0, respectively, whileDcis
the variance of the velocity fluctuations. On the other hand, if the crosslinking protein behaves as a passive crosslinker, its velocity along the MTs is given by
v1;2;ið Þ ¼t −
Dc
kBT f1;2;i∙^r1;2;iþ ffiffiffiffiffiffiffiffi
2Dc p
η1;2;ið Þt : ð6Þ
As expected from the fluctuation-dissipation theorem, both the friction coefficient,Dc/kBTin the first term and
the noise intensity ffiffiffiffiffiffiffiffi2Dc
p
in the second term depend on the diffusion constant of crosslinkers along MTs,
de-noted Dc. We will refer to the Eqs.(5) and (6) as the
Crosslinking protein attachment and detachment
Finally, the crosslinking proteins can attach to and
de-tach from the MTs, so their total number N(t) changes
in time. In every small time intervalΔt, a new crosslink-ing protein can attach to both MTs with probability
konN0Δt, where N0(y) is the effective number of
cross-linking proteins in the nucleoplasm that takes into ac-count the energy of their stretching (see Eq. (15) below). Alternatively, an already attached crosslinking protein can detach with the probability koffNΔt. The constants
konandkoffare the attachment and detachment rates,
re-spectively. It is important to note that the crosslinking protein indicesi= {1, ..,N} have to change to account for the attachment or detachment events every time they occur.
Solutions of the model
To obtain the time course of the MT orientations, we parameterize the orientation of the MT given by the unit vector by ^r1;2ðθ1;2;ϕ1;2Þ ¼ ðsinθ1;2 cosϕ1;2; sinθ1;2 sin ϕ1;2; cosθ1;2Þ, whereθ1,2 and ϕ1,2 denote the polar and
azimuthal angle, respectively. In this parameterization, equation (3) yields the equations of motion for the an-gles [30],
d dt
θ1;2 ϕ1;2
¼ D
kBT XN
i¼1
r1;2;iF1;2;i
! ∘a1;2
þD cotθ1;2 0
þ ffiffiffiffiffiffiffiffiffiffiffi2D1;2
p ηθ;1;2
cscθ1;2ηϕ;1;2
; ð7Þ
where ∘ represents the Haddamard (element-wise)
product. For compactness, we introduced a term with dependence on positions of the crosslinking proteins that has dimension of force,
F1;2;i≡k r2;1;i−L2;1
r2;1;i
1−y0 yi
; ð8Þ
And a term that depends only on the angles,
a1;2≡
sinθ2;1 cosθ1;2cos ϕ1;2−ϕ2;1
−cosθ2;1sinθ1;2
sinθ2 sinϕ2;1−ϕ1;2
:
ð9Þ
Here, the coordinates on the MTs where they are
clos-est to each other are denoted L2,1. Because of the fact
that the summation in equation (7) changes after attach-ment or detachattach-ment events, it is useful to rewrite it in terms of the average values,
XN
i¼1
r1;2;iF1;2;i¼N rF1;2þ XN
i¼1
ri−r
ð Þ
F1;2;i−F1;2
; ð10Þ
wherer1;2≡
PN
i¼1r1;2;i=N andF1;2≡
PN
i¼1F1;2;i=N. To
calculate F1;2, we use two assumptions: first, the elonga-tions of the motors are comparable to their rest length,
yi≈y0; second, the unit vectors of the crosslinking
pro-tein elongations,^yi, point in a random direction with an
isotropic distribution. These approximations allow us to express the average of the term in equation (8) in terms of average positions of the crosslinking proteins
F1;2¼
k 2
r2;1−L2;1
r2;1
: ð11Þ
Finally, the second term in Eq. (10) can be evaluated using the approximations and results given in [30],
XN
i¼1
ri−r
ð Þ F1;2;i−F1;2
¼ 1
2π2 1þ
ffiffiffiffiffiffiffiffiffiffiffiffiffiffi
2πkBT
ky2 0
s !
1
sinα 2
− 1
cosα 2
0 B @
1 C A
11 ; ð12Þ
where α is the angle between the MTs. This term is
negligible in the case of motors, because it describes fluctuations around the equilibrium, which is only sig-nificant in the case for passive crosslinkers, which have no directional bias. The approach outlined here allows us to express the torque in terms of the average posi-tions of motors or passive crosslinkers and the total number of them attached at any time, rather than posi-tions and states of individual crosslinking proteins. In order to be able to solve the equations of motion for the MTs, we must also obtain the differential equations for those variables.
In the limit in which the number of motors in the nu-cleoplasm, N0, is large, the probability of findingN
mo-tors attached to both MTs, pN, is calculated using the
master equation
dpN
dt ¼konN0pN−1
þkoffðNþ1ÞpNþ1−ðkonN0þkoffNÞpN: ð13Þ
For N≫1, N(t) can be considered a continuous
dN
dt ¼konN0−koffNþ
ffiffiffiffiffiffiffiffiffiffiffiffiffiffiffiffiffiffiffiffiffiffiffiffiffiffiffiffiffi
konN0þkoffN p
ηN: ð14Þ
This equation is derived by calculating the expected
value of the number of motors, E½N ¼P∞N¼0NpN and
the variance, varðNÞ ¼P∞N¼0N2p
N−ðE½NÞ
2
from Eq. (13). The effective number of crosslinking proteins in the nucleoplasm can be approximated by
konN0¼
koncnuc
sinα e
−y2min
y2
0; ð15Þ
where the constant koncnuc is termed the motor
con-centration parameter and ymin=y(L1,L2) is the minimal
distance between the MTs.
Aside from movement of attached crosslinking pro-teins along MTs, motor attachment and detachment affect the average coordinates of the motors. Here it is convenient to introduce the auxiliary coordinates
u¼ ðr1þr2Þ=2 andw¼ ðr1−r2Þ=2, because the velocities of crosslinking proteins along those coordinates are mutually independent. By considering the attachment and detachment jump processes in the continuous limit, we obtain two independent Langevin equations for the average coordinates of the motors,
du
dt ¼vu−konN0 u−Lu
Nþ1
þ
ffiffiffiffiffiffiffiffiffiffiffiffiffiffiffiffiffiffiffiffiffiffiffiffiffiffiffiffiffiffiffiffiffiffiffiffiffiffiffiffiffiffiffiffiffiffiffiffiffiffiffiffiffiffiffiffiffiffiffiffiffiffiffiffiffiffiffiffi
konN0
Nþ1
ð Þ2 ðu−LuÞ
2þ kBT
4k sin2α 2 0 B @ 1 C A v u u u u
t ηu;a
þ σu
N−1
j jηu;d;
ð16aÞ
dw
dt ¼vw−konN0 w−Lw
Nþ1
þ
ffiffiffiffiffiffiffiffiffiffiffiffiffiffiffiffiffiffiffiffiffiffiffiffiffiffiffiffiffiffiffiffiffiffiffiffiffiffiffiffiffiffiffiffiffiffiffiffiffiffiffiffiffiffiffiffiffiffiffiffiffiffiffiffiffiffiffiffiffiffi
konN0
Nþ1
ð Þ2 ðw−LwÞ
2þ kBT
4k cos2α
2 0 B @ 1 C A v u u u u
t ηw;a
þ σw
N−1
j jηw;d;
ð16bÞ
whereLu,w= (L1±L2)/2 andvu;w ¼
PN
i¼1ðv1;iv2;iÞ=2N
are the velocities of the average coordinates of cross-linking proteins, obtained from Eqs. (5) or (6) for motors or passive crosslinkers, respectively. The average of the force projection PNi¼1f1;2;i∙^r1;2;i is evaluated in the
same way as Eqs. (11). The terms σu,w represent the
standard deviations of the stationary distributions of the coordinates obtained from Eqs. (5) and (6) for motors and passive crosslinkers respectively.
Using the average coordinates given in equations (16a,b) and the number of attached motors given by Eq. (13), we calculate the torque components in Eq. (7), which determine the MT orientations, thus solving the model.
Choice of parameter values
Our model has 12 parameters. There are 7 parameters related to motors, which we estimated based on previous in vitro measurements for kinesin-5. The movement of motors is described by their velocity at zero load,v0=−
0.01 μm/s, which we estimated as half the measured
contour velocity (roughly −0.02 μm/s), given that the
tetrameric motors walk along each MT with half of this velocity. This velocity is 3 times smaller than velocity measured from in vitro motility assays for Cut7 [23], 2
times smaller than velocity for Kip1 purified from
Sac-charomyces cerevisaefrom in vitro experiments, at high ionic strength conditions in [22], and 6 time smaller than velocity for purified Cin8 in budding yeast
mea-sured in [19, 21]. The motor velocity dispersion, Dc=
5 × 10⁻⁴μm2/s, is estimated based on theory (Dc=rv0d/2,
where d= 36 nm is the kinesin step size andr≈0.39 is
the randomness observed in optical tweezer experiments
[55]. For stall force, we usedf0=−1.5 pN measured for
Cin8 from budding yeast [56], which is consistent with the stall force estimated for Xenopus kinesin-5 [80], but five times smaller than reported in human kinesin-5
di-meric construct [81]. The off rate 0.1 s−1 of motor
de-tachment is estimated based on/from the dwell time for Cin8 [19], which is similar to the value used in [32], and two times smaller than off rate for Kip1 in [22], esti-mated as the motor velocity divided by its run length). Value for the motor concentration parameter is roughly estimated so that there are 10 motors attached when the MTs are in contact and the angle between them is 120°,
koncnuc= 0.5 s−1. The value of 10 motors was chosen
be-cause in the experiments, at the angles in the range 90 °
−150°, the number of Cut7 motors at the MT contact
site was estimated to be of the order of 10, by using the approach from our previous work [82]. In the model, the motor is described as a Hookean spring whose stiffness isk= 300 pN/μm [57] and whose rest length,y0= 53 nm,
matches the length of the crossbridge, Fig. 3c in [58],
which is similar to the motor rod length measured in [83,84] and equal to the one used in [32].
For the MTs, we have 3 parameters: diffusion constant
D1,2, MT length R1,2 and number of MTs in a nucleus
nMT. We calculate the diffusion constant asD∝R−3[85]
using fitting results from [29], which is consistent with [30]. Our model does not include MT growth and shrinkage, which is a reasonable simplification given that MTs in this system spend most of their lifetime at a
Yet, we take variability in MT length into account by as-suming that MT lengths follow an exponential distribu-tion, where the lengths of an ensemble of MTs correspond to the lengths of dynamic MTs averaged over time. The expected value of measured MT lengths is
1.5 μm [29]. We assume that the distribution of MT
lengths is exponential [59], but measurements only take
into account MTs longer than 0.7μm, so the real
distri-bution consistent with the measurements is R~Exp(1/
0.8 μm−1), yielding the expected value of R1,2= 0.8 μm.
In our experiments, the average number of visible MTs on each SPB is 4, which means there are on average 10 MTs in a real cell, using the above exponential distribu-tion. Assuming there is a roughly equal number of MTs at each SPB, this implies that there are around 25 pos-sible combinations of MTs that can form a bundle, and the real bundling time is the fastest bundling time out of these combinations.
We varied the distance between the SPB in the range to match the variability among the cells in our experi-ments. The nucleus is approximated as a sphere with
ra-dius RC= 1.5 μm, a value that is estimated from the
nuclear volume [60].
Numerical simulations
In order to obtain the average bundling times and con-tour velocities, we solved the system of Eqs. (7), (14),
and (16a,b) numerically by simulating the sample paths.
The simulations were performed using an
Euler-Maruyama scheme for solving stochastic differen-tial equations, with a reflective boundary condition representing the nuclear envelope (the envelope was as-sumed to be a hard spherical shell with both SPBs em-bedded in it). The simulations we performed slightly differently for obtaining bundling times and contour velocities.
For calculating the average bundling time, we
simu-lated 3000 sample paths per value ofdSPBfor MT angles,
which lasted for tmax= 10 min or until the bundling
angle between MTs of αb= 3.05 was reached. The MT
lengths were generated randomly from an exponential
distribution discussed under Table 1. The initial
condi-tion for the angles was randomly generated so that the initial polar angles have a sinusoidal distribution and the azimuthal angles have a uniform distribution. If the ran-domly generated initial orientation would place the MT outside of the nucleus, it would be rejected and gener-ated again. The last time of each run was recorded. In order to represent the fact that there are many MTs on each SPB, the run times were randomly organized into sets of (nMT/2)2, and only the fastest time would
repre-sent a single data point. This was done 10,000 times. For simulating the contour length in time, we set the ini-tial condition for the angles in radians (θ1,θ2,ϕ1,ϕ2)|t= 0
= (0.5, 2.6, 0.001, 0.0001), and fixed the MT length to be
the same as the SPB distance, R1,2=dSPB. We then
per-formed 1000 runs for parameter values shown in Table1
to obtain the sample paths. At each time point, the mean and standard deviation were calculated for all simulation runs (see Fig.5c). The contour velocities shown in Fig.5d were calculated by repeating the simulations for each value of the parameters of interest and performing a linear fit on the simulated data in the time interval 1 s <t< 5 s. The experimental velocity was obtained by performing the linear fit on all of the experimental data before the bundling time.
Quantification and statistical analysis
Maximum-intensity projections were calculated with ImageJ (National Institutes of Health, Bethesda, MD, USA) using the plug-in Grouped Z Projector under Stacks selection. The color-merge images were obtained by overlay of projections in green and red channels using Merge Channels under Color selection.
Tracking of MTs and SPBs was done as follows: the position of MT tips was manually tracked by using Man-ual Tracking plug-in under Tracking selection. MT
tracking was performed on MTs longer than 0.5μm that
appeared before spindle reassembly with traces longer than 1 min. MT contact was identified visually by using the tubulin signal. Note that in maximum-intensity pro-jections, MTs may appear as in contact, while being
sep-arated along the z-axis. In the strains in which SPBs
were fluorescently labeled, SPBs were tracked by special-ized tracking software [86], whereas in other strains the position of the SPBs was estimated based on the end of MT signal.
The average spindle reassembly timewas calculated as the total time of spindle reassembly over all cells (for non-assembled spindles this time is equal to the dur-ation of imaging, i.e., 10 min) divided by the number of reassembly events. The error (s.e.m.) was calculated as the average reassembly time divided by the square root of the number of reassembly events.
The contour length of MTswas measured in 14 out of 21 cells in which MTs interacted at an oblique angle. In the remaining 7 cells, the contour length was not mea-sured because the point of MT contact was not clearly visible in all time frames. We measured the contour length up to 10 s before and 4 s after the first antiparallel
bundle was formed (time t= 0). We measured the
con-tour length using Multi-point tool in Fiji. In each time frame, we measured the coordinates of three points: at one SPB, at the point of MT interaction, and at the other
SPB (Additional file1: Figure S1e). From the coordinates
Signal intensity profiles of mCherry-tubulin and Cut7-3GFP were measured by using a Freehand Line tool in Fiji. The line was drawn starting from the cyto-plasm, passing though one SPB, following the MT con-tour via the contact point, passing through the other SPB, and ending in the cytoplasm. A new line was drawn on each time frame in the channel for mCherry-tubulin.
Data are presented as mean ± s.e.m. The error (s.e.m.) on proportion data was calculated as pffiffiffiffiffiffiffiffiffiffiffiffiffiffiffiffiffiffiffiffiffiffiffiðpð1−pÞÞ=n,
where n is the sample size, and p is the number of
events divided by n. Data analysis was performed using
custom scripts written in MATLAB (Mathworks). Figures were assembled in Adobe Illustrator (Adobe
Sys-tems). The animation in Fig. 4c and Additional file 5:
Movie S4 was generated in Wolfram Mathematica (Wolfram Research).
Additional files
Additional file 1:Figure S1.Additional results on spindle reassembly.
Figure S2.Additional time lapses and reassembly time in cells with labeled Cut7 or kinetochores.Figure S3.Simulations of contour length with an asymmetric initial configuration and with additional parameter variation.Table S1.Strains used in this study. (PDF 2070 kb)
Additional file 2: Movie S1.Spindle reassembly in anS. pombecell expressing GFP-tubulin and Sid4-GFP (strain KI061). Images are maximum-intensity projections; time is given in min:s starting from time 0 when microtu-bules start to grow, scale bar, 1μm. Time 0 is the time when the cold treat-ment ended and the temperature was raised to 24 °C. The movie corresponds to Fig.1b. (MP4 1350 kb)
Additional file 3: Movie S2.Movie of acut7.24tscell expressing
mCherry-tubulin (strain CF.391) at non-permissive temperature, in which the spindle did not reassemble. Images are maximum-intensity projections; time is given in min:s starting from time 0, scale bar, 1μm. Time 0 is the time when the cold treatment ended and the temperature was raised to 37 °C. The movie corresponds to Fig.3b. (MP4 3650 kb)
Additional file 4: Movie S3.Spindle reassembly in a cell expressing Cut7-3GFP (green), mCherry-tubulin (magenta), and Sid4-mCherry (magenta; strain LW042). Images are maximum-intensity projections; time is given in min:s, scale bar, 1μm. Time 0 is the time when the cold treatment ended, and the temperature was raised to 24 °C. The movie corresponds to Fig.3c. (MP4 1460 kb)
Additional file 5: Movie S4.Animation of the MT bundling process calculated by using the model. Data for the orientations of MTs (gray rods) as well as the distribution of the motors (green) are taken from the same simulation run used in Fig.4b. To illustrate the motor distribution, the position of each motor is randomly generated using a normal distribution around their mean position with the steady state variance, which is calculated from the MT orientations. The small gray spheres represent the SPBs and the large translucent gray sphere represents the nuclear envelope. The movie corresponds to Fig.4c. (MP4 1540 kb)
Abbreviations
GFP:Green fluorescent protein; MT: Microtubule; SPB: Spindle pole body
Acknowledgements
We thank Phong Tran, Jonathan Millar, and Yeast Genetic Resource Center for strains and plasmids; Falk Elsner from the Electronics Service of MPI-CBG for building the thermoelectric device; Britta Schroth-Diez and Jan Peychl from the Light Microscopy Facility of MPI-CBG for help with microscopy; IvanaŠarićfor help with image processing and editing the figures; Stefan Diez, Jan Brugues, and members of Tolićand Pavin groups for discussions and advice.
Funding
This work was funded by the Max Planck Society and Unity through Knowledge Fund (UKF, project 18/15 granted to N.P. and I.M.T.). We also acknowledge support from the German Research Foundation (DFG, project TO 564/7-1 granted to I.M.T. and N.P.), QuantiXLie Centre of Excellence, a project cofinanced by the Croatian Government and European Union through the European Regional Development Fund - the Competitiveness and Cohesion Operational Programme (Grant KK.01.1.1.01.0004, element leader N.P.), and the European Research Council (ERC Consolidator Grant, GA Number 647077, granted to I.M.T.). The funding bodies did not play any role in the design of the study, in collection, analysis, and interpretation of data or in writing the manuscript.
Availability of data and materials
The datasets used and/or analyzed during the current study are available from the corresponding author on reasonable request.
Authors’contributions
LW carried out all experiments except those with labeled kinetochores, which were performed by IK. LW, IB, MP, and IMT analyzed the data. IB, MP, and NP developed the theoretical model. IB and MP solved the model. IMT and NP conceived the project and supervised experiments and theory, respectively. IMT and NP wrote the paper with input from all authors. All authors read and approved the final manuscript.
Ethics approval and consent to participate
Not applicable.
Competing interests
The authors declare that they have no competing interests.
Publisher’s Note
Springer Nature remains neutral with regard to jurisdictional claims in published maps and institutional affiliations.
Author details
1Max Planck Institute of Molecular Cell Biology and Genetics, Pfotenhauerstr.
108, 01307 Dresden, Germany.2Department of Physics, Faculty of Science, University of Zagreb, Bijenička cesta 32, 10000 Zagreb, Croatia.3Division of Molecular Biology, Ruđer BoškovićInstitute, Bijenička cesta 54, 10000 Zagreb, Croatia.
Received: 19 March 2019 Accepted: 16 April 2019
References
1. Prosser SL, Pelletier L. Mitotic spindle assembly in animal cells: a fine balancing act. Nat Rev Mol Cell Biol. 2017;18(3):187–201.
2. Pavin N, Tolic IM. Self-organization and forces in the mitotic spindle. Annu Rev Biophys. 2016;45:279–98.
3. Brinkley BR, Cartwright J Jr. Ultrastructural analysis of mitotic spindle elongation in mammalian cells in vitro. Direct microtubule counts. J Cell Biol. 1971;50(2):416–31.
4. Ding R, McDonald KL, McIntosh JR. Three-dimensional reconstruction and analysis of mitotic spindles from the yeast, Schizosaccharomyces pombe. J Cell Biol. 1993;120(1):141–51.
5. Mastronarde DN, McDonald KL, Ding R, McIntosh JR. Interpolar spindle microtubules in PTK cells. J Cell Biol. 1993;123(6 Pt 1):1475–89. 6. Winey M, Mamay CL, O'Toole ET, Mastronarde DN, Giddings TH Jr,
McDonald KL, McIntosh JR. Three-dimensional ultrastructural analysis of the Saccharomyces cerevisiae mitotic spindle. J Cell Biol. 1995;129(6):1601–15. 7. Kajtez J, Solomatina A, Novak M, Polak B, Vukusic K, Rudiger J, Cojoc G, Milas
A, Sumanovac Sestak I, Risteski P, et al. Overlap microtubules link sister k-fibres and balance the forces on bi-oriented kinetochores. Nat Commun. 2016;7:10298.
8. Polak B, Risteski P, Lesjak S, Tolic IM. PRC1-labeled microtubule bundles and kinetochore pairs show one-to-one association in metaphase. EMBO Rep. 2017;18(2):217–30.