12 | http://mojes.um.edu.my/ EISSN: 2289-3024
MALAYSIAN ONLINE JOURNAL OF EDUCATIONAL SCIENCES OCTOBER 2018, 6 (4)
INTRODUCTION
In everyday life, people deal with data or observation in which statistics is used. For instance, when measuring weights or heights, weather forecasts or comparing the marks obtained in examinations by different students, eventually people are mentally evaluating the various observations or measurements. In many real-life situations people are using statistical concepts to illustrate data. Eventually, learning statistics not based on computations but reasoning and thinking skills are being major components in describing, evaluating and analysing a data set.
Even though statistics is one of the important topics taught in primary, secondary and tertiary levels in Malaysia and viewed from the perspective of the larger domain of mathematics education, statistical reasoning is not adequately covered in the Malaysian mathematics curriculum. It is a neglected area, especially compared to statistical literacy and reasoning. Statistical reasoning should be included in the components of the statistics curriculum to foster students’ conceptual understanding of statistical concepts. Currently, the components in statistics topic focuses on statistical reasoning whereby students are required to determine the class intervals, mode, mean, median, construct and interpret the graphs which emphasizes on computational skills (Schwartz & Martin, 2004). Recognizing the importance of statistical reasoning education, prominent governmental organizations across the
EFFECTIVENESS OF FATHOM ON STATISTICAL REASONING AMONG FORM FOUR STUDENTS
*Nanteni Ganesan & Leong Kwan Eu Faculty of Education
University of Malaya
ABSTRACT
In this era, the rapid development of computer science and new technologies of information and communication is high hence there is need to introduce the concept of instructional software for teaching and learning statistical reasoning. This study aims at investigating the effectiveness of Fathom based Instruction in Enhancing Statistical Reasoning of Form Four Students. A quasi-experimental non-equivalent pretest-posttest study was conducted with a total of seventy-two form four students randomly assigned to a control group (n = 38) and an experimental group (n = 34). The experimental group was taught using dynamic software, Fathom; meanwhile the control group was taught without involving Fathom. The findings indicated there is a difference in the mean score of posttest between experimental and control groups. The posttest scores showed that students who learned statistical reasoning using Fathom outperformed those in the control group.
13 | http://mojes.um.edu.my/ EISSN: 2289-3024
MALAYSIAN ONLINE JOURNAL OF EDUCATIONAL SCIENCES OCTOBER 2018, 6 (4)
continents such as the National Council of Teachers of Mathematics (NCTM, 2000) and Royal Statistical Society Centre for Statistical Education (2000) in the United Kingdom significantly contribute toward advocating strong statistical reasoning skills among their citizens. This reform movement in statistics education has been especially instrumental in taking this discipline to a higher level of recognition and importance, bringing together various quarters of society with similar interest in statistics education. Thus, the reformations and previous studies support the importance of introducing students to statistical reasoning from school level (NCTM, 2000).
Teacher-centred practices have often led students to memorize formulae, calculation methods and drawing graphs in the learning of statistics instead of building students’ confidence and understanding in statistics. To complete the syllabus on time, procedural teaching is often employed by teachers as they perceive that it is a faster and direct way of transferring mathematical knowledge to students (Lim & Hwa, 2006). Therefore, teachers have failed to provide opportunities for students to connect statistical questions with a concept and real-life situation that can develop students’ statistical reasoning. Teachers are encouraged to view technology use not just as a way to compute numbers, but also as a way to explore concepts and ideas and enhance student learning (Garfield, Chance, & Snell, 2000). Thus, the information and communications technology use should strengthen the teaching and learning of statistical reasoning in the secondary school education system.
STATEMENT OF PROBLEM
In the teaching and learning of statistical reasoning, it has been noted that students had misinterpretations in data and graphs due to lack of understanding (Garfield & Chance, 2000). They calculated the average by adding up all the numbers and dividing by the number of data values regardless of outliers. Apart from that, students confuse mean with median. They misinterpret that mean was the same thing as median (Garfield & Chance, 2000). Besides that, Yoclu and Haser (2013) did a research on eighth grade students concerning their knowledge about average and variability. The findings revealed that students were able to calculate basic arithmetic computation to find mean and median. However, the students face difficulty in understanding concepts and interpreting the value of a measurement. DelMas (2002) explained that statistics classroom should focus less on the learning of computations and procedures and more on activities that help students develop a deeper understanding of students in reasoning and thinking statistically. One-way to do that is by using intuitions and heuristics to help students develop an understanding of abstract concepts and reasoning. Students also need experience with recognizing implications and drawing conclusions in order to develop statistical reasoning.
On the other hand, traditional statistics classes are unable to provide much information through lectures and questions are asked to get some answers without reasoning or interpreting further on how the answer has been obtained. Such methodology is inefficient for developing statistical reasoning because students need to communicate with each other to question and learn to question as well as defend their answers (Garfield, 2002). In a similar way, Cobb and McClain (2004) pointed out that effective classrooms involve statistical arguments and students able to engage in sustained exchanges that focus on significant statistical ideas. Unfortunately, traditional approaches to teaching statistics have focused almost entirely on the skills and mathematics procedures and this is inadequate for students to reason or think statistically (Garfield & Ben-Zvi, 2004).
OBJECTIVE AND RESEARCH QUESTION
The main objective of this study was to investigate the effectiveness of using Fathom on students’ statistical reasoning.
This study aimed at addressing the following research question:
14 | http://mojes.um.edu.my/ EISSN: 2289-3024
MALAYSIAN ONLINE JOURNAL OF EDUCATIONAL SCIENCES OCTOBER 2018, 6 (4)
RESEARCH HYPOTHESIS
H0 : There is no significant difference in Statistical Reasoning test score between
form four students’ in Fathom and Traditional Group after controlling pre-test.
FATHOM SOFTWARE
Chief designer, Bill Finzer developed Fathom in the mid-1990s. Fathom software enables students to get into the flow of working with data and understanding it. Finzer situated the importance of the software in a broader context that all significant problems that we face in the world require people who understand about how to work with data to reach solutions. The educational software Fathom differs from other conventional statistical packages in that it is a pedagogical tool designed for concept development (Finzer, 2001), rather than software designed for professional data analysis. Fathom targets secondary and higher education students. The software was specifically designed to enhance learning and making statistical thinking accessible to students. Its design drew on current studies and several years of academic research about the way students learn and process statistical concepts and the main difficulties they face (Habre, 2013).
CONCEPTUAL FRAMEWORK
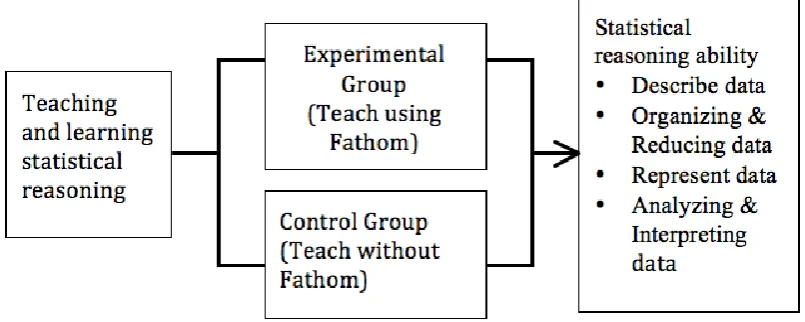
Based on the review of literature and need of study, the conceptual framework for this research was constructed. This conceptual framework (Figure 1) is a combination of Constructivism Theory, a learning theory that helps describe learning as an active process whereby interaction and collaboration between students and teachers are fundamental of learning. This approach was selected for better understanding of the effectiveness of teaching and learning approach on students’ statistical reasoning ability. Based on the conceptual framework, Fathom-based instruction was used to enhance students’ statistical reasoning.
Figure 1. Conceptual Framework
15 | http://mojes.um.edu.my/ EISSN: 2289-3024
MALAYSIAN ONLINE JOURNAL OF EDUCATIONAL SCIENCES OCTOBER 2018, 6 (4)
constructivism emphasizes teaching that fosters student understanding and not simply memorization of facts or procedures (Collins & Halverson, 2018; Doolittle & Hicks, 2003; Staub & Stern, 2002). As this theory aligns with the needs of this study, hence it is suitable to use constructivism as a guideline and to understand the connection between the variables.
REVIEW OF LITERATURE
According to National Standards Council of Teachers of Mathematics (NCTM, 2000), “technology in teaching and learning mathematics is essential and useful” (p. 3). Even though computer used in teaching and learning processes involve multiple applications, the process of creating mathematics should be given more emphasis than the algorithms and solutions (Noraini, 2006). Technology is absorbed into the school curriculum as a step toward instilling, fostering an interest and a positive attitude toward learning.
Based on a quasi-experimental research design, Abdullah and Zakaria (2013) investigated the effectiveness of van Hiele’s phases of learning geometry using the Geometer’s Sketchpad among Form Two students. This study focused on Transformations. The results of the study showed that the students’ levels of geometric thinking in the treatment group were better than the control group. In brief, the researcher recommended that instruction using van Hiele’s phases of learning geometry with GSP had significantly improved students’ geometrical thinking when compared to usual geometry instruction.
Besides that, a combination of technological tools such as the GSP and graphing calculator in teaching quadratic function are good contributors to learning (Tat & Fook, 2005). In their study, Tat and Fook (2005) found that visualization using both the technological tools facilitated learning and increased students' understanding of quadratic functions. This is because plotting graphs are static and not precisely scaled. The ability of visualization is very minimal. Therefore, teachers are encouraged to use technology in teaching and learning mathematics.
Biehler (2006) identified the affordances and complications approach in a study where Year 11–13 students were using Fathom to examine data distributions. One of the focus of the study was how Fathom fostered or hindered learning. Biehler (2006) concluded that the data interpretation tasks through Fathom worksheets allowed students to have greater opportunity to focus on tasks. In another study, García and Sánchez (2017) found that most students’ reasoning and inferencing of given a particular hypothesis testing problem improved after using Fathom. They added that the result represents a significant change in students reasoning skills and that teaching and learning using Fathom prevented important misconceptions. This is aligned with a study done by Lock (2002) investigating whether Fathom Dynamic Software facilitate students statistical concepts. The findings showed Fathom produce intuitive interface that allows students to construct, analyse the changes in blocks and create convenient environment for instructors to develop effective demonstrations that improved students’ statistical concepts. Moreover, Doerr and Jacob's (2011) study of representational capabilities using Fathom had allowed students to illustrate their understanding of sampling distributions and significantly improved students’ overall statistics and their understanding of graphical representations. The dynamic nature of the software combined with a friendly interface that allows students to easily manipulate a statistical environment and observe the effects of their own actions (Lock, 2002).
16 | http://mojes.um.edu.my/ EISSN: 2289-3024
MALAYSIAN ONLINE JOURNAL OF EDUCATIONAL SCIENCES OCTOBER 2018, 6 (4)
2002; Zieffler, Garfield, Delmas, & Gould, 2007). Therefore, dynamic mathematics software Fathom was used in this study to enable students to produce graphs and visualize the multiple representations of the data that develop their statistical reasoning.
METHODOLOGY
Research Design and Sample
A quasi-experimental non-equivalent pre-test and post-test design was used in this study. This design consists of two groups of respondents namely, experimental group and control group. The experimental group learned statistical reasoning using dynamic software Fathom; meanwhile the control group learned statistical reasoning without using Fathom. The sample of this study was selected through convenience sampling; participants were form four students selected from private school in Selangor. Thirty-four students are in experimental group (teach using Fathom) meanwhile the remaining thirty-eight students are in control group. Since all the sample is mix abilities students therefore researcher randomly assigned samples into two groups. Two groups consist of 72 students. Convenience sampling used in this study since not all members of the population selected to participate in this study. Besides that, convenience sampling is the most helpful for exploratory stages of studies such as a pilot study.
Table 1
Sample
Group Number of students
Experimental 34
Control 38
Total 72
Procedure
This study used one instrument, the Statistical Reasoning Assessment for pre-test and post-test. The instrument consists of thirteen questions to gauge students’ statistical reasoning. Before the instructional activities began, both groups were given a pre-test on statistical reasoning. After eight weeks of lessons, a post-test was administrated to measure students’ statistical reasoning between control and experimental groups.
Validity and Reliability
17 | http://mojes.um.edu.my/ EISSN: 2289-3024
MALAYSIAN ONLINE JOURNAL OF EDUCATIONAL SCIENCES OCTOBER 2018, 6 (4)
Data Analysis
The quantitative data were analysed with the Statistical Packages for the Social Sciences (SPSS) version 23. In order to answer the research hypothesis, one-way ANCOVA test was carried out to determine the significance of the mean difference between the control and experimental group on the statistical reasoning performance outcome. ANCOVA statistic was selected for a number of reasons. ANCOVA test is the best instrument for analysis that is based on an adjusted pretest mean scores using posttest measures. ANCOVA can test the significance of differences among means of final experimental data. It also removes the effects of any environmental source as such variation that could inflate the environment error. Thus, the researcher in this study used ANCOVA statistic to ensure that the results were not attributed to other teaching approaches during the experiment.
FINDINGS
One of the objectives of this study is to investigate the effectiveness of using Fathom on students’ statistical reasoning.
H0 : There is no significant difference in Statistical Reasoning test score between form four students in
Fathom and Traditional Group after controlling pre-test.
H1 : There is significant difference in Statistical Reasoning test score between form four students’ in
Fathom and Traditional Group after controlling pre-test.
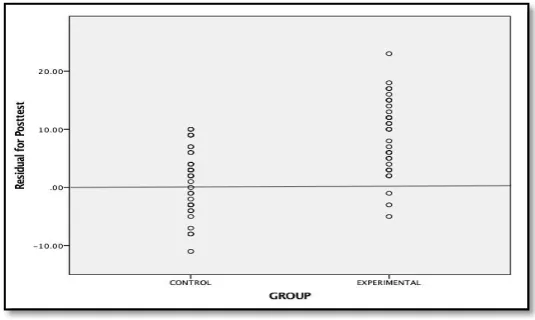
ANCOVA statistics analysis was computed to answer whether there are any significant effects of the statistical reasoning assessment score dependent variable. The research design is quasi-experimental pretest-posttest design with non-equivalent group. The design is needed when the researcher strongly suspects that the pretest measurement will affect the posttest responses in a way that could easily lead to incorrect inferences about the cause (Cook & Reichardt, 1979; Field, 2013). Therefore, ‘Analysis of covariance’ (ANCOVA) is used to test the main and interaction effects of categorical variables on a continuous dependent variable, controlling for the effects of selected other continuous variables, which co-vary with the dependent. To run the ANCOVA statistical analysis a few assumptions need to be met. Figure 2 illustrated evidence of independence; the points fell relatively randomly above and below the horizontal reference line at zero. Therefore, the assumption of independence has been met.
Figure 2. Assumption of Independence
18 | http://mojes.um.edu.my/ EISSN: 2289-3024
MALAYSIAN ONLINE JOURNAL OF EDUCATIONAL SCIENCES OCTOBER 2018, 6 (4)
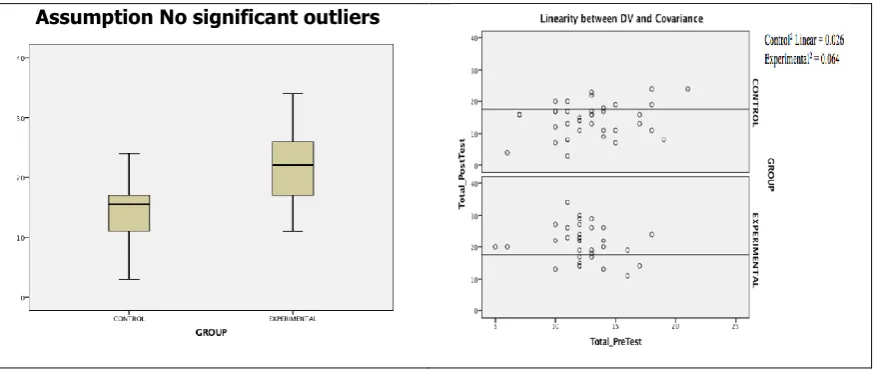
Assumption No significant outliers
Figure 3. Assumptions of Outliers and Linearity
Table 2 show that there was homogeneity of regression slopes as the interaction term was not statistically significant, F (1, 68) = 2.74, p = .102.
Table 2
Assumptions of Homogeneity of Regression Slopes
Source Type of Sum of
Square df Mean Square F P
Corrected Model 939.347a 3 313.116 10.809 .000
Intercept 1030.179 1 1030.179 35.564 .000
Group 228.805 1 228.805 7.899 .006
Pretest .332 1 .332 .001 .915
Group*Pretest 79.493 1 79.493 2.744 .102
Error 1969.764 68 28.967
Total 25240.000 72
Correlated Total 2909.111 71
a. R Squared = .323 (Adjusted R Squared = .293)
The homogeneity of variance-covariance assessed by Levene’s test of homogeneity of variance (F =
.132, p = .717) is shown in Table 3.
Table 3
Levene’s Test of Homogeneity of Variances
F df1 df2 p
.132 1 70 .717
Tests the null hypothesis that the error variance of the dependent variable is equal across groups.
19 | http://mojes.um.edu.my/ EISSN: 2289-3024
MALAYSIAN ONLINE JOURNAL OF EDUCATIONAL SCIENCES OCTOBER 2018, 6 (4)
Table 4
Standardized Residual for Posttest for Control and Experimental Groups
Groups Shapiro-Wilk
Statistics df p
Standardized Residual
for Posttest Control .997 38 .607
Experimental .980 34 .770
As the required assumptions were met the descriptive and inferential analyses on scores were
conducted. The adjusted means of posttest score of statistical reasoning for control were 14.325 (SE
= .886, 95% CI [12.56, 16.09]) and experimental group were 21.28 (SE = .937, 95% CI [19.41, 23.15]) respectively as shown in table 5
Table 5
Adjusted Means of Posttest of Statistical Reasoning Score for Control and Experimental Groups
Group Mean Std. Error
95% Confidence Interval
Lower Bound Upper Bound
Control 14.325a .886 12.556 16.093
Experimental 21.284a .937 19.414 23.154
a. Covariates appearing in the model are evaluated at the following values: Pretest= 12.63
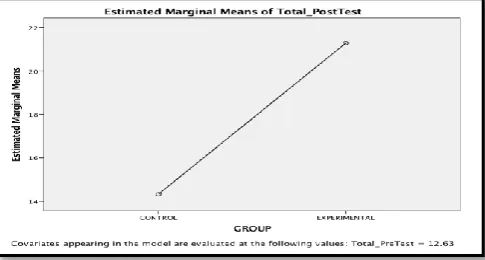
Additionally, Figure 4 shows the estimated marginal means of posttest score where the adjusted mean of posttest for experimental group was higher than the adjusted mean of posttest of control group after the intervention.
Figure 4. Adjusted Means of Posttest Score for Control and Experimental Groups
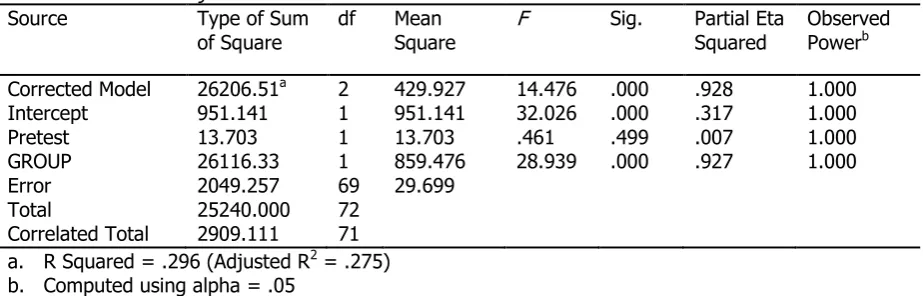
Table 6 shows the Test of Between-Subjects Effects result conducted to determine a statistically significant difference between Statistical Reasoning test score between form four students’ in Fathom and Traditional Group when controlling pretest. The results revealed that there is a statistically significant difference in the mean of the posttest score in Statistical Reasoning assessment between control and experimental group after controlling pre-test, F (1,69) =28.94, p< .005, with a large effect
size (partial 𝜂2 = .93). The effect size suggested that about 93% of the variance in posttest scores
20 | http://mojes.um.edu.my/ EISSN: 2289-3024
MALAYSIAN ONLINE JOURNAL OF EDUCATIONAL SCIENCES OCTOBER 2018, 6 (4)
Table 6
Tests of Between-Subjects Effects
Source Type of Sum
of Square
df Mean
Square F
Sig. Partial Eta
Squared
Observed Powerb
Corrected Model 26206.51a 2 429.927 14.476 .000 .928 1.000
Intercept 951.141 1 951.141 32.026 .000 .317 1.000
Pretest 13.703 1 13.703 .461 .499 .007 1.000
GROUP 26116.33 1 859.476 28.939 .000 .927 1.000
Error 2049.257 69 29.699
Total 25240.000 72
Correlated Total 2909.111 71
a. R Squared = .296 (Adjusted R2 = .275)
b. Computed using alpha = .05
DISCUSSION
In order to enhance students’ statistical reasoning using technology, this study investigated “Effectiveness of Fathom based Instruction in Enhancing Statistical Reasoning of Form Four Students”. The foremost findings of the study reported that there were statistically significant differences in students’ statistical reasoning between students who were learned using dynamic software, Fathom in experimental group compared to students learned without any intervention in control group. The results of this study aligned with the findings of Aridor and Ben-Zvi (2017) stating that students who learned distributions and inferential reasoning using technology performed well. Additionally, Meletiou-Mavrotheris and Paparistodemou (2015) study’s finding stated learning using technology had an effective impact on students’ responsiveness of statistical concepts, representativeness and of the ways to ensure representativeness.
The teaching approach focuses students learning environment corroborated with constructivism learning. The activities organized for students were integrated with the use of technology as a tool that allows students to explore and analyse data in order to develop their statistical reasoning. Teachers used actual data in encouraging students to make a conclusion. During the discussion, students were encouraged to explain, communicate and reason their answers or conclusion so that students able to make argument statistically. The experimental group for this research used the software, Fathom in order to perform basic computations, thus allowing the students to access and explore a variety of information on the data and graphs.
21 | http://mojes.um.edu.my/ EISSN: 2289-3024
MALAYSIAN ONLINE JOURNAL OF EDUCATIONAL SCIENCES OCTOBER 2018, 6 (4)
The findings prove that the use of technology in teaching and learning statistical reasoning is essential and useful. With the availability of Fathom in the classroom, students have more opportunities to visualize, analyse and investigate important data and statistics concepts as well as make connections between statistical ideas and real life. Technological developments have provided various alternatives to traditional approaches in the teaching and learning of statistical reasoning.
CONCLUSION
In this study, the dynamic software Fathom has proven to be an effective tool in enhancing statistical reasoning. The learning process in this study made students actively participate in understanding and reflecting back what they had learned with the help of technology.
Fathom-based instructions do not isolate students from peers and teachers. Instead, it encourages communication between students and teacher when conducting the activities and the students will be confident to explore more during their learning. The constructivism learning theory principles alongside the use of technology is an achievable teaching and learning tool. This aspect has provided enjoyable and meaningful learning environment for students. For further research in the future, it can be conducted by testing on a larger sample. The research can also employ a longer period of intervention alongside focusing on different topics using different levels of students using Fathom.
REFERENCES
Abdullah, A. H., & Zakaria, E. (2013). Enhancing students’ level of geometric thinking through van
Hiele’s phase-based learning. Indian Journal of Science and Technology, 6(5), 4432-4446.
Aridor, K., & Ben-Zvi, D. (2017). The Co-Emergence of Aggregate and Modelling Reasoning. Statistics
Education Research Journal, 16(2).
Ben‐Zvi, D., & Garfield, J. (2008). Introducing the emerging discipline of statistics education. School
Science and Mathematics, 108(8), 355-361.
Biehler, R. (2006). Working styles and obstacles: Computer-supported collaborative learning in
statistics. Paper presented at the Proceedings of ICoTS 7, Salvador de Bahia, Brazil. www.
stat. auckland. ac. nz/~ iase/publications/17/2D2_BIEH. pdf.
Burrill, G., & Biehler, R. (2011). Fundamental Statistical Ideas in the School Curriculum and in Training
Teachers. Teaching Statistics in School Mathematics-Challenges for Teaching and Teacher
Education: A Joint ICMI/IASE Study: The 18th ICMI Study (pp. 57-69). New York: Springer.
Campbell, D. T., & Stanley, J. C. (1963). Experimental and quasi-experimental designs for research.
Handbook of research on teaching, 171-246.
Chance, B., Ben-Zvi, D., Garfield, J., & Medina, E. (2007). The Role of Technology in Improving
Student Learning of Statistics. Technology Innovations in Statistics Education Journal, 1(1),
1-23.
Chance, B., & Rossman, A. J. (2001). Sequencing topics in introductory statistics: A debate on what to
teach when. The American Statistician, 55(2), 140-144.
Cobb, P., & McClain, K. (2004). Principles of instructional design for supporting the development of students’ statistical reasoning. In D. Ben-Zvi (Eds.), The challenge of developing statistical
literacy, reasoning and thinking. (pp. 375-395). New York: Springer.
Collins, A., & Halverson, R. (2018). Rethinking education in the age of technology: The digital
revolution and schooling in America. New York: Teachers College Press.
Cook, T. D., & Reichardt, C. S. (1979). Qualitative and quantitative methods in evaluation. Beverly Hills, CA: Sage.
Davies, N., & Holmes, P. (2000). The Royal Statistical Society Centre for Statistical Education.
Teaching Statistics, 22(1), 2-4.
DelMas, R. C. (2002). Statistical literacy, reasoning, and learning: A commentary. Journal of Statistics
22 | http://mojes.um.edu.my/ EISSN: 2289-3024
MALAYSIAN ONLINE JOURNAL OF EDUCATIONAL SCIENCES OCTOBER 2018, 6 (4)
Doerr, H., & Jacob, B. (2011). Investigating secondary teachers’ statistical understandings. Paper presented at the Proceedings of the Seventh Congress of the European Society for Research in Mathematics Education.
Doolittle, P. E., & Hicks, D. (2003). Constructivism as a theoretical foundation for the use of technology in social studies. Theory & Research in Social Education, 31(1), 72-104.
Field, A. (2013). Discovering statistics using IBM SPSS statistics. London: Sage.
Finzer, W. (2001). Fathom Dynamic Data Software (Version 2.1). Emeryville, CA: Key Curriculum
Press.
García, V. N., & Sánchez, E. (2017). Exploring High School Students Beginning Reasoning about Significance Tests with Technology. In E. Galindo & J. Newton (Eds.), Proceedings of the 39th annual meeting of the North American Chapter of the International Group for the Psychology of Mathematics Education, (pp. 1032-1039). Indianapolis, IN: Hoosier Association of Mathematics Teacher Educators
Garfield, J. (2002). The challenge of developing statistical reasoning. Journal of Statistics Education,
10(3), 58-69.
Garfield, J., & Ben-Zvi, D. (2004). Research on statistical literacy, reasoning, and thinking: Issues, challenges, and implications The challenge of developing statistical literacy, reasoning and
thinking (pp. 397-409): Springer.
Garfield, J., & Chance, B. (2000). Assessment in statistics education: Issues and challenges.
Mathematical Thinking and Learning, 2(1&2), 99-125.
Garfield, J., Chance, B., & Snell, J. (2000). Technology in college statistics courses. In D. Holton et al. (Eds.), The Teaching and Learning of Mathematics at University Level : an ICMI Study (pp. 357-370). Dordrecht, The Netherlands: Kluwer Academic Publishers.
Habre, S. (2013). Enhancing Mathematics Understanding through Visualization: The Role of Dynamical
Software: The Role of Dynamical Software. USA: IGI Global.
Lim, C. S., & Hwa, T. Y. (2006). Promoting mathematical thinking in the Malaysian classroom: issues
and challenges. Paper presented at the meeting of the APEC-Tsukuba International
Conference, Japan.
Lock, R. H. (2002). Using Fathom to promote interactive explorations of statistical concepts. Paper presented at the Proceedings of the Sixth International Conference on Teaching of Statistics, Cape Town. Voorburg, The Netherlands: International Statistical Institute.
Meletiou-Mavrotheris, M., & Paparistodemou, E. (2015). Developing students’ reasoning about
samples and sampling in the context of informal inferences. Educational Studies in
Mathematics, 88(3), 385-404.
NCTM. (2000). Principles and standards for school mathematics. Reston, VA: National Council of Teachers of Mathematics.
Noraini, I. (2006). Teaching and Learning of mathematics: Making Sense and Developing Cognitive Abilities. Kuala Lumpur: Utusan Publications
Schwartz, D. L., & Martin, T. (2004). Inventing to prepare for future learning: The hidden efficiency of encouraging original student production in statistics instruction. Cognition and Instruction, 22(2), 129-184.
Staub, F. C., & Stern, E. (2002). The nature of teachers' pedagogical content beliefs matters for students' achievement gains: Quasi-experimental evidence from elementary mathematics.
Journal of educational psychology, 94(2), 344.
Tat, T. B., & Fook, F. S. (2005). The Effects of Geometer’s Sketchpad and Graphic Calculator in the
Malaysian Mathematics Classroom. Malaysian Online Journal of Instructional Technology.
Yoclu, A., & Haser, C. (2013). 8th grade students’ statistical literacy of average and variation
concepts. Paper presented at the Proceedings of the Eighth Congress of the European Society
for Research in Mathematics Education (CERME8). Ankara: Middle East Technical University. Zieffler, A., Garfield, J., Delmas, R., & Gould, R. (2007). Studying the development of college students’
informal reasoning about statistical inference. Paper presented at the Fifth International