The Study of DLC and Si-DLC Based Coatings and Their
Mechanical Properties
Z. Budinská
1,*, N. Ganev
2, R. Novák
1, Z. Pala
2, I. Štěpánek
3, D. Tischler
11Department of Physics, Faculty of Mechanical Engineering, Czech Technical University in Prague, Prague, Czech
Republic
2Department of Solid State Engineering, Faculty of Nuclear Science and Physical Engineering, Czech Technical University
in Prague, Prague, Czech Republic
3Department of Materials and Mechanical Metallurgy, University of West Bohemia in Pilsen, Pilsen, Czech Republic
Received January 11, 2013; received in revised form February 05, 2013; accepted February 28, 2013
Abstract
In this paper, diamond-like carbon (DLC) films and DLC-Si films were studied. These films were deposited by DC-plasma-assisted chemical vapour deposition (PACVD). X-ray diffraction analysis of coatings was used for a determination of coatings structure. In particular, the effect of the crystal structure of the coatings on their mechanical properties was studied.
Keywords: DLC coatings, DLC-Si coatings, X-ray diffraction, mechanical properties
1.
Introduction
Diamond-like carbon (DLC) amorphous coatings have several excellent properties like high hardness, highwear resistance and low friction coefficient and are therefore highly promising to solve engineering problems [1, 2]. In the automotive industry, DLC coatings are especially expected to improve tribological performance of car parts, because of their low friction and good wear resistance [3, 4].
Basic tribological properties of DLC and Si-DLC coatings are presented by Donnet [6]. With DLC coatings a dense, smooth and amorphous structure can be achieved at such low coating temperatures. Compared to DLC the Me-DLC coatings have a pronounced columnar structure [5]. In [7], Si–DLC films were prepared by IBAD deposition. This films were featureless with predominantly amorphous structure composed of diamond-like and graphite-like domains. Si was shown to participate in the DLC structure by bonding with hydrogen and CHn groups, with the tetrahedral Si–CH3 bonding favored by
the low current density conditions. Tribological experiments showed that Si–DLC films possess high wear resistance and low friction. The results suggest that film thickness and the extent of the diamond-like bonding influence the wear behavior.
Currently, the development in the field of thin-film technology is focused on design and application of new types of thin films in terms of chemical composition, structural features and stratification in multilayers, gradient layers, multi-nanolayers etc. In many cases, technical parameters may not be optimal and, owing to optimization of coatings qualities, substantial improvement of their performance could be achieved.
others could be monitored only. Evidently, evaluation of the effects of the deposition parameters on coatings´ properties is very important, but it is necessary to take into consideration that the applied method can significantly impact the results. This is the case of the mechanical properties evaluation by means of scratch test and static indentation. The results of these tests carried out in a wide range of normal loads can provide many important information and not only the basic properties given by the coating behaviour during indentation tests [8, 10].
2.
Experimental methods
In this study, DLC films were deposited onto the single-crystalline Si and steel substrates. Silicon doped DLC films were deposited using mixtures of the hexamethyldisiloxane vapour with methane (HMDSO+CH4). This mixture has been
used as hydrocarbon, silicon and oxygen gas source. The gases flow rates used in the deposition processes are presented in the Table 1. The depositions of amorphous silicon carbon layers were performed in experimental PACVD equipment. The deposition chamber is 500 mm in diameter and 700 mm in height. The vacuum system consisted of a rotary van pump and Roots pump with the limit pressure of 0.1 Pa. The substrate was placed onto the cathode. Further details of the equipment applied in our experiment are shown in the Fig. 1.
Table 1 Gases flow rates during the deposition process Sample No. CH4[sccm] HMDSO [g/h] Ar [sccm]
0 0 0.6 42
4 4 0.6 42
8 8 0.6 42
12 12 0.6 42
16 16 0.6 42
20 20 0.6 42
50 9 0.5 42
60 9 0.6 42
70 9 0.7 42
80 9 0.8 42
90 9 0.9 42
100 9 1 42
120 9 1.2 42
The flows of CH4, Ar and HMDSO were controlled by mass flow controls and the pressure was controlled by a
butterfly valve independently on the total gas flow. The working pressure varied for different samples in the range from 14 to 20 Pa and the total pressure was held constant during the deposition. The power supply was a DC pulsed with maximum peak height of 1000 V.
Before the deposition, all substrates were ultrasonically cleaned for 15 min in isopropylalcohol and then dried in the flow of nitrogen. The substrates were loaded on the sample holder and the vacuum chamber was exhausted to the limit pressure. After setting the given gases flows and pressure stabilization, the discharge was ignited and the deposition started.
The tests carried out with the deposited layers included thickness evaluation, measurements of both static and dynamic adhesion, friction coefficient and crystal structure. The thickness of the coatings for all the samples was evaluated by Calotest method and was in range (1.5-4) µ m (Fig. 2). The adhesion was investigated by means of scratch test (tester CSEM REVETEST) and static indentation. The scratch test and one of the static indentation measurements were carried out using Rockwell diamond indenter with tip radius of 0,5mm. Another static indentation was carried out with Vickers diamond indenter [9]. During the scratch test, the dependencies of acoustic emission and tangential forces on the applied normal force were simultaneously recorded. The nanoindentation tests were carried out recording the loading curves during indentation, during reducing the load and the test duration.
The maximum loads of 200 g and 25 g were applied for the evaluation of the transition between thin film and substrate and 5g for the evaluation of thin layers in the same place. On the basis of the of indentation curves records, the conclusions concerning the elastic and plastic behaviour of the surface thin layers, layer-substrate systems and base material below the surface layer could be made. Furthermore, recurring cyclical nanoindentation test was done on the same place. The cyclic nanoindentation measurements of a-SiC coatings were performed at ambient temperature using nanoindenter Shimadzu DUH 202. This equipment had a Vickers shaped diamond tip with load resolution of 0.1 mN (with 0.2 nm resolution). For these measurements, a unique modus for cyclic nanoindentation (measurement with progressively increasing value of the maximum load up to 20 steps) was applied. The cyclic nanoindentation test was performed in 20 steps with gradually increased normal load. First measurement was done up to the load of 200 g for substrate hardness determination and second measurement was up to the load of 25 g for the interface of a-SiC layer hardness determination.
X-ray diffraction measurements were carried out in order to establish whether the obtained layers are amorphous or crystalline. Since we assumed only thin coatings, the powder diffractometer was used in the so- called grazing incidence geometry. In this set-up, the incident angle α is kept constant, α = 2° in our case, and only the angle between the primary and diffracted beam is changing; 2θ range was from 10 to 100°. Hence, the penetration depth of X-rays was barely changing during one measurement, large surface area and shallow submicron depth is irradiated. In contrast to Bragg-Brentano diffraction geometry, when divergent primary beam is used, in the applied set-up a parallel beam was obtained by inserting Göbel mirror into primary path of CoKα radiation. The diffracted beam was detected in a point proportional detector equipped with parallel plate collimator.
3.
Results
The samples numbered 0-20 were deposited at constant flow rates of HMDSO and Ar, while the flow rate of CH4
varied in the range from 0 to 20 sccm (standard cubic centimetre per minute). Diffraction patterns typical for amorphous material were obtained, yet among these samples, diffraction peaks are observed for samples No. 0 and No. 12 (Fig. 3), but at different angles. The thickness of these coatings was approximately 2.5 µ m. However, it can only be said that both diffraction patterns do not provide sufficient information for correct phase assignment and that none of the observed peak is from the silicon substrate.
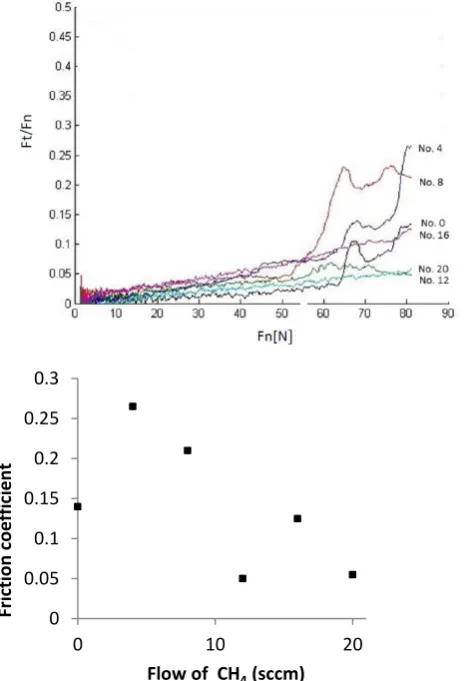
Fig. 4 Record of the measurements of friction coefficient and friction coefficient as a function of the CH4 flow
0 0.05 0.1 0.15 0.2 0.25 0.3
0 10 20
Fr
ic
tion
c
o
e
ff
ic
ie
n
t
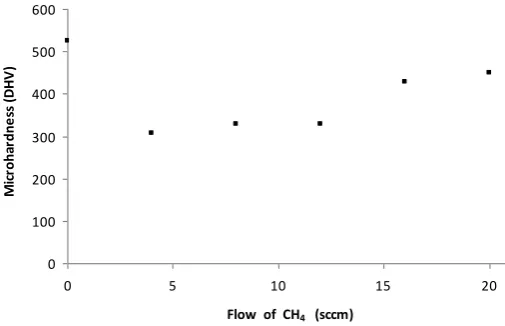
0 100 200 300 400 500 600
0 5 10 15 20
Flow of CH4 (sccm)
M ic roha rdne ss ( D H V )
Fig. 6 Microhardness as a function of the CH 4 flow (samples No. 0, 4, 8, 12, 16, 20)
Fig. 4 and Fig. 7 show the behaviour of the above mentioned samples during the scratch test, i.e. the dependence of friction coefficient and AE signals on the normal force Fn. The most remarkable properties showed the sample No. 12, i.e.
the lowest value of friction coefficient (0.05) and the lowest level of AE signal revealed the best adhesion of the coating. On the other hand, in comparison with other samples (Fig. 6), it showed nearly the lowest value of microhardness (320 DHV) for maximum load of 200 g. The values of nano hardness were in the range 300-550 DHV. The progress of cyclic nanoindentation at the same load 200 g (Fig. 5) showed the improvement and stability of microhardness value both for the sample No. 0 and No. 12, i.e. for the only samples with presence of both amorphous and crystalline phases.
The results of AE (Fig. 7) show that the failure of the coating adhesion occurred for the sample No. 20 at the very beginning and the AE signal is then the lowest for the sample No. 12 and No. 0. It corresponds to the dependence of the friction coefficient and, thus, greater stabilization in the presence of crystalline phases can be observed. A similar behaviour showed sample No. 0. I n the last place, the coating destruction took place on the sample No. 0, but the dependence of the friction coefficient is less stable than for the sample No. 12 (Fig. 4).
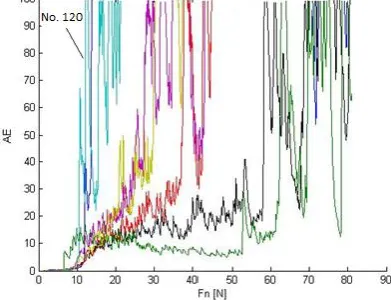
Fig. 7 Record of measurement of AE signal.
The samples numbered 80-120 were deposited at constant flow rate of CH4 and Ar, while the HMDSO flow rate was
Fig. 8 X-ray diffraction patterns of samples No. 80 & 120.
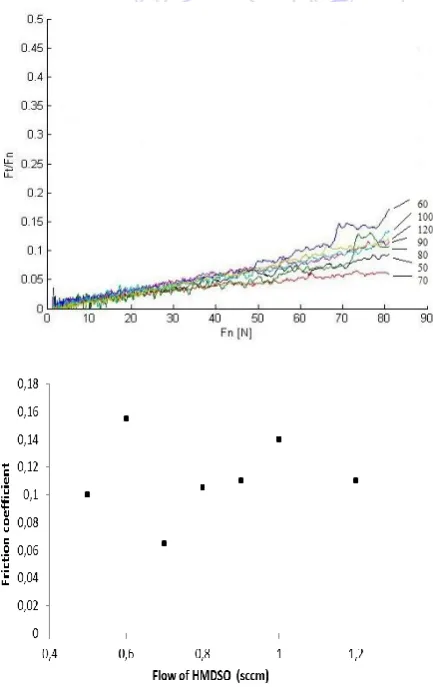
Dependences of the friction coefficient on the normal force Fn (Fig. 9) for the samples No. 80 and No. 120 show the
average values of friction coefficient (0.1-0.12) in comparison with other samples, but the differences are negligible. The best value of the friction coefficient was observed for the sample No. 70 (0.06). These samples show very good microhardness compared to the other samples (Figs. 10 11). Best values of microhardness were observed for the sample No. 90 (650 DHV), No. 80 and No. 120 show values approximately 600 DHV. During the cyclic nanoindentation (Fig. 10), the sample No. 80 showed a relatively stable performance even at higher loads than the sample No. 120.
Fig. 10 Nanoindentation and cyclic nanoindentation -a maximum load of 200 g
(
samples No.50, 60, 70, 80, 90, 100, 120)
0 100 200 300 400 500 600 700
0,4 0,6 0,8 1 1,2
Flow of HMDSO (sccm)
M
ic
roha
rdne
ss
(
D
H
V
)
Fig. 11 Microhardness as a function of the HMDSO flow
(
samplesNo. 50, 60, 70, 80, 90, 100, 120)
The results of AE (Fig.12) show that the coating failure occurred first for the sample No. 100. Destruction of the coating is observed for the sample No. 120 at lower values of load than for sample No. 80. Sample No. 120 shows greater stabilization in the measurement of friction coefficient, but higher fragility. The worst mechanical properties were observed for the sample No. 100.
4.
Conclusions
In this paper, DLC films and DLC-Si films deposited by PACVD method were studied. The obtained samples were characterized by the friction coefficient, acoustic emission measurements, nanoindentation and cyclic nanoindentation tests and X - ray diffraction analysis. Results can be summarized as follows:
X-ray diffraction analysis proved that predominantly amorphous coatings were deposited. Two coatings were thin enough to facilitate the Si substrate to diffract and extremely weak peak of the {111} planes appear in diffraction patterns of sample No. 80 (0.8 g/h HMDSO) and No. 120 (1.2 g/h HMDSO) which were deposited at a constant flow of CH4 (9 sccm).
The lowest friction coefficient value and the most stable dependence of friction coefficient on the normal force Fn
showed samples No. 12 and 70. The AE signal was the lowest for the sample No. 12. A similar progress could be observed for sample No. 20, but the coating destruction occurs on this sample at first, which indicated comparatively high fragility of this coating. The progress of friction coefficient for samples No. 50-120 showed better surface hardening than samples No. 0, 4, 8, 16, but the record of AE signal indicated high fragility too.
Nanoindentation measurement showed the best value of microhardness for sample No. 0 at 200 g load. Comparable results showed samples No. 80, 90, 120. The cyclic nanoindentation results showed higher hardening of surface layers during cyclic indentation on samples No. 0 and No. 70 which corresponded to the low value of the friction coefficient. The improvement and stability of microhardness that was observed on samples No. 12 corresponded to higher toughness.
For samples deposited with constant flow rate of CH4 with increasing HDMSO flow the rate of deposition and coating
thickness significantly increased, and for to the coating thickness value < 4 µm improving of the mechanical properties was observed. At higher HMDSO flow (> 0.8 sccm), it can be observed the presence of crystalline phases, although very indefinitely. Formation of the crystalline phase in amorphous DLC could improve the mechanical properties of the coatings.
References
[1] Matthews and S.S. Eskildsen, “Engineering applications for diamond-like carbon,” Diamond Relat. Mater, vol.3, pp. 902, 1994.
[2] D. Hofmann, S. Kunkel, K. Bewilogua and R. Wittorf, “From DLC to Si-DLC based layer systems with optimized properties for tribological applications,” Surf. Coat. Technology, vol. 215, pp. 357-363, 2013.
[3] H. Dimigen and H. Hubsch, “Applying low-friction wear-resistant thin solid films by physical vapour deposition,” Philips Tech. Review, vol. 41, pp.186, 1984.
[4] A. Grill, “Tribology of diamond like carbon and related materials: an updated review,” Surf. Coat. Technology, vol. 94-94, pp. 507, 1997.
[5] K. Bewilogua, J. Brand, H. Thomsen, M. Weber and R. Wittorf, “Structures, properties and application of diamond-like carbon coatings prepared by reactive magnetron sputtering Z, ” Metallkd., vol. 96, pp. 998, 2005.
[6] C. Donnet: “Recent progress on the tribology of doped diamond-like and carbon alloy coatings: a review,” Surf. Coat. Technology, vol. 100-101, pp. 180-186, 1998.
[7] A. Varma, V. Palshin and E.I. Meletis: “Structure-property relationship of Si-DLC films,” Surf. Coat. Technology, vol. 148, pp. 305-314, 2001.
[9] D. Jakubeczyova, M. Hagarova and I. Stepanek, “Evaluation of thin PVD coatings by adhesive-cohesive test,” Annals of faculty Engineering Hunedoara – International Journal of Engineering, vol. IX, pp. 79-82, 2011.