Available at www.ijsred.com
Analysis of 20 Years Rainfall Data from 1999 to
2018 in Badulla District: A Case Study
N. R. A. M. Ruwangika*, C. N. Hettiarachchi**, G. M. L. P. Aponsu***
(*Department of Physical Sciences and Technology, Faculty of Applied Sciences, Sabaragamuwa University of Sri Lanka.
Email: [email protected])
(** Center for Computer Studies, Sabaragamuwa University of Sri Lanka.
Email :[email protected])
(***Department of Physical Sciences and Technology, Faculty of Applied Sciences, Sabaragamuwa University of Sri Lanka.
Email: [email protected])
---
************************
---Abstract:
The Climate in Sri Lanka is tropical and consists of very characteristic in dry and wet seasons. As compared with the land area of Sri Lanka, Badulla district covers 4.4 %. Badulla district is a capital city of Uva province and it consists of 15 AGA divisions and 1960 villages. Badulla district is an agricultural district where vegetables, tea, fruits, and paddy are cultivated. The district has been separated into two portions as Upper region and Lower region considering the climatic and geographical features. The upper region of the district is eminent for tea plantation and vegetable cultivation while the lower region is famous for paddy agriculture. Changing climate is an uncountable cause of worry for all over the world especially rain-fed developing country. The fluctuated rainfall pattern harmfully affects their crops. The attempt was made to study the variation of monthly, seasonal and annual rainfall over Badulla district of Sri Lanka during twenty years’ period from 1999 to 2018. Annual rainfall trends over the Badulla District showed the increasing trends of about 15.8 mm/Year. Near about 12 years (60 %) shows annual rainfall less than that of mean annual rainfall and 08 years (40 %) show annual rainfall more that of mean annual rainfall. First Inter-Monsoon Season (March-April), Southwest-monsoon Season (May-September) and Second Inter-Monsoon Season (October-November) rainfall trends show the decreasing rainfall trends while Northeast-Monsoon Season (December-February) rainfall trends shows the increasing rainfall trend.
Keywords —Rainfall, Annual, Seasonal, Monthly, Rainfall trends
---
************************
---I. INTRODUCTION
Water is one of the most important substances on the Earth. It is vigorous for life process of while it is a basis of power for living being. There is no substitute for it. Beyond above, water serves many other useful purposes for domestic consumption, agriculture, industry and so on. The main vital source of water in World is the rain which has a dramatic consequence mainly on agriculture. Vegetations get their water supply from natural
sources as well as through the irrigation. The yield of crops in rainfed areas depends mainly on the rainfall pattern. The studying of these patterns is very important. It makes significant to predict the probability of amount of rainfall based on the past records of hydrological data using statistical analysis. By appropriating a frequency distribution to the set of rainfall data, the probability of incidences of random parameter can be calculated.
International Journal of Scientific Research and Engineering Development-– Volume 2 Issue 5, Sep – Oct 2019
Available at www.ijsred.com
ISSN : 2581-7175 ©IJSRED: All Rights are Reserved Page 349
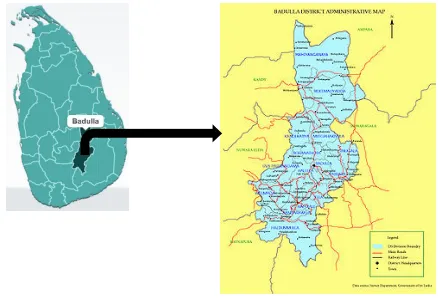
II.STUDY AREA
The present study is carried out at Badulla district (Fig.1) located in Uva province. The region has a latitude and longitude of 6.9934° N and 81.0550° E, respectively and Elevation is 670 m. Agriculture is the main occupation in this area and almost encircled by the BaduluOya River. This area is surrounded by tea plantations and also includes paddy, rubber, banana and vegetables. In Badulla district, it receives rainfall from Inter, northeast and southwest Monsoons. The daily rainfall data is collected from the Meteorological Department of Sri Lanka, for a period of 20 years from 1999 to 2018. These data is used for the Annual, Monthly and Seasonal Rainfall data analysis.
Fig. 1Location map of the study area
III. DATA AND METHODOLOGY
The daily rainfall measured in millimetre (mm) of Badulla district for a period of twenty years from 1999 to 2018 was collected from Metrological Department of Sri Lanka because this study was performed separately for annual, seasonal and monthly rainfall. The monthly rainfall was calculated by taking the total of daily rainfall of the particular month while seasonal and annual rainfall were calculated by taking the total of monthly rainfalls of the particular season and seasonal rainfalls for the particular year, respectively. And finally, average values of each three parameters for the said period were calculated. First
Inter-Monsoon Season (March-April),
Southwest-Monsoon Season (May-September), Second
Inter-Monsoon Season (October-November) and
Northeast-Monsoon Season (December-February) time series of all parameters under study rainfall are prepared and analyzing of data were done using Minitab software.
The Mean, Standard Deviation (St. Dev), Variance, Coefficient of Variation (Coef. Var), Minimum, Maximum, Mean of the Squared Successive Differences (MSSD) of the monthly, seasonal and annual rainfall contributed for the entire period of study (1969-2010) is computed.
IV. RAINFALL FEATURES
Rainfall characteristics of Badulla district are shown in table 1. Annual rainfall over Badulla district from 1999 to 2018 is 1823.9 mm with a standard deviation 385.5 mm. The coefficient of variation of annual rainfall for Badulla is 21.13%. The seasonal rainfall for First Inter-Monsoon Season (March-April), Southwest-Monsoon Season (May- September), Second Inter-Monsoon Season
(October-November), and Northeast-Monsoon
Season (December-February) are 313.7mm, 378.0 mm, 544.7 mm, and 583.2 mm, respectively. Maximum rainfall was observed in Northeast-Monsoon Season which contributes near about 32.22%. First Inter-Monsoon Season, Southwest-Monsoon Season, Second Inter-Southwest-Monsoon Season contribute nearly 17.2 %, 20.73 % and 29.86 % respectively to annual rainfall.
TABLE I
RAINFALL CHARACTERISTICS IN MILLIMETERS ( BADULLA DISTRICT
A. Analysis of Annual Rainfall Trends
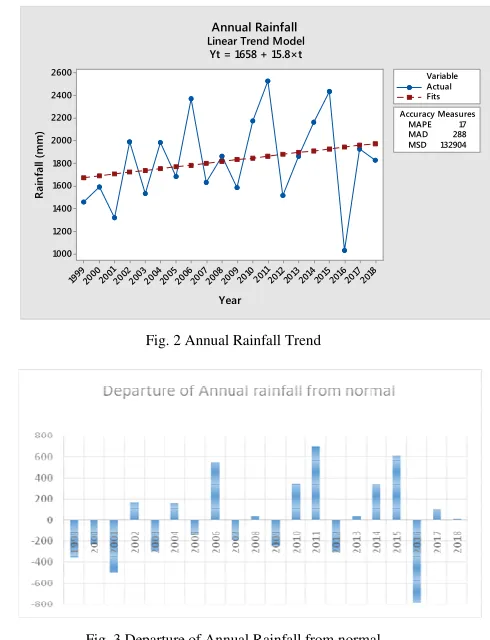
Annual rainfall trends over the Badulla District showed the increasing trends of about 15.8 mm/Year. Near about 12 years (60 %) shows annual rainfall less than that of mean annual
and 08 years (40 %) show annual rainfall more that of mean annual rainfall. The maximum rainfall was observed in 2001 and it is 2525.1 mm. The minimum rainfall was observed in 2010 and it was 1034.7 mm. As considered with the departure of annual rainfall from normal over Badulla, maximum negative departure was shown in 2016 which was -789.225 mm/year. The maximum positive departure was shown in 2011 and it was 701.175 mm/year. The minimum departure was 3.975 mm/year and it was shown in 2018. Annual rainfall shows 21.13 mm/year coefficient of variation from 1999 to 2018.
Variable Mean
St.D ev
Varia nce
Coef. Var
Minim um
January 201.3
132. 5
17562.
3 65.82 24.7
February 116.3
117. 5
13800.
3 100.97 17.4
March 112.5 84.8 7182.9 75.32 3.4
April 201.2
103. 1
10633.
3 51.25 35.7
May 114.4 86 7395.9 75.2 0.4
June 47.6 47.9 2295.6 100.61 2.7
July 47.46
35.6 8
1273.1
8 75.18 10.3
August 69.9 49.1 2408.3 70.24 3
September 98.7 60.7 3690.3 61.55 0.5
October 258.7
142. 5
20310.
2 55.1 60.1
November 286 98.9 9786.3 34.59 137.1
December 269.9
144.
4 20861 53.52 65
First Inter-Monsoon Se
ason 555.9
178.
4 31825 32.09 241.7
Southwest -monsoon Se
ason 1748 472
22239
7 26.97 1048
Second Inter-Monsoon Se
ason 2304 642
41176
9 27.85 1290
Northeast -Monsoon Se
ason 4608 1283
16470
75 27.85 2579
Annual 1823.9
385. 5
14859
0.9 21.13 1034.7
Available at www.ijsred.com
ACTERISTICS IN MILLIMETERS (mm) OF
Annual rainfall trends over the Badulla District showed the increasing trends of about 15.8 mm/Year. Near about 12 years (60 %) shows annual rainfall less than that of mean annual rainfall and 08 years (40 %) show annual rainfall more that of mean annual rainfall. The maximum rainfall was observed in 2001 and it is 2525.1 mm. The minimum rainfall was observed in 2010 and it was 1034.7 mm. As considered with the departure of ainfall from normal over Badulla, maximum negative departure was shown in 2016 789.225 mm/year. The maximum positive departure was shown in 2011 and it was 701.175 mm/year. The minimum departure was 3.975 mm/year and it was shown in 2018. Annual rainfall shows 21.13 mm/year coefficient of
Fig. 2 Annual Rainfall Trend
Fig. 3 Departure of Annual Rainfall from normal
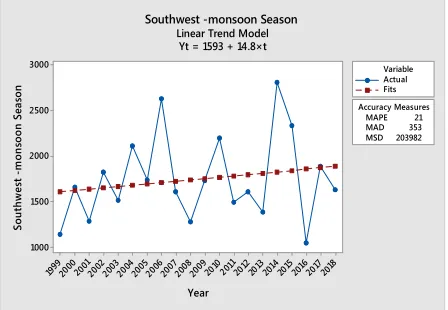
B.Seasonal Rainfall Trends
During the past 20 years, seasonal rainfall has been considerably changed. Considering with coefficient of variation in seasons First Inter Monsoon season, it shows the highest variation as 32.09 mm/year and Southwest
Second Inter-Monsoon Season, Northeast
Monsoon Season shows 26.97 mm/year, 27.85 mm/year, 27.85 mm/year coefficient of variation respectively.
First Inter-Monsoon season rainfall shows a small increasing trend of 0.15 mm/year. The minimum First Inter-Monsoon seasonal rainfall
2014 and maximum First Inter
rainfall was shown in 2016. The respective values are 241.7 mm/year and 947.9 mm/year. In May to September (Southwest-monsoon Season) shows a comparatively high increasing trend of 14.8 mm/year. 1047.9 mm/year and 2815.3 mm/year were shown as a minimum and maximum
20 2012 2011 2010 2009 2008 2007 2006 2005 2004 2003 2002 2001 2000 1999 2600
2400
2200
2000
1800
1600
1400
1200
1000
Year
R
a
in
fa
ll
(m
m
)
Annual Rainf
Linear Trend Mo Yt = 1658 + 15.
Maxim um
MSS D
579.7 20812 .2
538
14747 .7
355.1 7503. 9
406.4 10843
309.4 6703. 9
188.8 3022. 3
162.6 1750. 72
186.7 2401. 6
229.6 4272. 9
508.5 20433 .6
470
11867 .1
669.5 25388 .2
947.9 34845 .7
2815 23506 5
3763 44387 2
7526 17754 89
2525.1 17687 7.5
www.ijsred.com
Rainfall Trend
Departure of Annual Rainfall from normal
During the past 20 years, seasonal rainfall has been considerably changed. Considering with coefficient of variation in seasons First Inter-Monsoon season, it shows the highest variation as 32.09 mm/year and Southwest-Monsoon Season,
eason, Northeast
-Monsoon Season shows 26.97 mm/year, 27.85 mm/year, 27.85 mm/year coefficient of variation
Monsoon season rainfall shows a small increasing trend of 0.15 mm/year. The minimum Monsoon seasonal rainfall was shown in 2014 and maximum First Inter-Monsoon seasonal rainfall was shown in 2016. The respective values are 241.7 mm/year and 947.9 mm/year. In May to monsoon Season) shows a comparatively high increasing trend of 14.8 047.9 mm/year and 2815.3 mm/year were shown as a minimum and maximum
2018 2017 2016 2015 2014 2013 12
MAPE 17
MAD 288
MSD 132904
Accuracy Measures Actual Fits Variable
fall
International Journal of Scientific Research and Engineering Development-– Volume 2 Issue 5, Sep – Oct 2019
Available at www.ijsred.com
ISSN : 2581-7175 ©IJSRED: All Rights are Reserved Page 351
2018 2017 2016 2015 2014 2013 2012 2011 2010 2009 2008 2007 2006 2005 2004 2003 2002 2001 2000 1999
3000
2500
2000
1500
1000
MAPE 21
MAD 353
MSD 203982
Accuracy Measures
Year
S
o
u
th
w
e
st
-m
o
n
so
o
n
S
e
a
so
n ActualFits
Variable
Southwest -monsoon Season
Linear Trend Model Yt = 1593 + 14.8×t
2018 2017 2016 2015 2014 2013 2012 2011 2010 2009 2008 2007 2006 2005 2004 2003 2002 2001 2000 1999
1000
900
800
700
600
500
400
300
200
MAPE 29.5
MAD 135.3
MSD 30233.1
Accuracy Measures
Year
F
ir
st
I
n
te
r-m
o
n
so
o
n
S
e
a
so
n
Actual Fits Variable
First Inter-monsoon Season
Linear Trend Model Yt = 554.3 + 0.15×t
2018 2017 2016 2015 2014 2013 2012 2011 2010 2009 2008 2007 2006 2005 2004 2003 2002 2001 2000 1999
4500
4000
3500
3000
2500
2000
1500
1000
MAPE 32
MAD 617
MSD 623962
Accuracy Measures
Year
S
e
co
n
d
I
n
te
r-m
o
n
so
o
n
S
e
a
so
n Actual
Fits Variable
Second Inter-monsoon Season
Linear Trend Model Yt = 2146 + 15.1×t
2018
2017
2016
2015
2014
2013
2012
2011
2010
2009
2008
2007
2006
2005
2004
2003
2002
2001
2000
1999
10000
9000
8000
7000
6000
5000
4000
3000
2000
1000
MAPE 48
MAD 1586
MSD 4113854
Accuracy Measures
Year
N
o
rt
h
e
a
st
-m
o
n
so
o
n
S
e
a
so
n ActualFits
Variable
Northeast -monsoon Season
Linear Trend Model Yt = 4136 + 45.0×t
Southwest -Monsoon Seasonal rainfalls in the year 2016 and year 2014 respectively. Long term Second Inter-Monsoon Seasonal rainfall shows 15.1 mm/year increasing trend with a maximum in 2014 and minimum in 1016 as 4155.25 mm/year and 947.44 mm/year respectively. Northeast -Monsoon Season in December to February shows a comparatively very high increasing trend with 45.0 mm/year rainfall. The maximum Northeast -Monsoon Seasonal rainfall was shown in 2014 as 9377.43 mm/ year and the minimum was shown in 2016 as 1250.42 mm/year.
Fig. 4 FirstInter-Monsoon Season Rainfall Trend
Fig. 5 Southwest -Monsoon Season Rainfalls
Fig. 6 Second Inter-Monsoon Season Rainfall
Fig. 7 Northeast -Monsoon Season Rainfall Trend
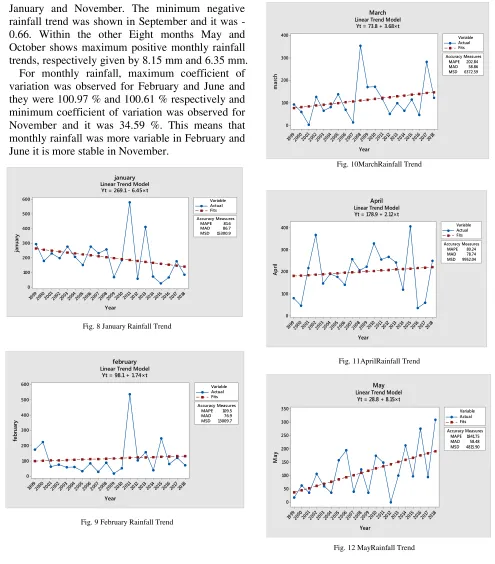
C. Monthly Rainfall Trends
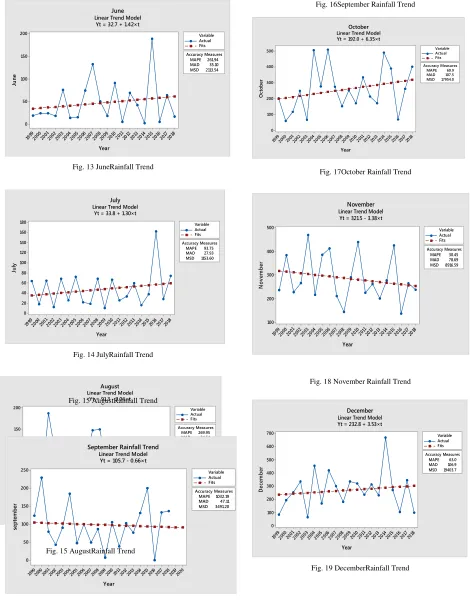
Characteristics of monthly rainfall over Badulla have been calculated for individual months by fitting them to the linear trends. Maximum monthly rainfall was observed for November, December and October and they were 5173.1 mm, 5397 mm and 5720.1 mm respectively. The minimum monthly rainfall was observed in July, June and August and they were 949.2 mm, 952.4 mm and 1397.3 mm correspondingly.
Available at www.ijsred.com
2018 2017 2016 2015 2014 2013 2012 2011 2010 2009 2008 2007 2006 2005 2004 2003 2002 2001 2000 1999
600
500
400
300
200
100
0
MAPE 81.6
MAD 86.7
MSD 15300.9
Accuracy Measures
Year
ja
n
u
a
ry
Actual Fits Variable
january
Linear Trend Model Yt = 269.1 - 6.45×t
January and November. The minimum negative rainfall trend was shown in September and it was -0.66. Within the other Eight months May and October shows maximum positive monthly rainfall trends, respectively given by 8.15 mm and 6.35 mm.
For monthly rainfall, maximum coefficient of variation was observed for February and June and they were 100.97 % and 100.61 % respectively and minimum coefficient of variation was observed for November and it was 34.59 %. This means that monthly rainfall was more variable in February and June it is more stable in November.
Fig. 8 January Rainfall Trend
Fig. 9 February Rainfall Trend
Fig. 10MarchRainfall Trend
Fig. 11AprilRainfall Trend
Fig. 12 MayRainfall Trend
2018 2017 2016 2015 2014 2013 2012 2011 2010 2009 2008 2007 2006 2005 2004 2003 2002 2001 2000 1999
400
300
200
100
0
MAPE 202.84
MAD 58.86
MSD 6372.59
Accuracy Measures
Year
m
a
rc
h
Actual Fits Variable
March
Linear Trend Model Yt = 73.8 + 3.68×t
2018 2017 2016 2015 2014 2013 2012 2011 2010 2009 2008 2007 2006 2005 2004 2003 2002 2001 2000 1999
400
300
200
100
0
MAPE 80.24
MAD 78.74
MSD 9952.04
Accuracy Measures
Year
A
p
ri
l
Actual Fits Variable
April
Linear Trend Model Yt = 178.9 + 2.12×t
2018 2017 2016 2015 2014 2013 2012 2011 2010 2009 2008 2007 2006 2005 2004 2003 2002 2001 2000 1999
350
300
250
200
150
100
50
0
MAPE 1841.75
MAD 58.48
MSD 4815.90
Accuracy Measures
Year
M
a
y
Actual Fits Variable
May
Linear Trend Model Yt = 28.8 + 8.15×t
2018 2017 2016 2015 2014 2013 2012 2011 2010 2009 2008 2007 2006 2005 2004 2003 2002 2001 2000 1999
600
500
400
300
200
100
0
MAPE 109.5
MAD 76.9
MSD 13009.7
Accuracy Measures
Year
fe
b
ru
a
ry
Actual Fits Variable
february
International Journal of Scientific Research and Engineering Development-– Volume 2 Issue 5, Sep – Oct 2019
Available at www.ijsred.com
©IJSRED: All Rights are Reserved Page 353
2018 2017 2016 2015 2014 2013 2012 2011 2010 2009 2008 2007 2006 2005 2004 2003 2002 2001 2000 1999 200 150 100 50 0 MAPE 269.95 MAD 34.54 MSD 2149.22 Accuracy Measures Year A u g u st Actual Fits Variable August
Linear Trend Model Yt = 91.3 - 2.04×t Fig. 13 JuneRainfall Trend
Fig. 14 JulyRainfall Trend
Fig. 15 AugustRainfall Trend
Fig. 16September Rainfall Trend
Fig. 17October Rainfall Trend
Fig. 18 November Rainfall Trend
Fig. 19 DecemberRainfall Trend
2018 2017 2016 2015 2014 2013 2012 2011 2010 2009 2008 2007 2006 2005 2004 2003 2002 2001 2000 1999 200 150 100 50 0 MAPE 261.94 MAD 35.10 MSD 2113.54 Accuracy Measures Year Ju n e Actual Fits Variable June
Linear Trend Model Yt = 32.7 + 1.42×t
2018 2017 2016 2015 2014 2013 2012 2011 2010 2009 2008 2007 2006 2005 2004 2003 2002 2001 2000 1999 180 160 140 120 100 80 60 40 20 0 MAPE 93.75 MAD 27.93 MSD 1153.60 Accuracy Measures Year Ju ly Actual Fits Variable July
Linear Trend Model Yt = 33.8 + 1.30×t
2020 2019 2018 2017 2016 2015 2014 2013 2012 2011 2010 2009 2008 2007 2006 2005 2004 2003 2002 2001 2000 1999 250 200 150 100 50 0 MAPE 1032.19 MAD 47.11 MSD 3491.20 Accuracy Measures Year se p te m b e r Actual Fits Variable
September Rainfall Trend
Linear Trend Model Yt = 105.7 - 0.66×t
2018 2017 2016 2015 2014 2013 2012 2011 2010 2009 2008 2007 2006 2005 2004 2003 2002 2001 2000 1999 500 400 300 200 100 0 MAPE 69.9 MAD 107.5 MSD 17954.0 Accuracy Measures Year O ct o b e r Actual Fits Variable October
Linear Trend Model Yt = 192.0 + 6.35×t
2018 2017 2016 2015 2014 2013 2012 2011 2010 2009 2008 2007 2006 2005 2004 2003 2002 2001 2000 1999 500 400 300 200 100 MAPE 30.45 MAD 78.69 MSD 8916.59 Accuracy Measures Year N o v e m b e r Actual Fits Variable November
Linear Trend Model Yt = 321.5 - 3.38×t
2018 2017 2016 2015 2014 2013 2012 2011 2010 2009 2008 2007 2006 2005 2004 2003 2002 2001 2000 1999 700 600 500 400 300 200 100 0 MAPE 63.0 MAD 106.9 MSD 19403.7 Accuracy Measures Year D e ce m b e r Actual Fits Variable December
Linear Trend Model Yt = 232.8 + 3.53×t
Available at www.ijsred.com
V.CONCLUSIONS
The aim of the present study was to identify rainfall trends for the period of 1999 to 2018 over Badulla
district. Annual rainfall trends showed a
significantly increasing trend of about 15.8 mm/Year. Near about 12 years (60 %) shows annual rainfall less than that of mean annual rainfall and 08 years (40 %) show annual rainfall more that of mean annual rainfall. The maximum rainfall was observed in 2001 and it is 2525.1 mm and minimum rainfall was observed in 2010 and it was 1034.7 mm.
The minimum First Inter-Monsoon seasonal rainfall was shown in 2014 and maximum First Inter-Monsoon seasonal rainfall was shown in 2016. The respective values are 241.7 mm/year and 947.9 mm/year.
In May to September (Southwest-Monsoon season) shows a comparatively high increasing trend of 14.8 mm/year. 1047.9 mm/year and 2815.3mm/year were shown as minimum and maximum Southwest-monsoon seasonal rainfalls in the year 2016 and year 2014 respectively.
Long term Second Inter-Monsoon seasonal rainfall shows 15.1 mm/year increasing trend with a maximum in 2014 and minimum in 1016 as 4155.25 mm/year and 947.44 mm/year respectively.
Northeast-Monsoon Season in December to February shows a comparatively very high increasing trend with 45.0 mm/year rainfall. The maximum Northeast-Monsoon seasonal rainfall was shown in 2014 as 9377.43 mm/ year and the minimum was shown in 2016 as 1250.42 mm/year.
Characteristics of monthly rainfall over Badulla have been calculated for individual months by fitting them to the linear trends. Maximum monthly rainfall was observed for November, December and October and they were 5173.1 mm, 5397 mm and 5720.1 mm respectively. The minimum monthly rainfall was observed in July, June and August and they were 949.2 mm, 952.4 mm and 1397.3 mm correspondingly.
Analyzing the fitted linear trends, four months (33.33%) shows the decreasing monthly rainfall trend and eight Months (66.66%) shows the increasing monthly rainfall trends. The negative maximum monthly rainfall trends were shown in January and November. The minimum negative rainfall trend was shown in September and it was -0.66. Within the other, eight months May and October shows maximum positive monthly rainfall trends, respectively given by 8.15 mm and 6.35 mm.
REFERENCES
[1] Adger WN, Hug S, Brown K, Conway D, Hulme M (2003). Adaptation
to climate change in the developing world. Proc. Dev. Stud., 3(3): 179-195.
[2] Akinremi, O.O., McGinn, S.M., Cutforth, H.W., 2001. Seasonal and
spatial patterns of rainfall trends on the Canadian prairies. Journal of Climate 14 (9), 2177– 2182.
[3] Anser Khan, SoumenduChatterjee, DipakBisai and NilayKanti
Barman (2014) Analysis of change point in surface temperature time series using cumulative sum chart and bootstrapping for Asansol weather observation station, west Bengal, India American journal on climate change Vol. 3 pp. 83-94.
[4] Dr. Avinash Kadam, Kailas Karnewar (2016), Analysis of monthly
and seasonal temperature trends of Nanded., July 2016., Indian stream research journal vol.6 no.6 pp ;1-9 . Available online at isrj.in
[5] Frich P, Alexander LV, Della-Marta P, Gleason B, Haylock M, Klein
Tank AMG, Peterson T (2002). Observed coherent changes in climatic extremes during the second half of twentieth century. Clim. Res., 19: 193-212.
[6] Guhathakurta, P., Rajeevan, M., 2007. Trends in the rainfall pattern
over India. International Journal of Climatology 28 (11), 1453–1469.
doi:10.1002/joc.1640.Available from:www.intersciences.wiley.com
(2002) The IEEE website. [Online]. Available: http://www.ieee.org/
[7] Intergovernmental panel on climate change (2007) The physical
science basis: in contribution of working group 1 to the fourth assessment report of the Intergovernmental panel on climate change (eds) Soloma. 18.
[8] Jagannathan, P., Bhalme, H.N., 1973. Changes in pattern of
distribution of southwest monsoon rainfall over India associated with sunspots. Monthly Weather Review 101, 691–700.
[9] Jayawardene HKWI, Sonnadara DUJ, Jayewardene DR (2005). Trends
of Rainfall in Sri Lanka over the Last Century. Sri Lankan J. Phys., 6: 7-17
[10] Karnewar Kailas and Avinash Kadam (2015) “a” Study of Temperature
Trends of Nanded, Maharashtra, India. World Rural Observ;7(2):30-35.
[11] Karnewar Kailas and Avinash Kadam (2016) “b” Trends of monthly
and seasonal temperature of Nanded, International Journal of Research in Social Sciences; 6 (9) :90-102.
[12] koteswaram, P., Alvi, S.M.A.,1969. Secular trends and periodicities in
rainfall at west coast stations in India. Current Science 101, 371–375
[13] Murphy, Bradley F, Timbal, Bertrand, 2007. A review of recent
climate variability and climate change in southeastern Australia. International Journal of Clima-tology.doi:10.1002/joc.1627 Available from:www.interscience.wiley.com
[14] Naidu, C.V., Srinivasa Rao, B.R., Bhaskar Rao, D.V., 1999. Climatic
trends and periodicities of annual rainfall over India. Meteorological Application 6, 395– 404.
[15] Nicholls, Neville, Lavery, Beth, 2006. Australian rainfall trends during
the twentieth century. International Journal of Climatology 12 (2),
153–163. doi:10.1002/ joc.3370120204. Available from:
![Lessons from the Minority Serving Institutions (MSI) Cyberinfrastructure (CI) Institute [MSI CI2]](data:image/gif;base64,R0lGODlhAQABAIAAAP///wAAACH5BAEAAAAALAAAAAABAAEAAAICRAEAOw==)