http://www.sciencepublishinggroup.com/j/ogce doi: 10.11648/j.ogce.20190701.12
ISSN: 2376-7669 (Print); ISSN: 2376-7677(Online)
Discussion on the Method of Evaluating Oil and Water
Layers by Using Ratio of Deep Resistivity and Flush Zone
Resistivity
Yang Kebing, Li Shidong, Wang Huijing, Fu Kang, Pan Xuefeng, Zhang Junjie
Petro China Huabei Oilfield Company, Renqiu, China
Email address:
To cite this article:
Yang Kebing, Li Shidong, Wang Huijing, Fu Kang, Pan Xuefeng, Zhang Junjie. Discussion on the Method of Evaluating Oil and Water Layers by Using Ratio of Deep Resistivity and Flush Zone Resistivity. International Journal of Oil, Gas and Coal Engineering.
Vol. 7, No. 1, 2019, pp. 7-12. doi: 10.11648/j.ogce.20190701.12
Received: November 10, 2018; Accepted: December 3, 2018; Published: January 21, 2019
Abstract:
The depth-shallow resistivity ratio method for the same measuring point is an important method to identify oil and water reservoirs, But its application effect in conventional logging data is not good. By studying the invasion characteristics of resistivity curves of reservoirs, the ratio of deep resistivity and flush zone resistivity at the same measuring point is used to evaluate oil and water layers with a good effect. Further research shows that the ratio of deep resistivity to flushing zone resistivity can reflect the oil-bearing property of reservoir. The fact that the ratio of deep resistivity and flush zone resistivity of water layers in the same well is basically a constant supports this view, which can be deduced from Archie's formula. That is, the ratio of deep resistivity to flushing zone resistivity is Rw/Rmf, which is the ratio of formation water resistivity to mud filtrate resistivity. On this basis, a method of evaluating oil and water reservoir by using the ratio of deep resistivity and flush zone resistivity is proposed. One is logging crossplot evaluation method, the other is apparent water saturation calculation and evaluation method. These two methods are not affected by the changes of lithology and resistivity of the reservoir, and do not need data such as porosity, rock-electro parameters and formation water resistivity, which can quickly identify oil and water layers. As the ratio between the deep resistivity and the resistivity of the flush zone is not related to the resistivity of the reservoir, it can be used to evaluate the low resistivity oil reservoir. The results show that it is effective to identify low resistivity reservoirs and it is a reliable method to evaluate low resistivity reservoirs.Keywords:
Deep and Flush Zone Resistivity, Resistivity Ratio, Logging Crossplot, Sw, Identification of Low Resistivity Reservoir1. Introduction
Complex reservoirs such as low resistivity reservoirs have become important targets for increasing production in the middle and late stages of oilfield development. Because the resistivity of the low resistivity oil layer is close to or less than that of the near water layer, it is difficult to identify the low resistivity oil layer with logging data. Over the years, many rock physicists have studied the causes of low resistivity oil and gas reservoirs and gradually understood the causes of low resistivity oil reservoirs [1-4]. At the same time, researchers explored the evaluation methods of low resistivity oil reservoirs from the perspectives of curve overlapping technology, crossplot technolog, semi-quantitative and
quantitative evaluation technology, and proposed some evaluation methods for low resistivity oil reservoirs with different lithology and different causes, showing certain effects [5-7]. Even so, the evaluation of low resistivity oil reservoirs is still a difficult point in current well logging interpretation. Further research on the identification method of low resistivity oil reservoirs is helpful to improve the log interpretation coincidence rate of low resistivity oil reservoirs, which is of great practical significance.
resistivity can reflect the oil-bearing property of reservoir, so it can be used to evaluate oil and water layers. On the basis of the above research, logging crossplot method and apparent water saturation calculation method are proposed to evaluate oil and water layers. This method can effectively identify low resistivity oil layers, and has achieved certain results through practical application.
2. The Progress of the Resistivity Ratio
Method for Evaluation of Oil and
Water Layers
Since the birth of resistivity logging in the 1920s, researchers have found that oil and water reservoirs can be identified by using the intrusion characteristics of resistivity, but it cannot be quantitatively interpreted and evaluated by resistivity data. Until archie formula published in 1942, on the basis of Archie formula to establish a set of quantitative evaluation of reservoir oil saturation technology, established a link between logging theory and logging practices [8]. Then, the researchers to use evaluation method of oil and water layer resistivity data were studied [9-12], and the method of resistivity ratio to identify oil and water reservoirs is proposed. Some people have applied this method to evaluate gas reservoirs and achieved good results [11]. Today, the resistivity ratio method has been widely used [13-19]. However, although the names are called resistivity ratio methods, their contents are quite different. The resistivity ratio method in the early stage refers to the ratio of resistivity to calculated water resistivity. Later, for the development of the ratio of lateral to induction resistivity [15]. The above resistivity ratio method is generally used to compare the deep resistivity curves between different measuring points, such as using the ratio of the deep resistivity of reservoirs to the deep resistivity of adjacent water layers to identify oil layers. By 2015, Yang Kebing and others proposed a method for evaluating oil and water layers with deep and shallow resistivity ratios [20]. This method is obviously different from the earlier resistivity ratio method. It compares the resistivity
data of the same measuring point, which helps to eliminate the influence of lithology and water and improve the recognition accuracy of oil and water layers. Taking the array induction logging data as an example, it is considered that the conventional logging data will not work well. Further study showed that using conventional resistivity logging deep resistivity and flush zone resistivity ratio can also be effective evaluation of oil and water layer. First, the ratio can be used to establish log crossplot, which can be used to identify oil, low resistivity oil, water and high resistivity water. Secondly, the apparent water saturation calculated by this method can be used for low resistivity reservoir evaluation.
It can be seen that the resistivity ratio of deep resistivity to flushing zone at the same measuring point can reflect the oil-bearing property of the reservoir and has a clear proportional relationship with the water saturation of the reservoir. Whether it is increased resistance invasion or decreased resistance invasion, it has the same law of resistivity ratio, that is, the larger the resistivity ratio is, the better the oil-bearing property of the reservoir is, the smaller the resistivity ratio is, and the better the water-bearing property of the reservoir is. This view deserves further study.
3. Characteristics of Deep Resistivity and
Flush Resistivity in the Water, Oil and
Low Resistivity Oil Layers
3.1. Characteristics of Deep Resistivity and Flush Resistivity in the Water Layers
A large number of logging data show that the resistivity of flushing zone is greater than that of deep resistivity in the water layer with high salinity formation water, showing the characteristics of increased resistance invasion, as shown in Figure 1. It can be seen that the different layers of the same well or the same block, regardless of the high resistivity or low resistivity, are characterized by increased resistance invasion. Moreover, the ratio of deep resistivity to flushing resistance is approximately constant.
This conclusion can be deduced from Archie formula. For the water layer at different layers of the same well, according to archie's formula, the response equation of deep and flush resistivity logging in water layer after complete invasion is as follows:
Ro =
Ф (1)
Rxo =
Ф (2)
= Ф Ф
= = A (3)
where Ro is deep resistivity of water layer, Rxo is flush zone resistivity of water layer after complete invasion, Rw is formation water resistivity, Rmf is mud filtrate resistivity, A is a constant that reflects the characteristic value of water layer in a well, Ф is reservoir porosity, a is lithological coefficient and m is porosity index.
It can be seen that, for the completely invaded water layer, the ratio between the deep resistivity and flush zone resistivity is a constant in theory and is defined as A, that is, the ratio of formation water resistivity to mud filtrate resistivity, Rw/Rmf.
As a result of sedimentation, the formation water resistivity Rw value is basically stable in an oil-water system. For the same well, the filtrate resistivity of drilling mud is also basically stable. Therefore, its ratio is also stable and is a basically close constant. According to the actual logging data, the ratio of deep and flush resistivity of pure water layer changes little, which is basically a constant.
3.2. Characteristics of the Deep Resistivity and Flush Resistivity in the Oil and Low Resistivity Oil Layers
When the deep resistivity and the flush zone resistivity of the water layers show the characteristics of increased resistance invasion, the deep resistivity and the flush zone resistivity of the oil layers should show the characteristics of decreased resistance invasion, which has been confirmed in many oilfields. In low resistivity reservoirs, although the deep resistivity of the oil layers is obviously reduced and close to the water layer, the resistivity of the flush zone is lower, which makes the deep resistivity and the flush zone resistivity still show obvious decreased resistance invasion characteristics, which are completely consistent with the high resistivity oil layers, as shown in Figure 2.
Figure 2. Typical log curves of decreased resistance invasion in oil layer and low resistivity oil layer in an oilfield.
It can be seen that the invasion characteristics of deep resistivity and flushing zone resistivity can reflect the oil-bearing property of reservoir. Whether it is high resistivity or low resistivity reservoir, it has the same decreased resistance invasion characteristics, while the invasion characteristics of deep and shallow resistivity are not obvious.
4. Study on Evaluation Method of Low
Resistivity Reservoir
4.1. Crossplot Evaluation
Through the above analysis, the ratio of deep and flushing zone resistivity can reflect the oil content of the reservoir. Whether it is a increased resistance invasion or a decreased resistance invasion, The actual logging data show that the oil content and the resistivity ratio of the reservoir are positively
proportional. It indicates that in the low resistivity reservoir, although the deep resistivity of the reservoir is low, the flush zone has a lower resistivity, which can be used to evaluate the low resistivity reservoir. To evaluate low resistivity oil reservoirs by crossplot principle is that one axis of the crossplot uses the ratio of deep and shallow resistivity, and the other axis uses other logging curves or calculation parameters. For example, the resistivity-resistivity ratio crossplot, the spontaneous potential-resistivity ratio crossplot, etc., can be used for qualitative evaluation of low resistivity oil reservoirs. The following is an example of resistivity-resistivity ratio crossplot.
The selected curve is read according to well log layering, and the ratio of deep and shallow resistivity is calculated. The deep resistivity value is selected as the ordinate of the crossplot and logarithmic scale is adopted, the resistivity ratio is selected as the abscissa of the crossplot and linear scale is adopted. The resistivity and resistivity ratio are then used to make the crossplot. The range of oil layer, oil-water layer and water layer is determined according to the distribution of the crossplot points. This crossplot can be used to evaluate low resistivity reservoirs.
The evaluation results of low resistivity oil reservoirs in a block are shown in Figure 3. It can be seen that low resistivity oil layers and high resistivity water layers are clearly distinguished from each other on the crossplot, providing an effective method for evaluating low resistivity oil reservoirs.
Figure 3. Application example of resistivity-resistivity ratio crossplot in an oilfield.
Figure 4. Application example of SP-resistivity ratio crossplot in an oilfield.
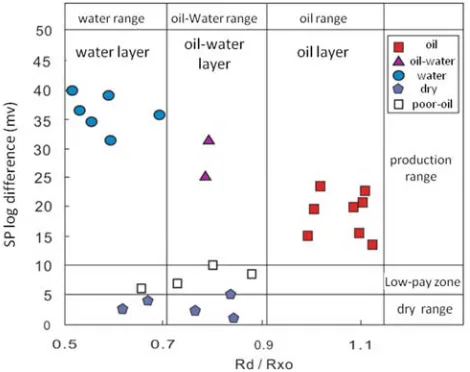
In addition, an example of evaluation of oil and water layer by the spontaneous potentiall- resistivity ratio crossplot is shown in Figure 4. It can be seen that the crossplot of sp log difference and resistivity ratio can distinguish not only oil, low
resistivity layer and water layer, but also dry and low-pay zone. It is also an effective oil-water layer identification crossplot.
4.2. Quantitative Evaluation of Apparent Water Saturation
This method is to use the ratio of deep and flushing zone resistivity to quantitatively evaluate the oil content of the reservoir. A formula for calculating apparent water saturation of a reservoir using resistivity ratio is presented. The principle is that the resistivity ratio of the pure water layer with 100% water saturation is assumed to be constant A, then A = Ro / Rxo. The resistivity ratio of the reservoir with unknown water saturation is B, that is, B = Rt/Rxo. If the ratio of oil layer resistivity is a reflection of oil saturation, the ratio of A to B can be defined as the degree of water content of the reservoir. Because A is the reflection of 100% water content of the reservoir, while B is the reflection of different water content of the reservoir. When the reservoir is pure water, B is close to A. The actual data show that the higher the oil content of the reservoir, the higher the B value will be, and the lower the oil content of the reservoir, the lower the B value will be, until it is equivalent to the pure water layer. The water content of pure water layer is 100%, and the water content of oil layer may be close to 0, which is similar to the characteristics of Sw calculated by Archie formula. It can be thought of apparent water saturation. Assuming that the reservoir's apparent water saturation is Swa, the equation can be expressed as:
Swa = A / B = A / (Rt / Rxo) (4)
Where Swa is apparent water saturation of the reservoir, A is a constant that reflects the characteristic value of water layer in a well, Rt is deep resistivity, Rxo is flush zone resistivity.
It can be seen that the evaluation of oil or water layer by using the apparent water saturation of the reservoir is not affected by the changes of lithology and resistivity, and does not require calculation of porosity, formation water resistivity and rock-electro parameters. It can be evaluated only by resistivity data. It is suitable for the rapid evaluation of oil and water layers in well profile and has certain advantages in the exploration area. At the same time, the apparent water saturation is independent of the resistivity of the reservoir (Whether high resistivity or low resistivity, the apparent water saturation can be reasonably calculated), and depends on the ratio of deep and flush zone resistivity, which is obviously different from archie's formula. Therefore, the apparent water saturation of the reservoir can effectively identify and evaluate the low resistivity reservoir.
When formation oil-water system is complex and has multiple oil migration to form multiple oil-water systems, this method can also be used to determine A of characteristic value of water layer with the principle of sectional treatment explained by logging, so as to ensure reasonable and reliable calculation results.
Table 1. The interpretation standard about Swa calculated by resistivity ratio.
Swa oil show result
≤55 oil immersion or spot oil
55~70 oil spot or trace poor oil oil trace or fluorescence oil-water
60~90 dry
70~100 water
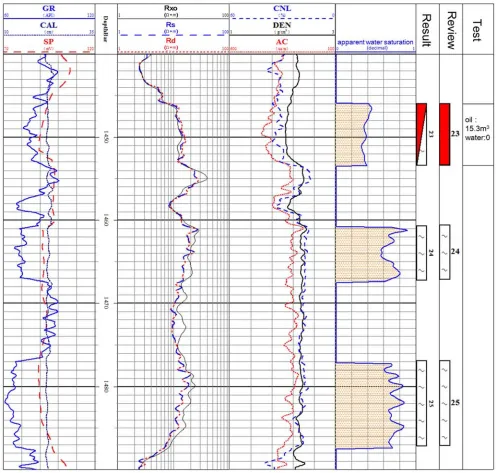
Figure 5 is an application example of well E11-35 in an oilfield. The deep resistivity of no. 23 about 13Ω • m, and the deep resistivity of no. 24 and no. 25 about 15~20Ω • m. The result of no. 23 is oil-water, the result of no. 24 and no. 25 is water. Since the resistivity of the no. 23 layer is significantly lower than that of the water layer, Calculating water saturation
is low, even if the oil in the layer shows better, reaching oil spots. The result of no. 23 is oil-water. However, the resistivity ratio is used to calculate the apparent water saturation for evaluation. The apparent water saturation of no. 23 is less than 40%, which reaches the oil standard, which is interpreted as the oil. The calculated apparent water saturation of no. 24 and no. 25 is more than 70%, which is still water layer. The oil test proved that the test of no. 23, with a daily oil production of 15m3 and no water, was a pure oil layer, indicating that the resistivity ratio could effectively identify the low resistivity oil layer in the water layer section. The conclusion was reliable.
5. Conclusion
a)The ratio between the deep resistivity and the resistivity of the flush zone can reflect the oil-bearing change of the reservoir and can be used to evaluate the reservoir. b)No matter whether the resistivity is high or low, the ratio
of deep and flush zone resistivity is independent of the reservoir resistivity. Therefore, it can be used to evaluate low resistivity oil reservoirs. The practical application shows that the resistivity ratio method is a reliable method to evaluate low resistivity reservoirs, which has good identification effect of oil and water layers. c)There are inconformity in practical application, but most
of them are curve quality problems, which indicates that the stability and measuring accuracy of the flush zone resistivity instrument need to be further improved. It is an important direction to improve the reservoir interpretation coincidence rate by further studying the measurement method of the reservoir flush zone resistivity and true resistivity and improving its accuracy. d)The oil layer evaluation method is also suitable for gas layer identification and has a good effect on low resistivity gas layer evaluation.
References
[1] Clavier, C. Theoretical and experimental bases for the dual-water model for interpretation of shaly sands [J]. Soc. Petr. Eng. J. 1984.24 (2): 153-168.
[2] Hamada, G. M., Alawad, M. Petrophysical Evaluation of Low Resistivity Sandstone Reservoirs [J]. Journal of Canadian Petroleum Technology. 2000. 39 (7).
[3] Myers, R. R., Batcheller, G., Phipps, S. Strategies for unraveling the mystery of low-resistivity pay zones [S]. 2005. SPE98061.
[4] Llamosa, O., Hampton, D., Patiño, C. et al. Recognition and causes of low resistivity pay zones in cretaceous clastic reservoirs: acase study from an oilfield in Northern Llanos Basin, Colombia [S]. 2012. SPWLA 53rd Annual Logging Symposium, At Cartagena, Colombia.
[5] Zhang Chengguang, Mao Zhiqiang, Ou yangjian. The New technique for evaluating water saturation of the "low resistivity" reservoir In J Field [S]. 1994. SPWLA 35th Annual Logging Symposium, 19-22, June, Tulsa, Oklahoma.
[6] Hamada, G. M., Al-Blehed, M. S., Al-Awad, M. N. Determining petrophysical properties of low resistivity reservoirs using nuclear magnetic resonance logs [S]. 1999. SPE Annual Technical Conference and Exhibition, 3-6 October, Houston, Texas.
[7] Koelman, J. M., Fanini, O. N., Kreigshauser, B. F. Enhanced
evaluation of low-resistivity reservoirs using multi-component induction log data [J]. Society of Petrophysicists and Well-Log Analysts. 2001. 42 (6).
[8] Archie G E. The electrical resistivity log as an aid in determining some reservoir characteristics [J]. Tnas Am Inst MechEng, 1942, 146: 54-61.
[9] Poupon A, Loy M E, Tixer M P. A contribution to electric log interpretation in shaly sands [J]. IME, 1954, 201: 138-145. [10] Simandoux P. Dielectric measurements of porous media:
Application to measurement of water saturations, study of the behavior of argillaceous formations [J]. Revue de L, Institut Franais du Petrole, 1963, 18 (S1): 193-215.
[11] Hou Kefeng, Tian Min, Zhang Zhigang, et al. Fast identification method for gas and water layer in Sulige gasfield [J]. Journal of Chongqing University of Science and Technology (Natural Scinece Edition), 2017, 19 (2): 69-74. [12] Zhang Fengsheng, Sui Xiuying, Fang Guoqing. Fast
identification techniques of reservoir and fluid properties in complex fault block with development of thin inter beds [J]. Well Logging Technology, 2018, 42 (2): 156-162.
[13] Tan Tingdong. The log interpretation of the condensate gas reservoir [J]. Natural Gas Industry, 1987, 7 (1): 21-27. [14] Yang Hongming, Xie Li, Ma Jianhai, et al. On identifying low
permeability flood reservoir with ratio of laterolog to induction resistivity [J]. Well Logging Technology, 2005, 29 (1): 51-53. [15] Li Changxi, Shi Yujiang, Zhou Cancan, et al. Evaluation of low
amplitude and low resistivity pay zones under the fresh drilling mud invasion condition [J]. Petroleum Exploration and Development, 2010, 37 (6): 696-702.
[16] Deng Shaogui, Sun Qingtao, Li Hu, et al. The sensitivity of the array resistivity log to mud filtrate invasion and its primary five-parameter inversion for improved oil water recognition [J]. Petroleum Science, 2012, 9 (6): 295-302.
[17] Huang Ruokun, Qi tingting, Zhang Zhigang, et al. The application of identification method of asphalt sandstone reservoir liquid to the exploration of Tazhong Silurian [J]. Chinese Journal of Engineer Geophysics, 2017, 14 (1): 116-122.
[18] Cheng Xi, Hui Chen, Lu Yunfeng, et al. Fluid evaluation technology for reservoirs controlled by structure and lithology: Taking CHN oilfield in Ordos Basin as an example [J]. Journal of Xi'an Shiyou University (Natural Science Edition), 2017, 32 (6): 29-43.
[19] Dong Hong. Application of array induction logging data based on mud invasion dynamic model inidentification of reservoir fluid [J]. Journal of Yangtze University (Natural Scinece Edition), 2018, 15 (19): 31-36.