Vol. 5, No. 4, 2013 Article ID IJIM-00350, 9 pages Research Article
Groups performance ranking based on inefficiency sharing
M. Momeni ∗, G. R. Jahanshahloo † , M. Rostamy Malkhalieh ‡, S. Razavi § , K. Yakideh ¶∥
————————————————————————————————–
Abstract
In the real world there are groups which composed of independent units. The conventional data envelopment analysis(DEA) model treats groups as units, ignoring the operation of individual units within each group.The current paper, investigates parallel system network approach proposed by Kao and modifies it. As modified Kao’ model is more eligible to recognize efficient groups, a new ranking method is proposed based on a model which calculates efficiencies with additional constraint that made model share constant inefficiency among groups.To show advantages, modifies model is applied to efficiency calculation of both artificial and real groups and results is compared with conventional DEA model and parallel system network model as well.Finally it is shown by tow numerical and empirical examples that efficient groups recognized by modified model how can be ranked according to proposed ranking model.
Keywords: Data Envelopment Analysis; Group Ranking; Network DEA; Parallel Systems Efficiency; Efficient Groups.
—————————————————————————————————–
1
Introduction
T
eefficiency of a set of competitive systems orchnique widely applied to measure relative decision making units (DMUs) which utilize same inputs to produce same outputs is data envelop-ment analysis (DEA). Suppose there arenDMUs,∗Department of Industrial Management, University of Tehran, Iran.
†Faculty of Mathematical Science and Computer Engi-neering, University for Teacher Education, Iran.
‡Department of Mathematics, Science and Research Branch, Islamic Azad University, Tehran, Iran.
§Department of Industrial Management, University of Tehran, Iran.
¶Corresponding author. [email protected]
∥Department of Industrial Management, University of Tehran,Iran.
the j th DMU utilize m inputsXij, i= 1, . . . , m to produce s outputs Yrj, r = 1, . . . , s. This means inputs and outputs of each DMU can be expressed by two vector of X And Y. A pair of such vectors (X, Y)that can be consid-ered as a point in (m+s) dimensional linear vec-tor space,is called an activity. Data envelopment analysis essentially is based on comparison within set of feasible activities. Set of feasible activities that is called production possibility set (PPS) can be postulated as follows [3]
1. The observed activities belong to PPS. (ob-servation inclusion assumption)
2. If the activity (X, Y)belong to PPS then ac-tivity (λX, λY) belong to PPS. (constant re-turn to scale assumption)
3. For an activity (( X, Y) in PPS, any activity ¯
X,Y¯) with ¯Y ≤Y and ¯X≥X is included in PPS.(plausibility assumption)
4. Any linear combination of activities in PPS belong to PPS. (convexity assumption)
PPS can be defined satisfying above assumption by
P P S=
{
(X, Y)...X≥ m
∑
i=1
λjXij, Y ≤ s
∑
r=1
λjYrj
}
(1.1) Calculating efficiency of under evaluation group theoretically is equivalent to solving fol-lowing program [3]
Maxθk=
∑s
r=1urYrk
∑m
i=1viXik
(1.2)
∑s
r=1urYrj ∑m
i=mviXij ≤
1 ur, vi≥0
this model can be interpreted as a mechanism to find most favorable weights ur and vi to be ap-plied to ther th output andith input for under evaluation DMU. Note that objective function in above model is associated with one DMU and for calculating efficiency of each DMU model have to be run repeatedly.Possibility of improving can be investigated in aspects of reducing inputs and increasing outputs, separately according to input oriented and output oriented models respectively. A linear form of above model called CCR input oriented model can be presented as follows [3]
Maxθk = s
∑
r=1
urYrk (1.3)
m
∑
i=1
viXik = 1
s
∑
r=1
urYrj− m
∑
i=m
viXij ≤0
ur, vi≥0
Conventional DEA model consider DMUs as a whole when measuring efficiency and conse-quently ignores internal structure of those. Such approach to efficiency calculation has been crit-icized from view point of weakness in recogniz-ing origins of inefficiency within DMU. Fare and grosskopf [4], Fare and et al [5], Lewis and Setxon [8], Prieto and Zoflo [9], Tone and Tsutsui [10] Kao [7] [6] attempt to take into consideration the internal structure of a whole system. This ap-proach widely is called network DEA.
In real world there are cases that a DMU es-sentially is group of units. A typical example is a firm with several plants or a bank with many branches that each of them operates indepen-dently. Castelli et al [1] Cook and Green [2] de-fined this problem as an hierarchical structure. kao [7] especially concentrated on this case and presented a network DEA model for parallel sys-tems. The structure of this paper is organized as follows. In the next Section parallel system net-work DEA proposed by Kao is investigated. In Section 3 modified version of model is proposed that is aimed to be more consistent with initial idea of DEA model. As modified model is more eligible to recognize groups efficient, a new rank-ing method based on calculatrank-ing efficiency along with sharing inefficiency among groups is pro-posed in Section 4. In Section 5 for the purpose of comparing, efficiency scores calculated from conventional DEA model, parallel network DEA model, modified model are presented for two nu-merical examples. It is shown efficient groups how can be ranked according to proposed ranking method. Finally section 6 is allocated to conclu-sion.
2
Parallel system network DEA
Assumingn groups each of their inputs and out-puts is the sum of all its units, Kao [7] presents general case of parallel system as a network. In this framework it is supposed each unit p = 1, . . . , qk belong to k th group converts inputs xpik, i = 1, . . . , m into outputs yprk, r = 1, . . . , s
independently, and sum of all inputs overpunits
∑qk
p=1x
p
ik and all outputs over p units
∑qk
p=1y
are the inputXikand outputYrkofkth group re-spectively. First of all kao [7] suggests to measure efficiency from the view point of inefficiency since as a matter of fact inefficiency is a compliment of efficiency. According to model 1.3 efficiency of
k th group is equivalent toM ax∑sr=1urYrk and can be measured byM in1−∑sr=1urYrk which is equal to slackSk in following program.
Maxθk= s
∑
r=1
urYrk (2.4)
(1) m
∑
i=1
viXik = 1
(2) s
∑
r=1
urYrk− m
∑
i=m
viXik+Sk= 0
(3) s
∑
r=1
urYrj − m
∑
i=m
viXij+Sj = 0 j̸=k
ur, vi ≥0
Note that model (1.3) is equivalent to above pro-gram, just the constraint associated with under evaluation group has been written separately and slacks have been added to model. equivalence of
M in1−∑sr=1urYrk to Sk easily can be shown by dividing constraint (2) by∑mi=1viXik that be-comes
1−
∑s
r=1urYrk
∑m
i=1viXik
=Sk (2.5)
Note that according to constraint (1) denomina-tor of above fraction is equal to one thus
1− s
∑
r=1
urYrk=Sk (2.6)
Substituting each input and output of under eval-uation group by sum of those of all its units, kao presents constraint associated withkth group in model (2.4) as follows
s
∑
r=1
ur
∑qk
p=1
yprk
−∑m
i=1
vi
∑qk
p=1
xpik
+Sk= 0
(2.7)
This is equivalent to
qk ∑ p=1 ( s ∑ r=1
uryrkp − m
∑
i=1
vixpik
)
+Sk= 0 (2.8)
Note that phrase in the parentheses represents transformation mechanism of p th unit. Kao de-notes the slack associated with p th unit spk and supposes the total slack of group Skcan be allo-cated to its qk units as follows
Sk= qk
∑
p=1
spk (2.9)
Thus last equation becomes
qk ∑ p=1 ( s ∑ r=1
uryprk− m
∑
i=1
vixpik+spk
)
= 0 (2.10)
Since each quantity in the parentheses is equal to zero kao derives a set of qk constraints.
s
∑
r=1
uryrkp − m
∑
i=1
vixpik+spk = 0 p= 1,· · ·, qk
(2.11) By the same token the constraints associated with each group rather than kth group is replaced by corresponding to its qj units, consequently fol-lowing program can be applied to measure ineffi-ciency ofkth group and its qk units.
Min qk
∑
p=1
spk (2.12)
m
∑
i=1
viXik= 1
s
∑
r=1
uryrkp − m
∑
i=1
vixpik+spk= 0
s
∑
r=1
uryrjp − m
∑
i=1
vixpij+s p
j = 0j̸=k
3
Modified model
In Kao’s model summation of constraints corre-sponding to each group is equivalent to constraint associated to that, thus model implies group con-straints. But in conventional DEA model each constraint is associated with one of an observed activities that based on observation inclusion as-sumption is a member of PPS. Substitution of constraints in this manner lets comparison be ac-complished in PPS, constructed by units instead of by groups. As a matter of fact from interpreta-tion viewpoint kao’s model can be criticized argu-ing that the model reduce aim of evaluation that is comparison among groups to compare units.
Computational consequence of kao’s model is weight allocation so that fraction of weighted out-puts and inout-puts for each unit can’t exceed one. Considering aim of evaluation that is compari-son among groups not units constraints associ-ated with units at least for them that don’t belong to under evaluation group are not required at all. As an explanation note that DEA model is aimed to find most favorable weights in calculating effi-ciency of under evaluation DMU, considered here as a group and value corresponding to fraction of weighted outputs and inputs for units not be-long to under evaluation group doesn’t mean ef-ficiency. Unfortunately hierarchical DEA model of Cook and Green [2] can be criticized in the same way. By replacing initial constraints cor-responding to not under evaluation groups in-stead of those associated with units that belong them,Kao’s model can be modified as follows
Min qk
∑
p=1
spk (3.13)
m
∑
i=1
viXik= 1
s
∑
r=1
uryrkp − m
∑
i=1
vixpik+spk= 0 p= 1,· · ·, qk
s
∑
r=1
urYrj− m
∑
i=m
viXij ≤0 j̸=k
ur, vi≥0
Constraints in above modified model are weaker than those Kao’s model, consequently efficiency scores will be larger than those in Kao’s model. Therefore modified model is more eligible to rec-ognize some of groups as efficient groups. Logi-cally a ranking method can be assessed useful.
4
Proposed ranking method
It has been shown previously that inefficiency of under evaluation group in equivalent to slack Sk of constraint (3) in model (2.4). By dividing con-straint (3) that is associated with other groups in that model by ∑mi=1viXij inefficiencies of not under evaluation groups are calculated as follows
1−
∑s
r=1urYrj
∑m
i=mviXij
= ∑mSj i=mviXij
(4.14)
Supposing summation of whole inefficiencies for all of groups be equal to one results in
n
∑
j=1 j̸=k
Sj
∑m
i=mviXij
+Sk= 1 (4.15)
Adding up above constraint to model leads to non-linearity, thus following change of variable is applied.
m
∑
i=m
viXij = 1
tj
(4.16)
Inequality of tj to zero will be discussed later. Applying above change of variable is required thus
n
∑
j=1 j̸=k
tjSj+Sk= 1 (4.17)
But there exist ∑mi=mviXij in constraints asso-ciated with not under evaluation groups and ap-plying above change of variable results in
s
∑
r=1
Thus adding up new constraint converts model (2.4) into following nonlinear program.
Maxθk = s
∑
r=1
urYrk (4.19)
(1) m
∑
i=1
viXik = 1
(2) s
∑
r=1
urYrk− m
∑
i=m
viXik+Sk= 0
(3) s
∑
r=1
urtjYrj+tjSj = 1 j̸=k
(4) n
∑
j=1 j̸=k
tjSj+Sk= 1
ur, vi≥0
Note that discussed change of variable has been applied in constraint (3). Now it is required to assure tj ̸= 0. Suppose tj = 0 thus left side of constraint (3) in above model becomes equal to zero while right side is equal to one and this is a contradiction thus tj = 0 is impossible. Setting tjSj = ´Sj and urtj = urj above program con-verts into linear program but as can be considered model lets independent outputs weights alloca-tion for all groups except under evaluaalloca-tion group. Such weight allocation as permits each group be-ing evaluated accordbe-ing to its own output weights can be pointed as weakness of model mathemat-ically, however from computational view point it doesn’t matter, as constraint added to model re-strict power choice of model in weights allocation strongly.
As mentioned above output weights ur that is remained in constraint associated withkth group is not independent ofurj that exists in other con-straints.To make it independenturcan be substi-tuted byurkthat is assumed equal tourtk but in spite oftj inequality to zero fortk is not required necessarily. Applying above changes model (4.19)
converts into following program.
Maxθk= s
∑
r=1
urkYrk (4.20)
m
∑
i=1
viXik= 1
s
∑
r=1
urkYrk− m
∑
i=m
viXik+Sk = 0
s
∑
r=1
urjYrj+ ´Sj = 1 j ̸=k
n
∑
j=1 j̸=k
´
Sj+Sk= 1
ur, vi ≥0
By the same token in modified Kao’s model above program converts into following form
Min qk
∑
p=1
spk (4.21)
(1) m
∑
i=1
viXik = 1
(2) s
∑
r=1
urkyprk− m
∑
i=1
vixpik+spk= 0
(3) s
∑
r=1
urjYrj+ ´Sj = 1 j̸=k
(4) n
∑
j=1 j̸=k
´
Sj+ qk
∑
p=1
spk = 1
ur, vi ≥0
Note that∑qk
p=1s
p
k =Skis considered in last con-straint of model. Above model is able to calculate efficiency scores for groups provided that sum-mation of group inefficiencies was assumed to be equal to one. Following theorems clarify proper-ties of this model.
Table 1: Efficiency results of assumed Groups
groups Conventional model Kao’s model modified model
s1 0.98 0.74 0.84
s2 0.85 0.62 0.81
s3 1 0.75 0.90
s4 1 0.78 0.78
s5 0.93 0.64 0.71
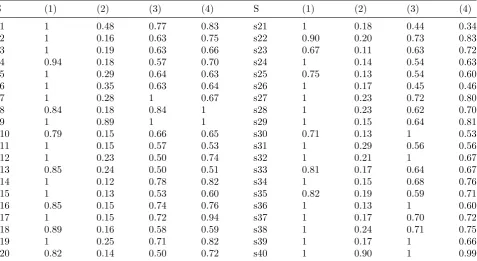
Table 2: Efficiency results of MELLAT BANK supervisory sections
S (1) (2) (3) (4) S (1) (2) (3) (4) s1 1 0.48 0.77 0.83 s21 1 0.18 0.44 0.34 s2 1 0.16 0.63 0.75 s22 0.90 0.20 0.73 0.83 s3 1 0.19 0.63 0.66 s23 0.67 0.11 0.63 0.72 s4 0.94 0.18 0.57 0.70 s24 1 0.14 0.54 0.63 s5 1 0.29 0.64 0.63 s25 0.75 0.13 0.54 0.60 s6 1 0.35 0.63 0.64 s26 1 0.17 0.45 0.46 s7 1 0.28 1 0.67 s27 1 0.23 0.72 0.80 s8 0.84 0.18 0.84 1 s28 1 0.23 0.62 0.70 s9 1 0.89 1 1 s29 1 0.15 0.64 0.81 s10 0.79 0.15 0.66 0.65 s30 0.71 0.13 1 0.53 s11 1 0.15 0.57 0.53 s31 1 0.29 0.56 0.56 s12 1 0.23 0.50 0.74 s32 1 0.21 1 0.67 s13 0.85 0.24 0.50 0.51 s33 0.81 0.17 0.64 0.67 s14 1 0.12 0.78 0.82 s34 1 0.15 0.68 0.76 s15 1 0.13 0.53 0.60 s35 0.82 0.19 0.59 0.71 s16 0.85 0.15 0.74 0.76 s36 1 0.13 1 0.60 s17 1 0.15 0.72 0.94 s37 1 0.17 0.70 0.72 s18 0.89 0.16 0.58 0.59 s38 1 0.24 0.71 0.75 s19 1 0.25 0.71 0.82 s39 1 0.17 1 0.66 s20 0.82 0.14 0.50 0.72 s40 1 0.90 1 0.99
It is enough to present a feasible solution. It is shown that following solution is feasible.
vi
i̸=1 = 0, v1 = 1
X1k
, urk= 0 urj
j̸=1 = 0, u1j = 1
Y1j
X1kandY1j represent any nonzero input and out-put of under evaluation group respectively and subscripts 1 for input and output are indepen-dent of each other. Above solution satisfies con-straint(1)and setting in constraints (2) and (3) leads to following results:
spk= x p ik Xik
p= 1, ..., qk
´
Sj = 0 j = 1, ..., n
Consequently solution satisfies last constraint of model.
Theorem 4.2 Objective function value is equal to or less than one.
Feasible solution presented in last theorem leads to objective function value equal to one consid-ering the direction of objective function that is minimazing theorem is proved.
Theorem 4.3 Efficiency attributed tojth group by model used for calculating efficiency of k th groups is equal to or less than one.
is resulted.
s
∑
r=1
urjYrj ≤1 (4.22)
According to definition, efficiency of j th group can be presented as follows
θj =
∑s
r=1urYrj
∑m i=1viXij
(4.23)
By changing of variable as mentioned in equation (4.16) efficiency of j th group becomes
θj = s
∑
r=1
urtjYrj (4.24)
Note that urtj = urjis assumed, thus according to inequality (4.22) theorem is proved.
5
Numerical examples
First of all modified model is examined by ap-plying to calculate efficiencies of some assumed groups and comparing results with efficiency cal-culated from conventional and kao ’s model. As-sumed groups constructed with data presented in DEA example of GAMS library to be accessible for viewers. Data table in that example consists of twenty units, two inputs and three outputs. Units for the purpose of group’s efficiencies eval-uation are allocated to five groups according to following pattern. Units’ 1-4, 5-8, 9-11, 12-16, 17-20 is assumed that belong to group 1-5 respec-tively. Table1 presents the results
Data associated with forty supervisory sections of MELLAT bank in Iran as real example is applied to show differences among conventional DEA, Kao’s model, modified Kao’s model results. Proposed ranking model is applied to rank effi-cient groups recognized by modified parallel sys-tem network model as well. Each supervisory section consists of several branches which work around country. Evaluation criteria consist of three inputs included Personnel cost, Cash Divi-dends Payable, Balance of facilities and four out-puts included Deposits, Facilities and two kind of incomes. Results are stated in Table 2according to following pattern, the columns (1),(2),(3),(4)
represent efficiencies calculated from conventional DEA model, parallel network DEA model, mod-ified parallel network DEA and proposed rank-ing model respectively. As can be seen efficiency scores calculated from modified model is larger than those calculated from kao’s model, in addi-tion 6 supervisory secaddi-tions recognized efficient by modified model while according to Kao’s model there isn’t any efficient supervisory sections. As an explanation it can be point out that in mod-ified model all units belong to under evaluation groups attend to be representatives of their group but in spite of initial version other groups are not represented by all their units. Hence under evalu-ation group has more opportunity to be evaluated optimistically.
Table3 summarizes efficiencies and ranks cal-culated from proposed ranking model for effi-cient supervisory sections recognized by modified model.
6
Conclusion
Table 3: Ranking results
Supervisory s7 s9 s30 s32 s36 s39 s40 Efficiency 0.67 1 0.53 0.67 0.60 0.66 0.99 Rank 3or4 1 7 3or4 6 5 2
units, while in initial version all units represent their groups and are compared with each other. In other words modified model permits just un-der evaluation group to be represented by all of its units, but initial version gives this opportunity to all groups. Consequently Constraints of modi-fied model are stronger than those of conventional DEA model but they are weaker than Kao’s par-allel model; therefore the efficiency scores calcu-lated from modified model are smaller than those calculated from conventional model but larger than those calculated from Kao’s model. Thus modified model can be asses as a more consis-tent model with optimistic property of DEA. As modified model calculated larger efficiency scores, it is more eligible to recognize some groups as efficient groups.Therefore a ranking method was proposed based on new concept of sharing whole inefficiency.
References
[1] L. Castelli, R. Pesenti, W.Ukovich, DEA-like models for the efficiency evaluation of hierar-chically structured units, European Journal of Operational Research 154 (2004) 465-476.
[2] W. D. Cook, R. H. Green, Evaluating power plant efficiency: A hierarchical model, Com-puters & Operations Research 32 (2005) 813-823.
[3] W. W. Cooper, L. M. Seiford, K. Tone,Data envelopment analysis: A Comprehensive Text with Models, Applications, References and DEA-Solver Software, Springer (2006).
[4] R. F¨are, S. Grosskopf, Network DEA, Socio-Economic Planning Sciences 34 (2000) 35-49.
[5] R. F¨are, S. Grosskopf, G. Whittaker,Network DEA, Modeling data irregularities and
struc-tural complexities in data envelopment anal-ysis (2007) 209-240.
[6] C. Kao, Efficiency decomposition in net-work data envelopment analysis: A relational model, European Journal of Operational Re-search 192 (2009) 949-962.
[7] C. Kao, Efficiency measurement for parallel production systems, European Journal of Op-erational Research 196 (2009) 1107-1112.
[8] H. F. Lewis, T. R. Sexton,Network DEA: Ef-ficiency analysis of organizations with com-plex internal structure, Computers & Opera-tions Research 31 (2004) 1365-1410.
[9] A. M. Prieto, J. L. Zof´ıo, Network DEA effi-ciency in input-output models with an appli-cation to OECD countries, European Journal of Operational Research 178 (2007) 292-304.
[10] K. Tone, M. Tsutsui, Network DEA: a slacks-based measure approach, European Journal of Operational Research 197 (2009) 243-252.
Gholam Reza Jahanshahloo has got PhD degree from University of West London in 1976 and now he is the full professor in University of Tarbiat Moallem, Iran. Now, he is working in in Science and Research Branch, Azad University, Iran as well. Main research interest includes Operation research and Data envelopment analysis.
Mohsen Rostamy Malkhalieh has got PhD degree from University of Tarbiat Moallem in 2009 and now he is the assistant professor in Science and Research Branch, Azad University, Iran. Now, he is working on Operation research and Data envelopment analysis.
Seiedmostafa Razavi has got PhD degree from University of Tehran in 2005 and now he is the asso-ciate professor in department of in-dustrial management,University of Tehran, Iran. Now, he is working entrepreneurship, strategic plan-ning and quantitative methods.