Volume 58, 2019, Pages 310–316
Proceedings of 34th International Confer-ence on Computers and Their Applications
Predicting Cow’s Delivery Using
Movement and Position Data Based on Machine Learning
Yusuke Ono, Ryo Hatano, Hayato Ohwada and Hiroyuki Nishiyama
Department of Industrial Administration, Tokyo University of Science
Abstract
One of the major problem farmers face is that of a parturition accident. A parturition accident result in the death of the calf when the cow gives birth. In addition, it reduces the milk yield. The farmer must keep the cow under close observation for the last few days of pregnancy.
A novel method to predict a cow’s delivery time automatically using time-series accel-eration data and global position data by machine learning is proposed. The required data was collected by a small sensor device attached to the cow’s collar. An inductive logic programming (ILP) method was employed for a machine learning model as it can generate readable results in terms of a formula for first-order logic (FOL). To apply the machine learning technique, the collected data was converted to a logical form that includes prede-fined predicates of FOL. Using the obtained results, one can classify whether the cows are ready for delivery.
Data was collected from 31 cows at the NAMIKI Dairy Farm Co. Ltd. Using the method described above, 130 readings were obtained. The five-fold cross-validation process verified the accuracy of the model at 56.79%.
1
Background
A parturition accident of a cow is known as a serious problem for farmers. It is important for farmers to have a cow giving birth to a live calf. However, when she gives birth to a calf, and a parturition accident occurs, which could lead to the death of both the calf and the cow. Furthermore, this could result in a reduction in the milk yield. Therefore, a parturition accident can cause heavy losses for farmers and they need to avoid such accidents as much as possible.
To overcome this issue, we aim to detect the cows’ delivery time automatically using ma-chine learning. A sensor device is attached to the cow’s collar, and it collects the time-series acceleration data and global position data. A set of readable rules that can predict the delivery of a cow is generated using the inductive logic programming (ILP) method, which is logic-based supervised machine learning. As ILP rules can be regarded as a set of formulas of the first-order logic (FOL), the status of a cow about to give birth can be predicted accurately through this method. It contributes to improving production efficiency and leads to a decrease in the farmers’ work burden.
2
Related Works
Till date, relatively less studies have been conducted in applications of machine learning of dairy farming. Caraviello et al. [1] predicted whether a cow’s insemination will succeed using the Alternating Decision Tree (ADTree) [2] in 2006. They used 300 or more features collected from cows that had been milked for a 150 days1. The accuracy of their model was verified using the ten-fold cross validation method and was observed to be 75% accurate. Mammadova and Keskin [4] predicted mastitis in cows using support vector machine (SVM) in 2013. They employed the cow’s milk yield and status of the cow’s breast as parameters for readings. 2 The
sensitivity and the specificity of their model was 89% and 92%, respectively. Grzesiak et al. [3] predicted cow’s milk yield using an artificial neural network in 2006.
In their study, the proposed method showed a lower root mean square (RMS) and a higher coefficient of determination than the existing studies. Similarly, Saleh et al. [7] predicted the cows’ reproductive value in 2012. They observed a correlation between milk yield, fat mass, and reproductive value using artificial neural network and neurofuzzy learning [6] and that value exceeded 0.9.
3
The Method for Predicting a Cow’s Delivery
In this study, data was collected from a sensor device and the cow’s delivery time was predicted by (supervised) machine learning. The method is given as follows: Raw data was collected from small sensor devices attached to the collars of a group of cows. The data was processed to identify the features and label them for binary classification. The cow reaching delivery stage within a preordained time period was classified as positive class whereas one that did not reach the delivery stage in the given time, was classified as negative class. Finally, the ILP model was used to verify the accuracy of the results. As ILP generates a set of readable rules in terms of FOL formulas as a model, convenient rules that can predict the delivery of a cow can be generated.
3.1
Specification of The Sensor Device
To obtain a model for predicting the delivery, raw sensor data was collected using an appro-priate sensor device. In this study, the time-series three-dimensional acceleration data and global positioning data was used to construct the raw data set. To collect such data, the device ”LL1000” by Life Laboratory Co., Ltd. was used (Figure 1). As the size of the device is 30
1In total, they used 17,587 results from 9,516 cows.
mm×60 mm ×10 mm, it was small enough to attach to the cow’s collar. The device mea-sures acceleration, atmospheric pressure, temperature of the environment, and global position approximately three times per second and transfers the readings to other devices via Bluetooth. The transferred data is stored in a comma separated file (CSV file) on our computer. Figure2 shows an example of the CSV file where columns give values for RSSI, ID, and thex,y, andz
axes represent the signal strength, sensor’s ID number, and the acceleration, respectively.
Figure 1: Sensor device LL1000
Figure 2: Example of a CSV File of raw sensor data
3.2
Making Features
In this study, six types of features were obtained from the raw sensor data. Table 1, shows the features used in this method. From the acceleration data for each x, y, and z-axis, the
norm was calculated for each axis (i.e. qa2
x+a2y+a2z). When the sensor leans or tips over, the direction in which gravitational acceleration is applied changes. We use the sum of squares and prevent noise. The average and standard deviation was calculated based on the divided time-series acceleration data. The time-series data was divided into 10-min and 1-h intervals, respectively, in this study. Cows do not make intense movements in a short time. Therefore, it is too short to divide in 1-minute or shorter increments. The travel distance (Euclidean distance) was obtained from the global positioning data, at intervals of 10 min and 1 h. That is, given a current timet and a latitudelat and a longitude lon in a global positioning data, we define the travel distance by:
p
It should be noted thatt−1 is 10 min or 1 h before the current time. The total travel distance is the sum of accumulated distance in the raw data.
Table 1: Types of features
Acceleration Average 10 min 1 h
Standard Deviation 10 min 1 h
Total Travel Distance 10 min 1 h
3.3
Labeling of Features
As mentioned before, features obtained from the raw sensor data were separated into the positive and the negative class, based on a predetermined time valuen. To the best of our knowledge, the time taken by a farmer to prepare for the delivery of a cow is approximately 2 h. In this study, the time is represented as,n= 2, but this parameter will be more precisely determined in further studies.
3.4
Inductive Logic Programming
ILP is one of the machine learning approaches for developing inductive reasoning on first order predicate logic3. In this method, predicate logic is used to resolve classification problems [8]. Under the ILP approach, FOL can be used as a knowledge expression language to treat the relationship between individuals. Hence, multiple time-series data and mixed qualitative data is presented as the discrete expression of background knowledge.
Inductive reasoning is the inference which can ask for a generalized hypothesis from some specialized cases. Hence, an algorithm that can find relational and logical patterns between data (i.e. FOL-formulas) using inductive reasoning, corresponds to a learning or training algorithm of a model where the obtained model (so called rules) is written in terms of a set of FOL-formulas that may contain a generalized hypothesis4. We emphasize that the model is easy to understand
for most people since it is written in terms of FOL formulas. As in a usual supervised machine learning model, the obtained model can be used to solve various classification problems.
3.4.1 Features in Logical Form
In order to apply the ILP approach, it is necessary to convert the data generated in the exper-iment, to a logical form. Thus, we need to convert the six features mentioned in Section3.2in the form of FOL-formulas. In this study, we define the following 8 predicates.
1. moveave600(Time,Level1-8)
Average of acceleration at 10-min intervals.
2. moveave3600(Time,Level1-8)
Average of acceleration at 1-h intervals.
3It is known that ILP covers not only FOL but also other types of logic. Propositional logic is another example, as a model of decision tree can be regarded as a formula of ILP.
3. movevar600(Time,Level1-7)
Standard deviation of acceleration at 10-min intervals.
4. movevar3600(Time,Level1-7)
Standard deviation of acceleration at 1-h intervals.
5. positionChange600(Time,Level1-7)
Total travel distance of acceleration at 10-min intervals.
6. positionChange3600(Time,Level1-7)
Total travel distance of acceleration at 1-h intervals.
7. beforeState(Time1,Time2)
Time1 and Time2 are consecutive times.
8. sameTimeZoneState(Time1,Time2)
10-min of Time1 are included in 1-h of Time2.
Level1-8 (or 7) represents the magnitude of the value. Since ILP cannot handle continuous values directly, we divided them into several ranks according to the magnitude of the value and converted them to predicates. Intuitively, the larger the value of Level, the larger the actual value. Note that we distribute Levels not by an absolute value but a deviation value. For example, if a deviation value of acceleration is greater than or equal to 45 and less than 50, it is classified as Level 4.
4
Experiment
4.1
Outline of our Experiment
In this study, we collected raw sensor data from 31 cows in NAMIKI Dairy Farm Co. Ltd. The data was collected for approximately two months (February 2, 2018 to April 30, 2018), continuously for 24 h and stored in CSV files. The data from these files was used to calculate the features shown in Section3.2. The number of positive and negative cases were 435 and 4836, respectively. Using ILP, we created a training model and verified its accuracy. In addition, we examined the obtained rules to determine the rules that would predict the cow’s delivery.
4.2
Result of Cross-validation
In this study, we conducted a five-fold cross-validation to verify the accuracy of our model. Five-fold cross-validation is a method for verifying and confirming the validity of the analysis. First, we divide the features into five subsets and one was used for testing and the others for training. Then, this procedure is repeated five times with multiple subsets for testing. Finally, we calculate the average of the five results to verify the accuracy of our model. Table2shows our result. It is very useful to be able to classify the delivery of cows with an accuracy of 56It is more effective than human prediction.
4.3
Obtained Rules
Table 2: Evaluation Indicator Accuracy 56.79% Precision 9.6%
Recall 50.46% F Value 16.13%
the table shows that when it is transitioning from the state, the average of acceleration is Level 4 and the standard deviation of acceleration is Level 2. For state B, the average of acceleration is Level 4 and the standard deviation of acceleration is Level 1, demonstrating that cows may deliver. According to the above rules, we can predict delivery of cows. In contrast to the ordinary machine learning model, our model explains the rules that can predict cow’s delivery directly. It is considered that only more reasonable rules can be obtained by changing learning parameters.
Table 3: Generated Rules Included Pos. Cases Included Neg. Cases The Rule
10 34 moveave600(A, Level4) ∧
move-var600(A, Level1) ∧ beforeState(A, B) ∧ moveave600(B, Level4) ∧ movevar600(B, Level2)
10 14 movevar600(A, Level1) ∧
sameTimeZon-eState(A, B) ∧ moveave3600(B, Level5) ∧ movevar3600(B, Level1) ∧ position-Change3600(B, Level2)
14 29 sameTimeZoneState(A, B) ∧
moveave3600(B, Level5) ∧ move-var3600(B, Level1) ∧ position-Change3600(B, Level2)
11 49 moveave600(A, Level3) ∧ beforeState(A,
B) ∧ sameTimeZoneState(A, C) ∧ moveave3600(C, Level3)∧ moveave600(B, Level4)
11 49 beforeState(A, B) ∧
sameTimeZoneS-tate(A, C) ∧ moveave3600(C, Level3) ∧ moveave600(B, Level4) ∧ moveave600(A, Level3)
12 35 movevar600(A, Level2) ∧
sameTimeZon-eState(A, B)∧moveave3600(B, Level2)∧ positionChange3600(B, Level1)
..
. ... ...
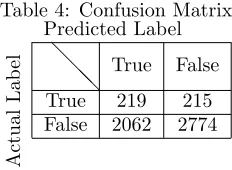
if the actual label is true but predicted label by ILP is false, it is indicated in the lower left element of the table.
Table 4: Confusion Matrix Predicted Label
Actual
Lab
el @ @
@
True False
True 219 215
False 2062 2774
However, as the accuracy is still low, we will improve the classification accuracy by adding new features and introduce applicable predicates using other machine learning methods in further studies.
5
Conclusion and Future Works
Our aim was to detect the cows’ delivery time automatically with the use of machine learning. We collected raw sensor data from 31 cows, made features and labeled them for binary classi-fication. Finally, we trained a model by ILP and verified the accuracy of the model. We also generated a set of readable rules that could predict the delivery of a cow. The resultant accuracy was 56.79% and we obtained 130 rules. In future studies, we plan on improving the accuracy by creating new features, introducing new predicates, and using other machine learning methods.
References
[1] DZ Caraviello, KA Weigel, M Craven, D Gianola, NB Cook, KV Nordlund, PM Fricke, and MC Wiltbank. Analysis of reproductive performance of lactating cows on large dairy farms us-ing machine learnus-ing algorithms. Journal of dairy science, 89(12):4703–4722, 2006.
[2] Yoav Freund and Llew Mason. The alternating decision tree learning algorithm. Inicml, volume 99, pages 124–133, 1999.
[3] Wilhelm Grzesiak, Piotr B laszczyk, and Ren´e Lacroix. Methods of predicting milk yield in dairy cows—predictive capabilities of wood’s lactation curve and artificial neural networks (anns). Com-puters and electronics in agriculture, 54(2):69–83, 2006.
[4] Nazira Mammadova and ˙Ismail Keskin. Application of the support vector machine to predict subclinical mastitis in dairy cattle. The Scientific World Journal, 2013.
[5] Stephen Muggleton and Luc De Raedt. Inductive logic programming: Theory and methods. The Journal of Logic Programming, 19:629–679, 1994.
[6] Oliver Nelles, Alexander Fink, and Rolf Isermann. Local linear model trees (lolimot) toolbox for nonlinear system identification. IFAC Proceedings Volumes, 33(15):845–850, 2000.
[7] Saleh Shahinfar, Hassan Mehrabani-Yeganeh, Caro Lucas, Ahmad Kalhor, Majid Kazemian, and Kent A Weigel. Prediction of breeding values for dairy cattle using artificial neural networks and neuro-fuzzy systems. Computational and mathematical methods in medicine, 2012.