Vol. 11, No. 4, 2019 Article ID IJIM-1072, 12 pages Research Article
Estimating Capacity Utilization in Two-Stage Production Systems: A
Data Envelopment Analysis Approach
L. Zeinalzadeh Ahranjani ∗, R. Kazemi Matin †‡, AR. Amirteimoori §
Received Date: 2017-05-09 Revised Date: 2018-04-19 Accepted Date: 2018-05-18
————————————————————————————————–
Abstract
The current study investigates performance in two-stage production systems through the measurement of capacity utilization (CU). In short-run, the degree of capacity utilization depends on the ability of decision making units to utilize fixed production factors. To develop this indicator in two-stage production processes, these factors are classified into fixed and variable inputs. Then the modified SBM network DEA model is proposed to estimate the capacity utilization and further study the effect of intermediate products on CU. Ultimately the numerical example is presented to point out the applicability and effectiveness of current model.
Keywords: Network Data Envelopment Analysis; Capacity Utilization; Intermediate product; Two-stage production system.
—————————————————————————————————–
1
Introduction
D
ative technique to measure the relative per-ta Envelopment Analysis (DEA) is an effec-formance of peer decision making units (DMUs) which use multiple inputs to produce multiple outputs. This non-parametric approach is intro-duced by Charnes et al. [4] for the first time. They developed the Farrell [16] outlook and pro-posed a mathematical programming approach to evaluate the efficiency of any system, such as com-mercial, manufacturing, educational, serving, etc.∗Department of Mathematics, Karaj Branch, Islamic Azad University, Karaj, Iran.
†Corresponding author. [email protected], Tel: +98(263)4418143.
‡Department of Mathematics, Karaj Branch, Islamic Azad University, Karaj, Iran.
§Department of Mathematics, Rasht Branch, Islamic Azad University, Rasht, Iran.
In classical DEA models, DMUs are considered as black-box that transform inputs to outputs. In many situations the production process in each DMU is composed of two or several processes, therefore using these models, internal structures are neglecting. Thus, these models need to be im-proved in order to do the assessment more pre-cisely. Considering internal linking activities of the DMUs, network DEA models have been pro-posed [13]. Unlike the DEA models, network DEA models reflect the internal structure of units in evaluating their performance. In recent years, various models have been extended to assess the efficiency of network production systems. For ex-ample, Kazemi Matin and Azizi [22] introduced a general new model for evaluating the efficiency score of network production processes with ar-bitrary internal structures. Despotis et al. [11] also presented a general network DEA method
to measure the performance of series multi-stage processes. So offering a novel approach based on multi-objective programing, in a very unique and unbiased way attempted to estimate the stage ef-ficiency scores. Kao [19] made a review of stud-ies done on network DEA. He classified network DEA models based on network structures. Ac-cording to Kao article [19], a large number of studies applied on network were based on two-stage processes. The two-two-stage production pro-cesses are the simplest network systems which the outputs of the first stage (intermediate products) are employed as the inputs of the second stage. Seiford and Zhu [30] presented a two-stage net-work structure to examine the profitability and marketability of 55 US commercial banks. Us-ing a traditional DEA model and neglectUs-ing se-rial relationship between the two stages, they ob-tained the efficiency of whole system. Liang et al [26] used game theory concepts and developed the DEA methods to examine the efficiency of two-stage network systems. Their model and Despotis et al. [11]’s approach are recently used by Li et al [24] to generate a Parato solution and identify the leader stage in network DEA. This method indicates that the optimal solution for the Chen et al. proposed model is also a leader-follower solution. Kao and Hwang [20] suggested a dif-ferent method for measuring performance of two-stage processes and defined the overall efficiency of the system as the product of the efficiencies of the two stages. Also, Chen et al. [5] proposed another model to evaluate these systems similar to Kao and Hwang’s, but in an additive format. Their additive model can be used both in con-stant returns to scale (CRS) and variable returns to scale (VRS). Both models ([5, 20]) are based on the reasonable assumption that the weights used for the intermediate products are the same. Despotis et al. [10] argued that the optimal so-lution of additive decomposition approach (Chen et al.’s model [5]) and multiplicative decompo-sition approach (Kao and Hwang’s model [20]), which are the popular models in two-stage net-work DEA for the measuring the overall efficiency and sub-system efficiencies, may be non-unique and biased. So, they offered a novel approach to estimate unique and unbiased efficiency scores for the two stages. Their modeling paradigm is
based on the selection of an output orientation for first stage and an input orientation for the second stage. Guo et al. [17] investigated both the ad-ditive efficiency decomposition in two-stage net-work DEA and the factors influencing the varia-tions in overall efficiency to demonstrate the asso-ciation between variation in the overall efficiency with constant stage efficiencies. They proposed a new of overall efficiency to reflect entirely on the stage efficiencies. Cook et al. [8] reviewed proposed two-stage DEA methods, and showed that all the existing approaches can be classified into four categories: the standard DEA approach, the efficiency decomposition approach, the net-work DEA approach and the game theoretic ap-proach. Kao and Liu [21] extended the two-stage DEA efficiency decomposition method of Kao and Hwang [20] to solve fuzzy two-stage DEA prob-lems. They employed a two-level optimization approach to overcome the problem of intermedi-ate products. Akther et al [1] also investigintermedi-ated the performance of 21 banks in Bangladesh and applied a two-stage network approach to maxi-mize desirable outputs and minimaxi-mize bad outputs. Zhou et al. [37] extended the conventional DEA models on two- stage processes with stochastic data and proposed a stochastic centralized two-stage network DEA model. This technique is used to evaluate the performance of 16 commer-cial banks in China. Unlike researches done in the banking industry, Boloori and Pourmahmoud [2] used a more general method to evaluate this in-dustry and improved it into a more precise struc-ture within three processes in each bank branch. They obtained efficiency targets and developed an envelopment form of the network SBM model. Their introduced model is a developed version of Tone and Tsutsui’s model.
ad-dition to the outputs from the first stage. Liu et al. [27] studied the two-stage processes with un-desirable input-intermediate-outputs. They ap-plied the free-disposal axiom to build production possibility set and the corresponding two-stage network DEA models with undesirable factors. Abundant studies on two-stage production sys-tems indicate that this system possess significant and particular place in analyzing new modelling ideas in network production systems.
The most important topics in the management of science is the determination of the capacity and capacity utilization (CU) in production systems. Capacity is described as the ability of a firm to produce a potential output [33]. There are two measures of capacity: technical and economic. Johansen [18] and Morrison [28] provided capac-ity and CU’s theoretical and economic frame-work. Johansen ([18], p.68) presented the produc-tion funcproduc-tion to define the technical measure of single output capacity as, ” the maximum amount that can be produced per unit of time exiting plant and equipment, provided the availability of variable factors of production is not restricted”. Morrison [28] provided the economic measure of capacity in which the optimal output measure is the tangency between the short-run and long-run average cost curve. The major differentiation be-tween technical and economic measures is that the technical measure of capacity output does not require information regarding input prices. The present study adopts the technical concept of capacity output to estimate the capacity uti-lization. Capacity utilization represents the in-dustry performance indicator to describe the re-lationship between actual output (what is actu-ally produced) and potential output (what could be produce). Generally the capacity utilization refers to proportion of potential capacity which is used and typically estimated as the ratio of ac-tual output to capacity output. In recent years, a number of researches have been focused on Jo-hansen’s definition and used the DEA methodol-ogy to measure capacity output and CU’s man-ufacturing firms. This approach was initially in-troduced by fare [12]. Their presented approach could be considered the weaker version of the Jo-hansen’s because outputs are bounded by fixed inputs of production. Later, this technique was
modified and developed by Fare et.al ([14, 15]). They proposed that an output-oriented measure of technical efficiency could be applied to calcu-late the capacity output and CU. Also, Fare et al. [14] argued that presented measure of CU by Fare et al. [12] may be biased downward. Kirkley and Squires [23] used the offered method by Fare et.al [15] to assess capacity in fisheries. Also, Vester-gaard et al. [33] presented an analysis and esti-mation of capacity and CU in the multi-species Danish gill-net fishery that was based on DEA. To propose a non-radial CU measure, Cooper et al. [9] introduced and expanded SBM model to estimate these concepts. Sahoo and Tone [29] ap-plied the proposed technique by Cooper et al. [9] to study CU in Indian banks. Zhang et al [36] suggested a dynamic SBM-DEA model to intro-duce a dynamic CU measure and estimate the CU of China’s industrial sector. Yu et al [35] also estimated the physical capacity utilization and cost gap between actual and global long-run min-imum costs using an input oriented SBM-DEA model. The main difference between their work and other studies was that they took the situation that firms operate in markets which are not fully competitive into consideration; this more closely maches real life. Their method is illustrated on a real case study of 13 Low-cost carriers around the world for the year 2010. Recently, Yang and Fukuyama [34] developed a novel generalized CU indicator and defined it as the difference between two directional distance functions. Their intro-duced indicator measures the extent to which the current variable inputs are utilized.
All the recent studies have extensively used the single-stage DEA models (traditional models) to estimate capacity utilization (CU) of production systems. In fact, they considered production sys-tems as single stage process (black- box) while we develop this concept in two-stage production sys-tems and investigate effect of intermediate prod-ucts of systems of CU Following a technological notion and developing non-parametric Cooper’s [9] technique.
discussed in Section 4. Finally, conclusions are presented in Section 5.
2
Background
This section is devoted to brief introduction of Tone and Tsutsuis’s model [18] and concepts and models used to estimate CU. It should be noted that there exist two fundamental approaches in DEA to evaluate the performance of DMUs with different characteristics; radial and non-radial. The radial DEA models are based on the propor-tional change of input or output resources and usually ignore the existence of slacks in the effi-ciency scores whereas the non-radial models con-sider the slack of each input or output and the alteration of inputs and outputs are not propor-tional; in other words in non-radial DEA models the input (output) resources allowed the reduc-tion (increase) at different rates. The most fun-damental non-radial model was extended by Tone [31] which called slacks-based measure (SBM). The SBM model directly deals with input excess and output shortfall. In recent years, it has been generally applied to estimate efficiency of produc-tion systems.
2.1 The slacks-based measure model
Consider a set of n DMUs denoted byDM Uj(j=
1,· · ·, n), that consume m inputs to produce s
outputs. The observed input and output vectors ofDM Uj be denoted byXj = (x1j, x2j,· · ·, xmj)
and Yj = (y1j, y2j,· · ·, ysj),respectively. Also, it
is assumed that all inputs and outputs are posi-tive. One of the non-radial DEA model which es-timates the efficiency score of DM Uo,under the
VRS assumption, is the SBM model which was
represented by Tone [31] as follow:
φ∗ = min (1− 1
m
∑m i=1
s−i xio)
(1 + 1s∑sr=1 s+r yro)
(2.1)
s.t n
∑
j=1
λjxij+s−i =xio i= 1, ..., m
n
∑
r=1
λjyrj −s+r =yro r= 1, ..., s
n
∑
j=1
λj = 1
λj ⩾0 j= 1, ..., n
Here λj is the intensity variable, and s+r,(r =
1,2,· · ·, s) and s−i ,(i = 1,2,· · ·, m) denote ex-cesses in input resources and shortfalls in output products, respectively. Note that model (2.1) is a nonlinear program, which can convert into an equivalent linear form [3]. It is significant to note that among input resources for production, some are fixed and unable to change during a produc-tion period e.g., plant and equipment, while some other inputs could be exactly controlled by the manufacturing firms in the short-run; e.g., num-ber of employees, working hours and days. For-mer inputs are called fixed (xF) and later inputs variable (xV). Needless to say that all inputs can be altered in the long-run. According to afore-mentioned subjects, the inputs are classified into
k fixed inputs that cannot alter in short-run and (m−k) variable inputs. The output-oriented of the above SBM model (SBM-O) is presented as follows:
φ∗o = max
(
1 +1
s s
∑
r=1
s+r yro
)
(2.2)
s.t n
∑
j=1
λjxFij ⩽xFio, i= 1, ..., k
n
∑
j=1
λjxVij ⩽xVio, i=k+ 1, ..., m
s
∑
r=1
λjyrj−s+r =yro, r= 1, ..., s
n
∑
j=1
λj = 1
The standard SBM models is applicable for man-ufacturing systems as black boxes where some in-puts are used to produce some outin-puts. Hence, they are not useful to measure the performance of two-stage production processes due to overes-timating the overall efficiency scores, [32].
2.2 Two-stage production systems
Consider a basic two-stage structure as shown in Fig. 1. In this structure all outputs from the first stage are seen as intermediate products which constitute the inputs to the second stage. Also,zdj is indicated asdthintermediate product, d = 1,· · ·, D, of DM Uj. Furthermore, all data
are positive, i.e. Xi, Zd and Yr >0 for all
possi-ble i = 1,· · ·, m;d = 1,· · ·, D and r = 1,· · ·, s. Tone and Tsutsui [32] argued that high rate of
Figure 1: Two stage system
attention should be taken while applying radial network DEA models in evaluating the perfor-mance of two-stage systems, because these mea-sures (radial efficiency meamea-sures) assume that all inputs or outputs change proportionally. Then, they extended the SBM model to assess the over-all efficiency score of network systems. Note that the obtained efficiency score of their proposed model is more precisely than the other conven-tional models such as SBM model. The output-oriented of this model in two-stage systems is
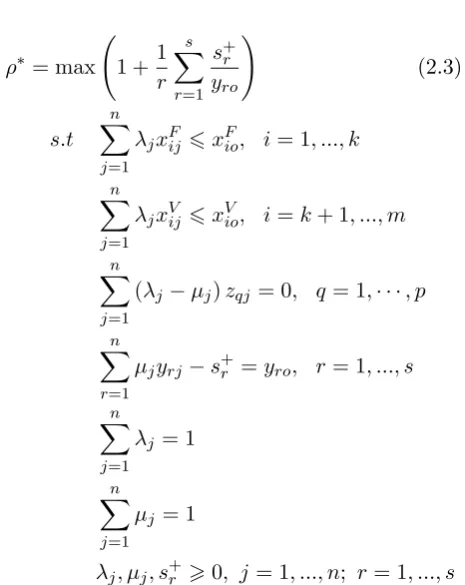
pre-sented as follow:
ρ∗ = max
(
1 +1
r s
∑
r=1
s+r yro
)
(2.3)
s.t n
∑
j=1
λjxFij ⩽xFio, i= 1, ..., k
n
∑
j=1
λjxVij ⩽xVio, i=k+ 1, ..., m
n
∑
j=1
(λj −µj)zqj = 0, q= 1,· · ·, p
n
∑
r=1
µjyrj−s+r =yro, r= 1, ..., s
n
∑
j=1
λj = 1
n
∑
j=1
µj = 1
λj, µj, s+r ⩾0, j = 1, ..., n; r= 1, ..., s
Where λj and µj are the intensity weights of
each are stage, and s+r(r = 1, .., s) denotes out-put slacks. Suppose that ρ∗ is the optimal value of model (2.3).ρ∗ >1 means that theDM U Can extend some output without giving damage other outputs, employing the all current inputs (fixed and variable). We will benefit from this formula-tion to introduce and measure capacity utilizaformula-tion in DEA framework.
2.3 Capacity utilization in DEA framework
repre-sented as:
φFo = max
(
1 +1
s s
∑
r=1
s+r yro ) (2.4) s.t n ∑ j=1
λjxFij ⩽xFio, i= 1, ..., k
s
∑
r=1
λjyrj −s+r =yro, r= 1, ..., s
n
∑
j=1
λj = 1
λj ⩾0, j = 1, ..., n
Assume that φ∗o and φ∗oF are optimal values ob-tained by models (2.2) and (2.4) respectively, then CU measure is defined and calculated by following equation [9]:
CU = φ
∗ o φ∗F
o
The value of capacity utilization, which can be no greater than 1, implies whether a DMU has the potential for greater production with the ex-isting fixed inputs. Recent relation shows that cu measures the gap between actual and capacity output. This gap is created particularly by in-efficient utilization of the fixed inputs. However, when technical inefficiency exists, part of the out-put gap is produced through inefficient utilization of variable inputs. Fare et al [14] proposed the above relation, under the CRS assumption, ap-plying the radial (CCR-O) model. They called this measure, the plant capacity utilization mea-sure of the DM Uo which was evaluated. In fact
Fare et al. [14] argue that a more proper CU mea-sure is the technically efficient output level ratio to the capacity output level.
3
DEA estimation of capacity
utilization in two-stage
pro-duction systems
In this section, the proposition is that all of DMUs have the two-stage structure and develop the concept of CU for these systems. To deter-mine each DMU’s capacity output with the ex-isting fixed inputs whose variable inputs are not
restricted, the following model is proposed:
ρ∗F = max
(
1 +1
r s
∑
r=1
s+r yro ) (3.5) s.t n ∑ j=1
λjxFij ⩽xFio, i= 1, ..., k
n
∑
j=1
(λj−µj)zqj = 0, q= 1,· · ·, p
n
∑
r=1
µjyrj−s+r =yro, r= 1, ..., s
n
∑
j=1
λj = 1
n
∑
j=1
µj = 1
λj, µj, s+r ⩾0,
j= 1, ..., n; r= 1, ..., s
The only main difference between two models (2.3) and (3.5) is the treatment of variable inputs. In model (3.5), it is assumed that the DMU has availability to numerous variable inputs required for full capacity, therefore; their corresponding restrictions are omitted from model.
We assume that ρ∗ and ρ∗F are the optimal value of models (2.3) and (3.5) respectively, by definition, the capacity utilization in two-stage systems can be calculated as follow:
CU(y, z, xF, xV) = ρ ∗
ρ∗F(⩽1) (3.6)
This measure lacks of any technical inefficiency since latter appears in the numerator and denom-inator. In other words it is not downward biased. Also, ((1-CU)*100) could be interpreted as addi-tional output percent which is produced in full capacity without variable inputs restrictions.
4
Numerical example
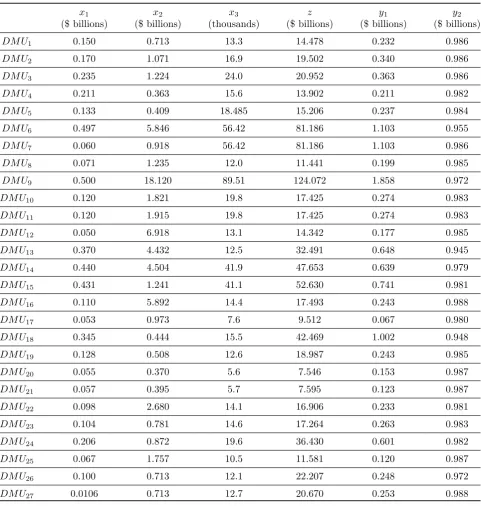
Table 1: Data of 27 US banks.
x1 x2 x3 z y1 y2
($ billions) ($ billions) (thousands) ($ billions) ($ billions) ($ billions)
DM U1 0.150 0.713 13.3 14.478 0.232 0.986
DM U2 0.170 1.071 16.9 19.502 0.340 0.986
DM U3 0.235 1.224 24.0 20.952 0.363 0.986
DM U4 0.211 0.363 15.6 13.902 0.211 0.982
DM U5 0.133 0.409 18.485 15.206 0.237 0.984
DM U6 0.497 5.846 56.42 81.186 1.103 0.955
DM U7 0.060 0.918 56.42 81.186 1.103 0.986
DM U8 0.071 1.235 12.0 11.441 0.199 0.985
DM U9 0.500 18.120 89.51 124.072 1.858 0.972
DM U10 0.120 1.821 19.8 17.425 0.274 0.983
DM U11 0.120 1.915 19.8 17.425 0.274 0.983
DM U12 0.050 6.918 13.1 14.342 0.177 0.985
DM U13 0.370 4.432 12.5 32.491 0.648 0.945
DM U14 0.440 4.504 41.9 47.653 0.639 0.979
DM U15 0.431 1.241 41.1 52.630 0.741 0.981
DM U16 0.110 5.892 14.4 17.493 0.243 0.988
DM U17 0.053 0.973 7.6 9.512 0.067 0.980
DM U18 0.345 0.444 15.5 42.469 1.002 0.948
DM U19 0.128 0.508 12.6 18.987 0.243 0.985
DM U20 0.055 0.370 5.6 7.546 0.153 0.987
DM U21 0.057 0.395 5.7 7.595 0.123 0.987
DM U22 0.098 2.680 14.1 16.906 0.233 0.981
DM U23 0.104 0.781 14.6 17.264 0.263 0.983
DM U24 0.206 0.872 19.6 36.430 0.601 0.982
DM U25 0.067 1.757 10.5 11.581 0.120 0.987
DM U26 0.100 0.713 12.1 22.207 0.248 0.972
DM U27 0.0106 0.713 12.7 20.670 0.253 0.988
, Fixed assets −x2 and The number of employ-ees−x3), one intermediate measure (The deposits generated−z) and two final outputs ( Profit−y1 and Fraction of loans recovered −y2) where x3 indicates the only variable input and fixed ele-ments are x1 and x2 . Table 1 exhibits inputs, intermediate measure and outputs of these firms. According to the method introduced in Section 3, we determine the CU scores in three steps: (a)
calculating the maximum output obtainable from all observed inputs; (b) determining each DMU’s capacity only with observed fixed input, which allows variable inputs to be unlimited (accordant with Johansen’s definition of capacity); and (c) taking the ratio of the first two steps to estimate a capacity utilization measure.
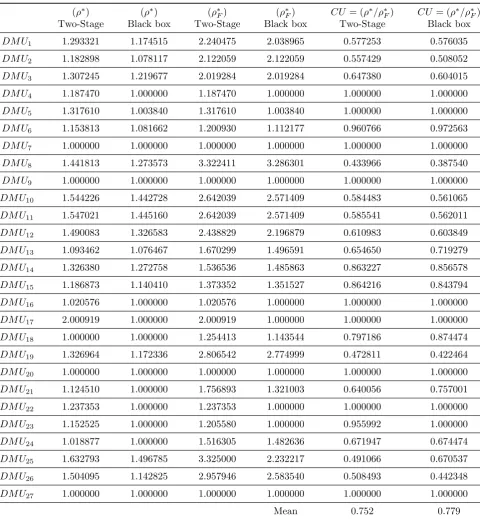
Table 2: CU estimation of 27 banks in two different cases: (Black box and Two-stage).
(ρ∗) (ρ∗) (ρ∗F) (ρ∗F) CU= (ρ∗/ρ∗F) CU = (ρ∗/ρ∗F)
Two-Stage Black box Two-Stage Black box Two-Stage Black box
DM U1 1.293321 1.174515 2.240475 2.038965 0.577253 0.576035
DM U2 1.182898 1.078117 2.122059 2.122059 0.557429 0.508052
DM U3 1.307245 1.219677 2.019284 2.019284 0.647380 0.604015
DM U4 1.187470 1.000000 1.187470 1.000000 1.000000 1.000000
DM U5 1.317610 1.003840 1.317610 1.003840 1.000000 1.000000
DM U6 1.153813 1.081662 1.200930 1.112177 0.960766 0.972563
DM U7 1.000000 1.000000 1.000000 1.000000 1.000000 1.000000
DM U8 1.441813 1.273573 3.322411 3.286301 0.433966 0.387540
DM U9 1.000000 1.000000 1.000000 1.000000 1.000000 1.000000
DM U10 1.544226 1.442728 2.642039 2.571409 0.584483 0.561065
DM U11 1.547021 1.445160 2.642039 2.571409 0.585541 0.562011
DM U12 1.490083 1.326583 2.438829 2.196879 0.610983 0.603849
DM U13 1.093462 1.076467 1.670299 1.496591 0.654650 0.719279
DM U14 1.326380 1.272758 1.536536 1.485863 0.863227 0.856578
DM U15 1.186873 1.140410 1.373352 1.351527 0.864216 0.843794
DM U16 1.020576 1.000000 1.020576 1.000000 1.000000 1.000000
DM U17 2.000919 1.000000 2.000919 1.000000 1.000000 1.000000
DM U18 1.000000 1.000000 1.254413 1.143544 0.797186 0.874474
DM U19 1.326964 1.172336 2.806542 2.774999 0.472811 0.422464
DM U20 1.000000 1.000000 1.000000 1.000000 1.000000 1.000000
DM U21 1.124510 1.000000 1.756893 1.321003 0.640056 0.757001
DM U22 1.237353 1.000000 1.237353 1.000000 1.000000 1.000000
DM U23 1.152525 1.000000 1.205580 1.000000 0.955992 1.000000
DM U24 1.018877 1.000000 1.516305 1.482636 0.671947 0.674474
DM U25 1.632793 1.496785 3.325000 2.232217 0.491066 0.670537
DM U26 1.504095 1.142825 2.957946 2.583540 0.508493 0.442348
DM U27 1.000000 1.000000 1.000000 1.000000 1.000000 1.000000
Mean 0.752 0.779
all inputs (fixed and variable) and capacity out-put of each unit with only fixed inout-puts respec-tively. We assume that ρ∗ and ρ∗F are the opti-mal value of models (2.3) and (3.5) respectively. Then, using formula (3.6), we obtain each DMU’s CU. Table2reports the estimated CU for each of these DMUs in two different positions (two-stage and black box).
It should be noted that in the black box posi-tion, the intermediate measures are disregarded. In this position, the DMUs are treated as one-stage production processes that transform inputs to outputs.
ignoring the intermediate measures, the CU value for special DMU is not necessarily the same in the both positions. For example considerDM U23 , regarding the assessment of this unit in black box position CU=1 i.e., even with applying the current fixed inputs it is unable to produce more output while if it is analyzed in two-stage form, its CU is less than 1 and has excess capacity in two-stage position. Namely this firms possesses a potential to produce more output with the cur-rent fixed inputs. So, what is clear is that taking the intermediate measures or their negligence af-fect the firm’s ability to access certain outputs levels. In Table 2, the average score of CU is 0.752, indicating that 24.8% of the capacities of DMUs are not utilized.
The received results of Table2in two-stage po-sition show that only nine of all DMUs would op-erate with full capacity. These DMUs (4, 5, 7, 9, 16, 17, 20, 22 and 27) fully utilize their fixed inputs. In other words only 33% of total units operate with full capacity and 67% of DMUs has excess capacity because their corresponding CU are estimated less than 1. Therefore, they could increase their outputs without alternation in level of fixed inputs. Note that insufficient employees results to low CU. According to Table2, the low-est capacity utilization which equals 0.434 is as-sociated toDM U8. (i.e. it only utilizes 43.4% of its capacity).
Based on obtained results of CU in this posi-tion, rather greater proportion of DMUs (51%) exhibit CU measures between 0.8-1. In the other words, 51% of total DMUs use higher than 80% of their capacity. To check the results of Table 2, we compute the CU score of DM U14. Using models (2.3) and (3.5), in the evaluation of this unit, the following optimal values are obtained
ρ∗= 1.326380 and ρ∗F = 1.536536
Now, applying relation (3.5), we calculate its cor-responding CU as follows:
CU(DM U14)=
ρ∗ ρ∗F =
1.326380
1.536536 = 0.863227≈0.86or86%
Since CU(DM U14) <1 then it has excess capacity
and could produce more than its current levels.
In other words, this measure illustrates that there is a possibility to improve its production by 14% without additional fixed inputs such as the hiring new employees. Similar analyses can be carried out for other firms (DMUs).
5
Conclusion
References
[1] S. Akther, H. Fukuyama, W. Weber, Esti-mating two-stage network Slacks-based in-efficiency: An application to Bangladesh banking,Omega 41 (2013) 88-96.
[2] F. Boloori; J. Pourmahmoud, A modified SBM-NDEA approach for the efficiency mea-surement in bank branches,Oper Res Int . J
16 (2016) 301-326.
[3] A. Charnes, W.W.Cooper, Programming with linear fractional functional, Naval Re-search Logistics Quarterly 9 (1962) 181-185. [4] A. Charnes, W.W. Cooper, E. Rhodes, Measuring the efficiency of decision making units, European Journal of Operational Re-search 2 (1978) 429-444.
[5] Y. Chen, W.D. Cook, N. Li N, J. Zhu, Ad-ditive efficiency decomposition in two-stage DEA, European Journal of Operational Re-search 196 (2009) 1170-1176.
[6] Y. Chen, L. Yongjun, L. Liang, S. Ahti, W. Huaqing , Frontier projection and efficiency decomposition in two-stage processes with slacks-based measures, European Journal of Operational Research 12 (2015) 1-12.
[7] Y. Chen, J. Zhu, Measuring information technologys indirect impact on firm perfor-mance, Information Technology and Man-agement journal 5 (2004) 9-22.
[8] W. D. Cook, L. Liang, J. Zhu, Measuring performance of two-stage network structures by DEA: A review and future perspective,
Omega 38 (2010) 423-430.
[9] W. W. Cooper, L. M. Seiford, K. Tone, Data Envelopment Analysis: A Comprehen-sive Text with Models, Applications, Refer-ences and DEA Solver Software, Springer-Verlag New York Inc, (2006).
[10] D. K. Despotis, G. Koronakos, D. Sotiros, Composition versus decomposition in two-stage network DEA: a reverse approach,
Journal of Productivity Analysis 45 (2014) 71-87.
[11] D. K. Despotis, D. Sotiros. G. Koronakos, A network DEA approach for series multi-stage processes,Omega 61 (2016) 35-48.
[12] R. F¨are, The existence of plant capacity,Int. Econ. Rev 25 (1984) 209-213.
[13] R. F¨are, S. Grosskopf, Network DEA, Socio-Economic Planning Sciences 34 (2000) 35-49.
[14] R. F¨are, S. Grosskopf, C. A. K. Lovell, Production Frontiers,Cambridge University Press, Cambridg e, U.K (1994).
[15] R. F¨are, S. Grosskopf, E. C. Kokkelenberg, Measuring Plant Capacity, Utilization and Technical Change: A Nonparametric Ap-proach, International Economic Review 30 (1989) 655-666.
[16] M. J. Farrell, The measurement of produc-tive efficiency, Journal of the Royal Statisti-cal Society 120 (1957) 253-281.
[17] H. Guo, R. A. Shureshjani, A. A. Foroughi, J. Zhu, Decomposition Weights and Over-all Efficiency in Two-stage Additive Network DEA, European Journal of Operational Re-search 257 (2017) 896-906.
[18] L. Johansen, Production functions and the concept of capacity. In: Recent research on the function of production, Namur, France: Namur University Center for Study and Re-search, 1968.
[19] C. Kao, Network data envelopment analysis: A review, European Journal of Operational Research 239 (2014) 1-16.
[20] C. Kao, S. N. Hwang, Efficiency decomposi-tion in two-stage data envelopment analysis: An application to non-life insurance compa-nies in Taiwan, European Journal of Oper-ational Research 185 (2008) 418-429.
[21] C. Kao, S. T. Liu, Efficiencies of two-stage systems with fuzzy data,Fuzzy Sets and Sys-tems 176 (2011) 20-35.
[23] J. Kirkley, D. Squires, Capacity and capac-ity utilization in fishing industries, Glouces-ter Point, VA: Virginia Institute of Marine Science, 1999.
[24] H. Li, C. Chen, W. D. Cook, J. Zhang, J. Zho. Two-stage network DEA: Who is the leader,Omega 74 (2018) 15-19.
[25] Y. Li, Y. Chen, L. Liang, J. Xie, DEA mod-els for extended two-stage network struc-tures,Omega 40 (2012) 611-618.
[26] L. Liang, W. D. Cook, J. Zhu, DEA models for two-stage processes: Game approach and efficiency decomposition,Naval Research Lo-gistics (NRL) 55 (2008) 643-653.
[27] W. Liu, Z. Zhou, C. Ma, D. Liu, W. Shen, Two-stage DEA models with undesir-able input-intermediate-outputs, Omega 56 (2015) 74-87.
[28] C. J. Morrison, Primal and dual capacity uti-lization: an application to productivity mea-surement in the US Automobile Industry,J. Bus. Econ. Stud.3 (1985) 312-324.
[29] B. K. Sahoo, K. Tone, Decomposing capac-ity utilization in data envelopment analysis: An application to banks in India, European Journal of Operational Research 195 (2009) 575-594.
[30] L. M. Seiford, J. Zhu, Profitability and marketability of the top 55 US commercial banks,Management Science 45 (1999) 1270-1288.
[31] K. Tone, A slacks-based measure of effi-ciency in data envelopment analysis, Euro-pean Journal of Operational Research 130 (2001) 498-509.
[32] K. Tone, M. Tsutsui, Network DEA: A slacks-based measure approach, European Journal of Operational Research 197 (2009) 243-252.
[33] N. Vestergaard, D. Squires, J. Kirkley, Mea-suring capacity and capacity utilization in fisheries: the case of the Danish Gill-net fleet,Fisheries Research 60 (2003) 357-368.
[34] G. L. Yang, H. Fukuyama, Measuring the Chinese Regional Production using a Gener-alized Capacity Utilization Indicator,Omega
76 (2018) 112-127.
[35] M. M. Yu, Y. C. Chang, L. H. Chen, Mea-surement of airlines’ capacity utilition and cost gap: Evidence from low-cost carriers,
Journal of air transport Management 53 (2016) 186-198.
[36] S. Zhang, T. P. Chang, W. Jiang, Dynamic Capacity Utilization in Chinas Industrial Sector,The Empirical Economics Letters 15 (2016) 593-599.
[37] Z. Zhou, L. Lin, H. Xiao, C. Ma, S. Wu, Stochastic network DEA models for two-stage systems under the centralized control organization mechanism,Computers and In-dustrial Engineering 110 (2017) 404-412.
Leila Zeinalzadeh Ahranjani is
a faculty member of Islamic
Azad University, Salmas Branch, Salmas, Iran. She received her Ph.D. in applied mathematics (Operation Research) in August 2017 from Islamic Azad University, Karaj Branch. She got her Ms.C from Islamic Azad University, Science and Research Branch and Bs.C from Islamic Azad University, Marand Branch. Her main research area is Data Envelop-ment Analysis (DEA).
published in such journals as Omega, Euro-pean Journal of Operational Research, Agricul-tural Economics, Operations Research Society of Japan, Measurement, RAIRO-Operations Re-search, Socio-Economic Planning, Annals of Op-erations Research, IMA Journal of Management Mathematics, Asia-Pacific Journal of Operational Research and Applied Mathematical Modeling. He is a member of Iranian Operations Research Society and Iranian Data Envelopment Analysis Society.