VOLUME 40, ARTICLE 54, PAGES 1603
-
1644
PUBLISHED 27 JUNE 2019
https://www.demographic-research.org/Volumes/Vol40/54/ DOI: 10.4054/DemRes.2019.40.54
Research Article
Adult mortality among second-generation
immigrants in France: Results from a nationally
representative record linkage study
Michel Guillot
Myriam Khlat
Matthew Wallace
© 2019 Michel Guillot, Myriam Khlat & Matthew Wallace.
This open-access work is published under the terms of the Creative Commons Attribution 3.0 Germany (CC BY 3.0 DE), which permits use, reproduction, and distribution in any medium, provided the original author(s) and source are given credit.
1 Introduction 1604
2 Methods 1605
2.1 Data sources 1605
2.2 Study parameters 1606
2.3 Mortality estimation 1608
3 Results 1608
4 Discussion 1612
5 Acknowledgements 1616
References 1617
Adult mortality among second-generation immigrants in France:
Results from a nationally representative record linkage study
Michel Guillot1,2
Myriam Khlat2
Matthew Wallace3
Abstract
BACKGROUND
France has a large population of second-generation immigrants (i.e., native-born children of immigrants) who are known to experience important socioeconomic disparities by country of origin. The extent to which they also experience disparities in mortality, however, has not been previously examined.
METHODS
We used a nationally representative sample of individuals 18 to 64 years old in 1999 with mortality follow-up via linked death records until 2010. We compared mortality levels for second-generation immigrants with their first-generation counterparts and with the reference (neither first- nor second-generation) population using mortality hazard ratios as well as probabilities of dying between age 18 and 65. We also adjusted hazard ratios using educational attainment reported at baseline.
RESULTS
We found a large amount of excess mortality among second-generation males of North African origin compared to the reference population with no migrant background. This excess mortality was not present among second-generation males of southern European origin, for whom we instead found a mortality advantage, nor among North African– origin males of the first-generation. This excess mortality remained large and significant after adjusting for educational attainment.
CONTRIBUTION
In these first estimates of mortality among second-generation immigrants in France, males of North African origin stood out as a subgroup experiencing a large amount of excess mortality. This finding adds a public health dimension to the various
1 Population Studies Center, University of Pennsylvania, Philadelphia, USA. Email:[email protected].
2 Institut National d’Études Démographiques (INED), Paris, France.
disadvantages already documented for this subgroup. Overall, our results highlight the importance of second-generation status as a significant and previously unknown source of health disparity in France.
1. Introduction
The native-born children of immigrants, also called second-generation immigrants, constitute a growing and increasingly diverse population in many countries of the European Union. In the EU as a whole, the population of second-generation immigrants with at least one foreign-born parent increased by 21.0% between 2008 and 2014, with
larger increases (33.4%) for those of non-EU origin (Agafiţei and Ivan 2017). In
proportionate terms, second-generation immigrants represented 6.0% of the total EU
population in 2014, up from 5.2% in 2008 (Agafiţei and Ivan 2017). Although research
is sparse, second-generation status has been identified in previous studies as an important source of health disparities in EU countries, with important disadvantages in mortality outcomes for certain second-generation subgroups, especially those of non-EU origin (Harding and Balarajan 1996; Razum et al. 1998; Tarnutzer, Bopp, and Grp 2012; Scott and Timæus 2013; De Grande et al. 2014; Manhica et al. 2015; Vandenheede et al. 2015; Wallace 2016; Jervelund et al. 2017).
Explanations for these mortality disadvantages include lower socioeconomic status, detrimental health behaviors, and chronic stress arising from perceived discrimination (Scott and Timæus 2013; De Grande et al. 2014; Manhica et al. 2015; Vandenheede et al. 2015; Wallace 2016; Jervelund et al. 2017). These patterns of excess mortality contrast with the situation of immigrants per se (i.e., the first generation) who tend to experience a mortality advantage despite lower socioeconomic status, a well-known paradox explained in part by migration selection effects (also referred to as the “healthy migrant effect”) (Razum et al. 1998; Palloni and Morenoff 2001; Bourbeau 2002; Khlat and Darmon 2003; Crimmins et al. 2005; Gushulak 2007; Riosmena, Wong, and Palloni 2013; Vang et al. 2017).
Among EU countries with populations greater than 1 million, France is the country with the largest second-generation population in both absolute and relative terms. In 2014, France’s population of second-generation immigrants with a least one
foreign-born parent reached 9.5 million, representing 14.3% of the total population (Agafiţei
primarily immigrants from European countries (Italy, Spain, Portugal, Belgium, and Poland), followed after 1945 by large waves of ‘colonial’ migrants (mostly from North Africa). Despite a decrease in labor migration after 1973, immigration to France continued, mostly via family reunification, and the diversity of immigrants continued to increase, with larger proportions of immigrants from sub-Saharan Africa and Asia. This immigration history has generated a second-generation population that, today, is both large and diverse. The regions of origin most represented among second-generation immigrants are southern Europe (Portugal, Italy, or Spain) and North Africa (Algeria, Morocco, or Tunisia), which each region totaling about one-third. The last third comprises a very diverse set of parental countries of origin, including countries in sub-Saharan Africa, Europe, and Asia.
Previous studies have shown that in France, second-generation immigrants of non-EU origin, particularly those of North African origin, experience systematic disadvantages in important areas such as educational attainment, employment, and income (Silberman and Fournier 1999; Canaméro, Canceill, and Cloarec 2000; Meurs, Pailhé, and Simon 2006; INSEE 2012; Brinbaum, Primon, and Meurs 2016). The extent to which they also experience disadvantages in the area of mortality, however, has not been previously examined. This is a significant gap given the size of the second-generation population in France and the importance of documenting health disparities for informing evidence-based public health policies.
In this paper, we take advantage of a unique data source to estimate mortality by second-generation status in France. We focus on adults ages 18 to 64 and on the two main regions of origin of second-generation immigrants in the French context: southern Europe (Italy, Spain, and Portugal) and North Africa (Algeria, Morocco, and Tunisia). We compare adult mortality levels for second-generation immigrants with their first-generation counterparts and with the reference (neither first- nor second-first-generation) population. We also examine whether mortality differentials for second-generation adults remain after adjusting for educational attainment. To our knowledge, this is the first time that adult mortality patterns among second-generation immigrants in France are examined.
2. Methods
2.1 Data sources
significant portion of the North Africa–born population is made up of ‘repatriates’ – a group of mostly European-origin individuals who were born in Algeria during the colonial period and relocated to France following Algeria’s independence in 1962 – rather than immigrants per se. This makes parental place of birth an insufficient variable for identifying second-generation immigrants of North African origin. Moreover, the French constitution prohibits the collection of information on ethnicity in official statistical sources, leaving few options for identifying second-generation immigrants, particularly those of North African origin (Simon 2015).
Nonetheless, we identified one data source that provides solutions to these identification issues while also containing mortality information. This source, called Echantillon Longitudinal de Mortalité (ELM; Longitudinal Mortality Sample), combines a baseline survey of the adult population living in France in 1999 with linked
death records through 2010. The baseline 1999 survey, called Etude de l’Histoire
Familiale (EHF; Family History Survey), is a random sample of approximately 380,000 individuals ages 18 and older who, as part of the 1999 census in France, were requested to fill in an additional questionnaire documenting their family history, including parental place of birth and languages used by parents to speak with the respondent when the respondent was age 5. The EHF information for these individuals was then matched, using identifying information on the respondent’s name, date, and place of birth, with France’s National Directory for the Identification of Natural Persons (RNIPP), an exhaustive population register that tracks identification information as well as civil status information of all residents of France. Survival status information (dead vs. alive) at the end of the observation period (15 April 2010), as well as the date of death for those who died during the observation period, was provided for the EHF individuals who were matched with the RNIPP. Information on causes of death was not included. The ELM did not track international out-migrations; individuals who were matched with the RNIPP but left France permanently during the period of observation thus appear in the ELM sample as ‘alive’ in 2010.
2.2 Study parameters
France to two parents born in France. For individuals born in North Africa or born in France to two parents born in North Africa, we took one extra step to better identify North African–origin immigrants and their native-born children as opposed to repatriates and their native-born children. Those reporting that at least one parent spoke to them in Arabic or Berber, alone or in combination with other languages, when they were age 5, or those reporting that their parents spoke to them exclusively in French but were either foreign nationals or naturalized French nationals at the time of the 1999 survey, were identified as North African–origin G1 or G2 immigrants. Individuals who were born in North Africa or born in France to two parents born in North Africa who did not meet these criteria were considered G1 or G2 repatriates and were removed from the analysis. This approach is based on the observation that the vast majority (about 80%) of repatriates were of European descent (Moumen 2010) and were unlikely to have had parents that spoke to them in Arabic or Berber when they were age 5. France-born children of repatriates were thus also unlikely to have had parents that spoke to them in Arabic or Berber when they were age 5. Conversely, immigrants from North Africa and their France-born children were unlikely to have had parents that spoke to them only in French when they were age 5 (Condon and Régnard 2016). Our use of nationality information is based on the fact that repatriates and children of repatriates had by definition a French nationality at birth. The categories ‘foreign’ or ‘French by acquisition’ in the ELM are thus markers of G1 or G2 immigrant status even for those who report that their parents spoke to them only in French. This approach combining language and nationality information is consistent with previous attempts to identify the North African–origin population in France using the EHF data (Tribalat 2004). (See Appendix Section 6 for further details about this approach and a sensitivity analysis.)
In addition to first- and second-generation status, the main sociodemographic characteristic included in this study was educational attainment, measured at baseline in 1999. We used categories following the International Standard Classification of Education (ISCED): ‘primary’ (less than primary and primary); ‘secondary’ (secondary
1st and 2nd cycle); and ‘tertiary’ (post-secondary to pre-university and beyond).
Although the ELM included additional socioeconomic background variables, they were all measured at baseline in 1999. Neither retrospective nor prospective measures of socioeconomic status were available. Given these data constraints, we decided to focus on educational attainment as it is the most permanent variable of socioeconomic status and is less subject to reverse causation than variables such as employment status or occupation (Elo 2009).
particularly, North Africa. Substantively, this upper age truncation allowed us to focus on mortality among adults of working ages (18 to 64), a specific age segment associated with the concept of premature mortality.
The overall response rate in the EHF was 79.4%. Among individuals ages 18 to 64 in the EHF, 11.4% had missing information on variables necessary for subgroup attribution (place of birth, parental place of birth, languages, and/or nationality at birth); they were excluded as their first- or second-generation status could not be ascertained. Among those for whom the population subgroup was known, 18.9% could not be matched with the RNIPP and were excluded from the study, as their vital status in 2010 could not be determined. Within the final sample, 2.3% of the individuals had missing information for educational attainment and were assigned to a separate ‘missing’ education category in our models adjusting for educational attainment. (See Appendix Sections 1–3 for more details on missing data and a sensitivity analysis.)
2.3 Mortality estimation
We estimated mortality at ages 18 to 64 separately for males and females using a hazard model with age as the duration variable, assuming a Gompertz baseline hazard for the reference population and proportional hazards for our subgroups of interest (G1, G2, and G2m by region of origin). Individuals who reached age 65 prior to the end of the observation period and those whose survival status was ‘alive’ at the end of the observation period were right censored. We converted model parameters into expected
probabilities of dying between age 18 and 65 (q18–65) for each subgroup of interest using
standard life table equations (Preston, Heuveline, and Guillot 2001). We also estimated adjusted hazard ratios for our subgroups of interest, using educational attainment as a covariate.
3. Results
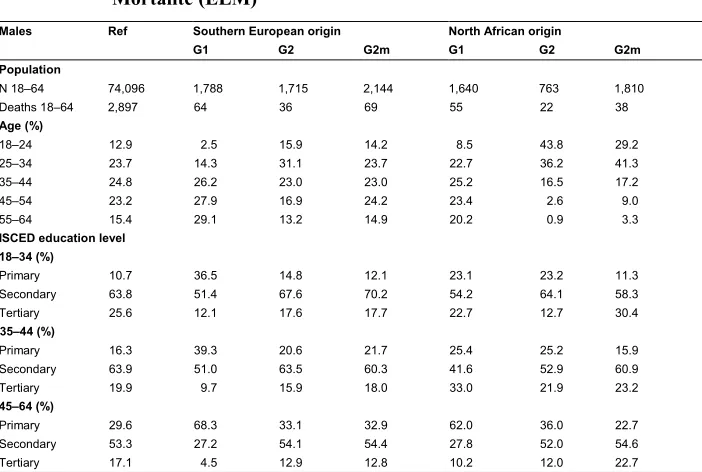
tended to be less educated than the reference population. Levels of education for southern European–origin G2 were higher than for their G1 counterparts but still lower than for the reference population. G2 North African–origin males and females had generally lower levels of educational attainment than both their southern European counterparts and the reference population.
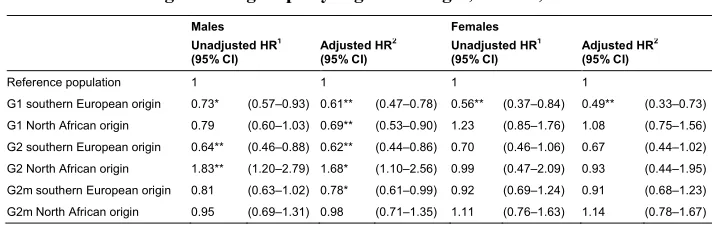
Table 2 shows mortality hazard ratios (HR, with 95% CI) for subgroups of interest, based on our Gompertz hazard model. (See Appendix Tables A-1 and A-2 for an unabridged version of this table.) The unadjusted HRs compare each subgroup with the reference population of individuals born in France to two parents born in France. For ease of interpretation, we show in Figure 1 the corresponding probabilities of dying
between age 18 and 65 (q18-65), with 95% confidence intervals.
Table 1: Baseline characteristics of first- and second-generation immigrant
subgroups by region of origin in the Echantillon Longitudinal de Mortalité (ELM)
Males Ref Southern European origin North African origin
G1 G2 G2m G1 G2 G2m
Population
N 18–64 74,096 1,788 1,715 2,144 1,640 763 1,810
Deaths 18–64 2,897 64 36 69 55 22 38
Age (%)
18–24 12.9 2.5 15.9 14.2 8.5 43.8 29.2
25–34 23.7 14.3 31.1 23.7 22.7 36.2 41.3
35–44 24.8 26.2 23.0 23.0 25.2 16.5 17.2
45–54 23.2 27.9 16.9 24.2 23.4 2.6 9.0
55–64 15.4 29.1 13.2 14.9 20.2 0.9 3.3
ISCED education level 18–34 (%)
Primary 10.7 36.5 14.8 12.1 23.1 23.2 11.3
Secondary 63.8 51.4 67.6 70.2 54.2 64.1 58.3
Tertiary 25.6 12.1 17.6 17.7 22.7 12.7 30.4
35–44 (%)
Primary 16.3 39.3 20.6 21.7 25.4 25.2 15.9
Secondary 63.9 51.0 63.5 60.3 41.6 52.9 60.9
Tertiary 19.9 9.7 15.9 18.0 33.0 21.9 23.2
45–64 (%)
Primary 29.6 68.3 33.1 32.9 62.0 36.0 22.7
Secondary 53.3 27.2 54.1 54.4 27.8 52.0 54.6
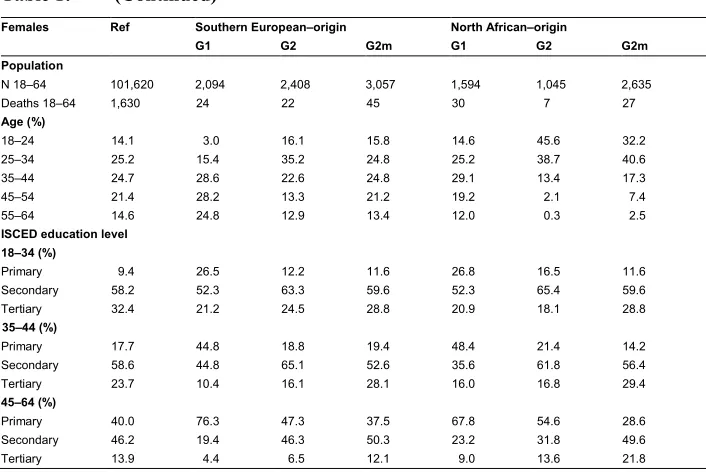
Table 1: (Continued)
Females Ref Southern European–origin North African–origin
G1 G2 G2m G1 G2 G2m
Population
N 18–64 101,620 2,094 2,408 3,057 1,594 1,045 2,635
Deaths 18–64 1,630 24 22 45 30 7 27
Age (%)
18–24 14.1 3.0 16.1 15.8 14.6 45.6 32.2
25–34 25.2 15.4 35.2 24.8 25.2 38.7 40.6
35–44 24.7 28.6 22.6 24.8 29.1 13.4 17.3
45–54 21.4 28.2 13.3 21.2 19.2 2.1 7.4
55–64 14.6 24.8 12.9 13.4 12.0 0.3 2.5
ISCED education level 18–34 (%)
Primary 9.4 26.5 12.2 11.6 26.8 16.5 11.6
Secondary 58.2 52.3 63.3 59.6 52.3 65.4 59.6
Tertiary 32.4 21.2 24.5 28.8 20.9 18.1 28.8
35–44 (%)
Primary 17.7 44.8 18.8 19.4 48.4 21.4 14.2
Secondary 58.6 44.8 65.1 52.6 35.6 61.8 56.4
Tertiary 23.7 10.4 16.1 28.1 16.0 16.8 29.4
45–64 (%)
Primary 40.0 76.3 47.3 37.5 67.8 54.6 28.6
Secondary 46.2 19.4 46.3 50.3 23.2 31.8 49.6
Tertiary 13.9 4.4 6.5 12.1 9.0 13.6 21.8
Note: Ref = individuals born in France to two parents born in France. G1 = first generation. G2 = second generation. G2m = mixed second generation. The education level distributions show percentages among individuals with a non-missing education.
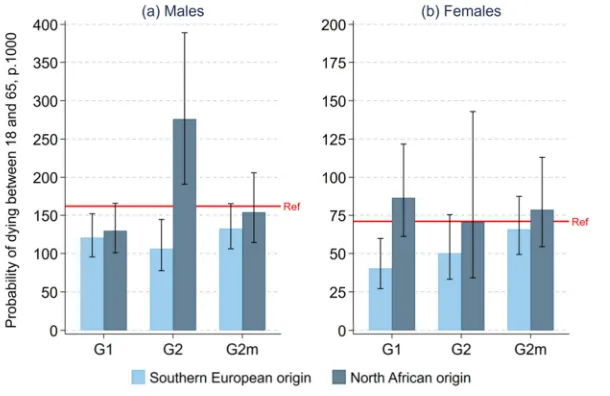
For males (Figure 1, panel a), the estimated level of q18–65 for the reference
population was 162 per 1,000, a level comparable to results from official vital registration data for a similar period. (See Appendix Section 5 for the details of this comparison.) Results for G1 and G2 subgroups have wide confidence intervals due to small sample sizes. Nonetheless, we observe a strong contrast between generational trajectories for southern European– vs. North African–origin males. For the first generation, we observe low mortality relative to the reference population for both southern European– and North African–origin immigrants, though only marginally significant for North African–origin immigrants. This is consistent with the well-known observation, including in France (Khlat and Courbage 1996; Boulogne et al. 2012), that first-generation immigrants typically experience a mortality advantage. For the second generation, however, a strong contrast appears between southern European– vs. North African–origin individuals. For southern European–origin G2 males, we find a mortality advantage similar to what was observed for their G1 counterparts, with an
estimated q18–65 level of about 106 per 1,000. For North African–origin G2 males,
of about 276 per 1,000, which is 1.70 times larger than for the reference population. (As shown in Table 2, this corresponds to a HR of 1.83, with a 95% CI of 1.20 to 2.79.) G2m subgroups have mortality levels closer to the reference population, with differences that are not statistically significant.
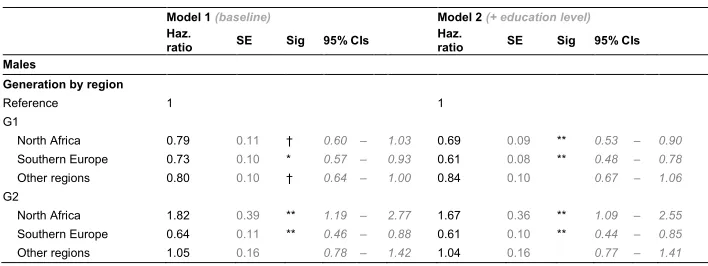
Table 2: Mortality hazard ratios (ages 18–64) for first- and second-generation
immigrant subgroups by region of origin, France, 1999–2010
Males Females
Unadjusted HR1
(95% CI)
Adjusted HR2
(95% CI)
Unadjusted HR1
(95% CI)
Adjusted HR2
(95% CI)
Reference population 1 1 1 1
G1 southern European origin 0.73* (0.57–0.93) 0.61** (0.47–0.78) 0.56** (0.37–0.84) 0.49** (0.33–0.73) G1 North African origin 0.79 (0.60–1.03) 0.69** (0.53–0.90) 1.23 (0.85–1.76) 1.08 (0.75–1.56) G2 southern European origin 0.64** (0.46–0.88) 0.62** (0.44–0.86) 0.70 (0.46–1.06) 0.67 (0.44–1.02) G2 North African origin 1.83** (1.20–2.79) 1.68* (1.10–2.56) 0.99 (0.47–2.09) 0.93 (0.44–1.95) G2m southern European origin 0.81 (0.63–1.02) 0.78* (0.61–0.99) 0.92 (0.69–1.24) 0.91 (0.68–1.23) G2m North African origin 0.95 (0.69–1.31) 0.98 (0.71–1.35) 1.11 (0.76–1.63) 1.14 (0.78–1.67)
Note: HR = hazard ratio. CI = confidence interval. *p<0.05. **p<0.01. 1without adjustment for educational attainment.2with
adjustment for educational attainment, using ISCED categories. Reference population = individuals born in France to two parents born in France. G1 = first generation. G2 = second generation. G2m = mixed second generation. Models are estimated including residual G1/G2/G2m ‘other regions of origin’ categories. See Table A-1 for an unabridged version of the models’ results.
Source: Echantillon Longitudinal de Mortalité (ELM).
Panel b of Figure 1 shows results for females. Confidence intervals are relatively wider than for males, in part because of small numbers of deaths arising from the combination of small sample sizes and lower overall mortality levels for females vs. males. The only subgroup for which we observe a statistically significant difference with the reference population is southern European–origin G1 females, who experience a mortality advantage similar to their male counterparts.
Figure 1: Probability of dying between ages 18 and 65 (q18–65) for first- and
second-generation immigrant subgroups by region of origin, France, 1999–2010
Note: Legend: G1 = first generation; G2 = second generation; G2m = mixed second generation; Ref = reference population (individuals born in France to two parents born in France).
Source: Echantillon Longitudinal de Mortalité (ELM).
4. Discussion
mixed-second-generation subgroups. To our knowledge, our study is the first one to document these mortality disparities in the French context.
What could explain the excess mortality among second-generation North African– origin males? Differential access to health care is unlikely to be an important explanation, as studies have shown no difference in health care utilization between second-generation immigrants and the reference population in France (Berchet and Jusot 2012). Lack of data on health behaviors and causes of death prevents us from evaluating other proximate determinants, including the role of smoking and alcohol. It is worth noting, however, that the sample of second-generation North African–origin males is quite young, with most individuals at less than 45 years old at the time of the survey. If we top truncate longitudinal follow-up in the sample at age 45, the hazard ratio for this subgroup increases to 2.02 and remains strongly significant (Table A-13). Given that the dominant causes of death among young adult males in a low-mortality country like France are external causes, such as motor vehicle accidents, poisoning, and suicides (Aouba et al. 2011), these causes may be key to understanding the proximate determinants of this excess mortality. The likely importance of external causes of death for this group is corroborated by a study of mortality patterns in Belgium, which found that second-generation North African–origin males had elevated risks of death from drug- and alcohol-related causes (De Grande 2015).
2017). Another factor which may explain the first- vs. second-generation contrast is the fact that first-generation immigrants may retain their country of origin as a frame of reference and from that standpoint may assess their labor market outcomes more favorably than second-generation immigrants for whom the frame of reference is the host country (Heath and Li 2008). Moreover, first-generation immigrants may be more likely to accept labor market disadvantages as part of the “cost” of immigration (Anson 2004). Second-generation immigrants, by contrast, did not decide to immigrate and are likely to be less accepting of such labor market disadvantages. These psychosocial differences may generate poorer health outcomes for second-generation immigrants (Lynch et al. 2000). In the French context, studies have shown that the perception of labor market discrimination is indeed more prevalent among second-generation than first-generation immigrants of the same origin (Meurs, Lhommeau, and Okba 2016), which may translate into worse psychosocial functioning and health outcomes (Paradies 2006; Cobbinah and Lewis 2018).
Although we stress here the pattern of excess mortality among second-generation males of North African origin, we also take note of the mortality advantage we found among those of southern European origin. This new result is surprising and somewhat paradoxical given that this subgroup does not appear to be particularly favored in terms of socioeconomic factors, including education (Table 1), relative to the reference population (Beauchemin, Hamel, and Simon 2016). One possible explanation is the role of social networks. Studies have shown that, for example, second-generation immigrants of Portuguese origin have better labor market outcomes than would be expected on the basis of their educational attainment (Brinbaum, Primon, and Meurs 2016). These labor market advantages have been explained by the role of active social networks facilitating access to jobs (Lebeaux and Degenne 1991; Marry, Fournier-Mearelli, and Kieffer 1995) and could generate better health outcomes. The positive role of social support has also been raised to explain favorable labor and health outcomes among the children of Spanish and Italian immigrants in Switzerland (Bolzman, Fibbi, and Vial 2003; Zufferey 2016). Overall, our results highlight the importance of second-generation status as a significant and previously unknown source of health disparities in France.
immigrants. This current lack of alternative sources makes our results all the more significant, but it also highlights the need for new data collection efforts in France in this area of research. Second, a sizeable proportion (18.9%) of individuals in the sample could not have their vital status ascertained and were thus excluded from the study. To understand the impact of this exclusion on our results, we estimated the effect of background characteristics on the probability of being unmatched using logistic regression. We found that the probability of being unmatched was strongly associated with characteristics indicating lower socioeconomic status, including lower educational attainment and lower occupational status (Table A-8). These associations, combined with the fact that the proportions unmatched were higher among second-generation North African–origin males (24.5%) than among males in the reference population (9.1%), suggest that the high hazard ratios for the former group may in fact be conservative. (See Appendix Section 3 for more details and additional evidence.) Finally, our study lacks proper censoring of individuals who left France permanently during the follow-up period, producing a downward bias in mortality rates. This lack of censoring, however, cannot explain our finding that second-generation North African– origin males experience excess mortality because studies have shown that second-generation immigrants are somewhat more likely to out-migrate – and thus more likely to be affected by a downward bias in mortality estimates – than the reference population with no immigration background (Richard 2004). If anything, this lack of censoring generates conservative estimates of the true amount of excess mortality for this group. (See Appendix Section 4 for an illustration of this mechanism using simulations.)
Additional research is urgently needed to further document and understand the causes of these alarming mortality patterns, including the collection of larger mortality samples with variables allowing proper identification of second-generation immigrants together with information on their socioeconomic conditions, health behaviors, morbidity outcomes, and causes of death.
5. Acknowledgements
References
Agafiţei, M. and Ivan, G. (2017). First and second-generation immigrants: Statistics on
main characteristics [electronic resource]. Luxembourg: Eurostat.
http://ec.europa.eu/eurostat/statistics-explained/index.php?title=First_and_ second-generation_immigrants_-_statistics_on_main_characteristics.
Anson, J. (2004). The migrant mortality advantage: A 70 month follow-up of the
brussels population. European Journal of Population 20(3): 191–218.
doi:10.1007/s10680-004-0883-1.
Aouba, A., Eb, M., Rey, G., Pavillon, G., and Jougla, E. (2011). Données sur la mortalité en France: Principales causes de décès en 2008 et évolutions depuis
2000.Bulletin épidémiologique hebdomadaire 22: 249–255.
Beauchemin, C., Hamel, C., and Simon, P. (2016). Trajectoires et origines: Enquête sur la diversité des populations en France. Paris: INED.
Berchet, C. and Jusot, F. (2012). Immigrants’ health status and use of healthcare services: A review of French research. Paris: Institute for Research and Information in Health Economics (Questions d’économie de la santé 172).
Bolzman, C., Fibbi, R., and Vial, M. (2003). Secondas – secondos: Le processus
d’intégration des jeunes adultes issus de la migration espagnole et italienne en Suisse. Zurich: Seismo.
Boulogne, R., Jougla, E., Breem, Y., Kunst, A.E., and Rey, G. (2012). Mortality differences between the foreign-born and locally-born population in France
(2004–2007). Social Science and Medicine 74(8): 1213–1223. doi:10.1016/
j.socscimed.2012.01.002.
Bourbeau, R. (2002). L’effet de la ‘sélection d’immigrants en bonne santé’ sur la
mortalité canadienne aux grands âges.Cahiers québécois de démographie 31(2):
249–274.doi:10.7202/000667ar.
Brinbaum, Y., Primon, J.-L., and Meurs, D. (2016). Situation sur le marché du travail: Statuts d’activité, accès à l’emploi et discrimination. In: Beauchemin, C., Hamel, C., and Simon, P. (eds.). Trajectoires et origins: Enquête sur la diversité des populations en France. Paris: INED: 203–232.
Canaméro, C., Canceill, G., and Cloarec, N. (2000). Chômeurs étrangers et chômeurs
Cobbinah, S.S. and Lewis, J. (2018). Racism and health: A public health perspective on
racial discrimination.Journal of Evaluation in Clinical Practice 24(5): 995–998.
doi:10.1111/jep.12894.
Condon, S. and Régnard, C. (2016). Les pratiques linguistiques: Langues apportées et langues transmises [Language practices: Transported and transmitted languages]. In: Beauchemin, C., Hamel, C., and Simon, P. (eds.). Trajectoires et origines: Enquête sur la diversité des populations en France. Paris: INED: 117– 144.
Crimmins, E.M., Soldo, B.J., Kim, J.K., and Alley, D.E. (2005). Using anthropometric indicators for Mexicans in the united states and Mexico to understand the
selection of migrants and the ‘Hispanic paradox.’Social Biology 52(3–4): 164–
177.doi:10.1080/19485565.2005.9989107.
De Grande, H. (2015). Brussels: Young and healthy?! Educational inequalities in health and mortality among young persons in the Brussels-capital region [PhD thesis]. Brussels: Vrije Universiteit Brussel, Department of Sociology.
De Grande, H., Vandenheede, H., Gadeyne, S., and Deboosere, P. (2014). Health status and mortality rates of adolescents and young adults in the Brussels-capital region: Differences according to region of origin and migration history.
Ethnicity and Health 19(2): 122–143.doi:10.1080/13557858.2013.771149.
Elo, I.T. (2009). Social class differentials in health and mortality: Patterns and
explanations in comparative perspective. Annual Review of Sociology 35: 553–
572.doi:10.1146/annurev-soc-070308-115929.
European Commission (2017). Council recommendation on the 2017 National Reform Programme of France and delivering a council opinion on the 2017 Stability Programme of France. Luxembourg: Publications Office of the European Union.
https://eur-lex.europa.eu/legal-content/EN/TXT/PDF/?uri=CELEX:52017 DC0509&from=EN.
Guillot, M., Khlat, M., Elo, I.T., Solignac, M., and Wallace, M. (2018). Understanding age variations in the migrant mortality advantage: An international comparative
perspective.PLoS ONE 13(6): e0199669.doi:10.1371/journal.pone.0199669.
Gushulak, B. (2007). Healthier on arrival? Further insight into the ‘healthy immigrant
effect.’Canadian Medical Association Journal 176(10): 1439–1440.doi:10.150
Harding, S. and Balarajan, R. (1996). Patterns of mortality in second generation Irish
living in England and Wales: Longitudinal study. British Medical Journal
312(7043): 1389–1392.doi:10.1136/bmj.312.7043.1389.
Heath, A. and Li, Y. (2008). Period, life-cycle and generational effects on ethnic
minority success in the British labour market.Kölner Zeitschrift für Soziologie
und Sozialpsychologie 48: 277–306.
INSEE (2012). Immigrés et descendants d’immigrés en France: INSEE références. Paris: INSEE.
Jervelund, S.S., Malik, S., Ahlmark, N., Villadsen, S.F., Nielsen, A., and Vitus, K. (2017). Morbidity, self-perceived health and mortality among non-Western immigrants and their descendants in Denmark in a life phase perspective.
Journal of Immigrant and Minority Health 19(2): 448–476.
doi:10.1007/s10903-016-0347-9.
Khlat, M. and Courbage, Y. (1996). Mortality and causes of death of Moroccans in
France, 1979–91.Population 8: 59–94.
Khlat, M. and Darmon, N. (2003). Is there a Mediterranean migrants mortality paradox
in Europe?International Journal of Epidemiology 32(6): 1115–1118.doi:10.109
3/ije/dyg308.
Lebeaux, M.-O. and Degenne, A. (1991). L’entraide entre les ménages: Un facteur
d’inégalité sociale? Sociétés Contemporaines 8(4): 21–42. doi:10.3406/socco.
1991.1017.
Lefèvre, C. and Filhon, A. (2005). Histoires de familles, histoires familiales: Les résultats de l’enquête famille de 1999. Paris: INED (Cahiers de l’INED 156). Lynch, J.W., Smith, G.D., Kaplan, G.A., and House, J.S. (2000). Income inequality and
mortality: Importance to health of individual income, psychosocial environment,
or material conditions.BMJ 320: 1200–1204.doi:10.1136/bmj.320.7243.1200.
Manhica, H., Toivanen, S., Hjern, A., and Rostila, M. (2015). Mortality in adult
offspring of immigrants: A Swedish national cohort study. PLoS ONE 10(2):
e0116999.doi:10.1371/journal.pone.0116999.
Marry, C., Fournier-Mearelli, I., and Kieffer, A. (1995). Activité des jeunes femmes:
Héritages et transmissions. Economie et Statistique 283–284(3/4): 67–79.
Meurs, D., Lhommeau, B., and Okba, M. (2016). Emplois, salaires et mobilité intergénérationnelle [Jobs, wages, intergenerational mobility]. In: Beauchemin, C., Hamel, C., and Simon, P. (eds.). Trajectoires et origines: Enquête sur la diversité des populations en France. Paris: INED: 117–144.
Meurs, D., Pailhé, A., and Simon, P. (2006). The persistence of intergenerational inequalities linked to immigration: Labour market outcomes for immigrants and
their descendants in France. Population 61(5–6): 645–682. doi:10.3917/pope.
605.0645.
Moumen, A. (2010). De l’Algérie à la France: Les conditions de départ et d’accueil des
rapatriés, pieds-noirs et harkis en 1962.Matériaux pour l’histoire de notre temps
99(3): 60–68.
Palloni, A. and Arias, E. (2004). Paradox lost: Explaining the Hispanic adult mortality
advantage.Demography 41(3): 385–415.doi:10.1353/dem.2004.0024.
Palloni, A. and Morenoff, J.D. (2001). Interpreting the paradoxical in the Hispanic
paradox: Demographic and epidemiologic approaches. Population Health and
Aging 954(1): 140–174.doi:10.1111/j.1749-6632.2001.tb02751.x.
Paradies, Y. (2006). A systematic review of empirical research on self-reported racism
and health.International Journal of Epidemiology 35(4): 888–901.doi:10.1093/
ije/dyl056.
Preston, S.H., Heuveline, P., and Guillot, M. (2001). Demography: Measuring and
modeling population processes. Malden: Blackwell.
Razum, O., Zeeb, H., Akgun, H.S., and Yilmaz, S. (1998). Low overall mortality of Turkish residents in Germany persists and extends into a second generation:
Merely a healthy migrant effect? Tropical Medicine and International Health
3(4): 297–303.doi:10.1046/j.1365-3156.1998.00233.x.
Richard, J.-L. (2004).Partir ou rester? Les destinées des jeunes issus de l’immigration
étrangère en France. Paris: Presses Universitaires de France.
Riosmena, F., Wong, R., and Palloni, A. (2013). Migration selection, protection, and
acculturation in health: A binational perspective on older adults. Demography
50(3): 1039–1064.doi:10.1007/s13524-012-0178-9.
Scott, A.P. and Timæus, I.M. (2013). Mortality differentials 1991–2005 by
self-reported ethnicity: Findings from the ONS Longitudinal Study. Journal of
Epidemiology and Community Health 67(9): 743–750.
Silberman, R. and Fournier, I. (1999). Les enfants d’immigrés sur le marché du travail:
Les mécanismes d’une discrimination sélective. Formation Emploi 65(1): 31–
55.doi:10.3406/forem.1999.2333.
Simon, P. (2015). The choice of ignorance: The debate on ethnic and racial statistics in
France. In: Simon, P., Piché, V., and Gagnon, A.A. (eds.).Social statistics and
ethnic diversity: Cross-national perspectives in classifications and identity
politics. Cham: Springer: 65–87.doi:10.1007/978-3-319-20095-8_4.
Tarnutzer, S., Bopp, M., and Grp, S.S. (2012). Healthy migrants but unhealthy
offspring? A retrospective cohort study among Italians in Switzerland. BMC
Public Health 12(1104): 1–8.doi:10.1186/1471-2458-12-1104.
Tribalat, M. (2004). An estimation of the foreign-origin populations of France in 1999.
Population59(1): 49–79.doi:10.3917/pope.401.0049.
Vandenheede, H., Willaert, D., De Grande, H., Simoens, S., and Vanroelen, C. (2015). Mortality in adult immigrants in the 2000s in Belgium: A test of the
‘healthy-migrant’ and the ‘migration-as-rapid-health-transition’ hypotheses. Tropical
Medicine and International Health 20(12): 1832–1845.doi:10.1111/tmi.12610.
Vang, Z.M., Sigouin, J., Flenon, A., and Gagnon, A. (2017). Are immigrants healthier than native-born Canadians? A systematic review of the healthy immigrant
effect in Canada. Ethnicity and Health 22(3): 209–241. doi:10.1080/
13557858.2016.1246518.
Wallace, M. (2016). Adult mortality among the descendants of immigrants in England and Wales: Does a migrant mortality advantage persist beyond the first
generation? Journal of Ethnic and Migration Studies 42(9): 1558–1577.
doi:10.1080/1369183X.2015.1131973.
Wallace, M., Guillot, M., and Khlat, M. (2019). Disparities in infant mortality among
children of immigrants in France, 2008–2017. Paper presented at PAA 2019, Austin, TX, USA, April 11, 2019.
Zufferey, J. (2016). Investigating the migrant mortality advantage at the intersections of
social stratification in Switzerland: The role of vulnerability. Demographic
Appendix
This appendix presents supplementary information for assessing the robustness of the paper’s results to various data quality issues (Sections 1–5) and model specifications (Sections 6–7).
The overall conclusion of this sensitivity analysis is that despite various data
quality issues inherent to theEchantillon Longitudinal de Mortalité (ELM), this data set
appears as a reliable source for mortality estimation (Section 5). Moreover, patterns of case exclusion resulting from missing data and other issues suggest that the paper’s main result is conservative, that is, that the excess mortality we find among second-generation (G2) immigrant males of North African origin likely underestimates the true amount of excess mortality for this group (Sections 3–4).
1. Response rate in the EHF
TheEtude de l’Histoire Familiale (EHF) was conducted at the same time as the 1999
census with an average sampling rate of 1/170 for males and 1/110 for females. (Females were oversampled as they were the focus of many of the planned analyses in the EHF.) Eligible individuals were provided with the EHF questionnaire along with the usual census questionnaire. The overall response rate in the EHF (i.e., the proportion of EHF-eligible individuals who completed the census form and also answered the EHF questionnaire) was 79.4%, a response rate that is on par with other large sample surveys commonly used in this literature. An analysis of the probability of response using census variables as explanatory variables shows a lower response among individuals ages 85 and older, individuals who were unmarried, individuals born abroad, or individuals who did not report their level of education in the census (Lefèvre and Filhon 2005).
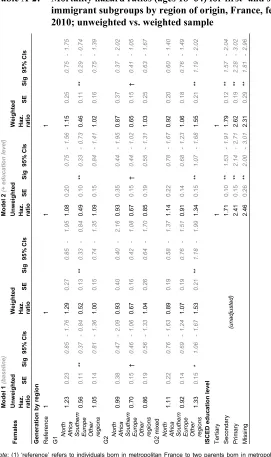
Table A-1: Mortality hazard ratios (ages 18–64) for first- and second-generation immigrant subgroups by region of origin, France, males, 1999–2010; unweighted vs. weighted sample
Notes: (1) ‘reference’ refers to individuals born in metropolitan France to two parents born in metropolitan France; (2) significance levels at ** p < 0.01, * p < 0.05, and † p< 0.10.
Males Model 1 (baseline) Model 2 (+ educati on level) Unweighted Weighted Unweighted Weighted Haz . ratio SE Sig 95 % C Is Haz . ratio SE Sig 95 % C Is Haz . ratio SE Sig 95 % C Is Haz . ratio SE Sig 95 % C Is
Generation by region Refere
Table A-2: Mortality hazard ratios (ages 18–64) for first- and second-generation immigrant subgroups by region of origin, France, females, 1999– 2010; unweighted vs. weighted sample
Note: (1) ‘reference’ refers to individuals born in metropolitan France to two parents born in metropolitan France; (2) significance levels at ** p < 0.01, * p < 0.05, and † p< 0.10.
Fem ales Model 1 (baseline) Model 2 (+ educati on level) Unweighted Weighted Unweighted Weighted Haz . ratio SE Sig 95 % C Is Haz . ratio SE Sig 95 % C Is Haz . ratio SE Sig 95 % C Is Haz . ratio SE Sig 95 % C Is
Generation by region Refere
2. Missing data in the EHF sample
Our results exclude EHF individuals who could not be allocated to a specific population group due to missing values on the relevant variables (place of birth, parental place of birth, languages, and nationality at birth). Figures A-1 and A-2 show the process of subgroup attribution and the extent of missing data at each step. In these figures, the missing cases in a given box correspond to individuals who had missing values on variables needed for the attribution of categories at the same level.
Among males, a total of 14,405 individuals, or 12.1% of the total EHF sample of 119,473 individuals, had missing information on variables necessary for subgroup attribution. In terms of proportion missing among non-missing individuals in the previous level, the largest percentage is for individuals born in France who didn’t report the necessary information for allocation in a specific reference or G2 category (9.6%).
The amount of missing data was slightly lower for females. Out of a total of 183,814 females in the EHF, 20,064 (10.9%) had missing information for subgroup attribution. Among females born in France, 8.3% could not be attributed to a specific reference or G2 category.
Figure A-1: Flow chart representing how individuals in the EHF are attributed to different population subgroups, males
Note: G1 = first generation; G2 = second generation; G2m = mixed second generation. N.Afr = North African origin: S.Eur = southern European origin. G1/G2 N.Afr Def 1: first- or second-generation immigrants of North African origin, based on country of birth information only. G1/G2 N.Afr Def 2: first- or second-generation immigrants of North African origin, based on country of birth, language, and nationality information (see text for details).
Males EHF 18-64 119,473
Born in France 103,806 Born Abroad
11,235
Missing 4,432
G1 N.Afr Def1 4,600 G1 S.Eur
2,623
G1 Other 4,012
G1 N.Afr Def 2 2,688 Repatriates
1,869
Missing 43
Reference 81,504
G2 S.Eur 2,072
G2m S.Eur 2,430
G2 N.Afr Def1 1,597
G2m N.Afr 2,055
G2 Other 1,275
G2m Other 2,959
Missing 9,914
G2 N.Afr Def2 1,010
Missing 16 Children of
Repatriates 571
3.7%
0.9%
9.6%
Figure A-2: Flow chart representing how individuals in the EHF are attributed to different population subgroups, females
Note: See Figure A-1.
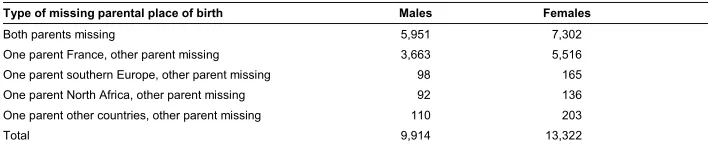
Table A-3 shows how these native-born individuals with missing information for G2 vs. reference subgroup attribution were distributed according to the type of missing information (paternal and/or maternal place of birth).
Table A-3: Distribution of native-born individuals in the EHF with missing paternal and/or maternal country of birth
Type of missing parental place of birth Males Females
Both parents missing 5,951 7,302
One parent France, other parent missing 3,663 5,516
One parent southern Europe, other parent missing 98 165 One parent North Africa, other parent missing 92 136 One parent other countries, other parent missing 110 203
Total 9,914 13,322
While the majority of these missing cases had missing place of birth for both parents, a large proportion of these missing cases declared one parent born in France (36.9% for males and 41.4% for females). While we cannot attribute these individuals to a specific subgroup category, we do know that they do not belong to the two main G2 categories of interest in the paper (G2 southern Europe and G2 North Africa).
Females EHF 18-64 183,814
Born in France 159,835 Born Abroad
17,330
Missing 6,649
G1 N.Afr Def1 6,417 G1 S.Eur
4,115
G1 Other 6,798
G1 N.Afr Def 2 3,447 Repatriates
2,889
Missing 81
Reference 127,221
G2 S.Eur 3,243
G2m S.Eur 3,841
G2 N.Afr Def1 1,597
G2m N.Afr 3,196
G2 Other 2,059
G2m Other 4,517
Missing 13,322
G2 N.Afr Def2 1,488
Missing 12 Children of
Repatriates 946
3.6%
1.3%
8.3%
However, they may or may not belong to the reference category (born in France to two parents born in France).
In order to examine the robustness of our results to this specific type of missing information (one parent France, other parent missing), we estimated our main model using two extreme scenarios: (1) a scenario in which none of these individuals belong to the reference category; (2) a scenario in which all of these individuals belong the reference category.
The first scenario is examined in a model treating native-born individuals with one parent born in France and the other parent with missing country of birth (one parent France, one unknown) as a separate category. Results from this model are shown in Table A-4. The second scenario is examined in a version of the model that includes all these individuals in the reference category. Results are shown in Table A-5.
Results show that while these G2 missing cases have higher mortality than the reference category (Table A-4), the hazard ratios for G2 subgroups of interest are robust to these different model specifications (Tables A-4 and A-5). In particular, the excess mortality among G2 North African males and the mortality advantage among G2 southern European males discussed in the paper are not affected by the choice of scenario for handling these G2 missing cases. While this robustness test does not address all the G2 missing cases, it addresses a substantial portion of them. The remaining cases with missing parental place of birth not addressed by this robustness test are 6,251 for males (6.0% of all native-born males) and 7,806 for females (4.9% of all native-born females).
Table A-4: Mortality hazard ratios (ages 18–64) for first- and second-generation immigrant subgroups by region of origin, France, 1999–2010; native-born individuals with ‘one parent France, one unknown’ (G2
missing) treated as separate category
Model 1 (baseline) Model 2 (+ education level)
Haz.
ratio SE Sig 95% CIs
Haz.
ratio SE Sig 95% CIs Males
Generation by region
Reference 1 1
G1
North Africa 0.79 0.11 † 0.60 – 1.03 0.69 0.09 ** 0.53 – 0.90
Southern Europe 0.73 0.10 * 0.57 – 0.93 0.61 0.08 ** 0.48 – 0.78
Other regions 0.80 0.10 † 0.64 – 1.00 0.84 0.10 0.67 – 1.06
G2
North Africa 1.82 0.39 ** 1.19 – 2.77 1.67 0.36 ** 1.09 – 2.55
Southern Europe 0.64 0.11 ** 0.46 – 0.88 0.61 0.10 ** 0.44 – 0.85
Table A-4: (Continued)
Model 1 (baseline) Model 2 (+ education level)
Haz.
ratio SE Sig 95% CIs Haz.ratio SE Sig 95% CIs Males
G2 mixed
North Africa 0.94 0.15 0.69 – 1.30 0.98 0.16 0.71 – 1.35
Southern Europe 0.81 0.10 † 0.64 – 1.02 0.78 0.09 * 0.61 – 0.99
Other regions 1.01 0.10 0.83 – 1.22 1.05 0.10 0.87 – 1.26
G2 missing
One parent France, one
unknown 1.24 0.11 ** 1.05 – 1.46 1.15 0.10 † 0.98 – 1.37
ISCED education level
(unadjusted)
Tertiary 1
Secondary 1.74 0.10 ** 1.56 – 1.93
Primary 2.47 0.15 ** 2.20 – 2.77
Missing 2.44 0.25 ** 2.00 – 2.97
Females
Generation by region
Reference 1 1
G1
North Africa 1.23 0.23 0.85 – 1.76 1.09 0.20 0.76 – 1.56
Southern Europe 0.56 0.12 ** 0.37 – 0.84 0.49 0.10 ** 0.33 – 0.74
Other regions 1.05 0.14 0.81 – 1.36 1.09 0.14 0.84 – 1.41
G2
North Africa 0.99 0.38 0.47 – 2.08 0.93 0.35 0.44 – 1.95
Southern Europe 0.70 0.15 † 0.46 – 1.06 0.67 0.14 † 0.44 – 1.03
Other regions 0.86 0.19 0.56 – 1.33 0.85 0.19 0.55 – 1.31
G2 mixed
North Africa 1.11 0.22 0.76 – 1.62 1.14 0.22 0.78 – 1.67
Southern Europe 0.91 0.14 0.69 – 1.24 0.92 0.14 0.68 – 1.23
Other regions 1.33 0.15 ** 1.06 – 1.67 1.34 0.15 ** 1.07 – 1.68
G2 missing
One parent France, one
unknown 1.45 0.16 ** 1.17 – 1.79 1.37 0.15 ** 1.11 – 1.70
ISCED education level
(unadjusted)
Tertiary 1
Secondary 1.44 0.10 ** 1.26 – 1.65
Primary 1.82 0.13 ** 1.57 – 2.10
Missing 2.08 0.26 ** 1.63 – 2.65
Table A-5: Mortality hazard ratios (ages 18–64) for first- and second-generation immigrant subgroups by region of origin, France, 1999–2010; native-born individuals with ‘one parent France, one unknown’ included in the reference category
Model 1 (baseline) Model 2 (+ education level)
Haz.
ratio SE Sig 95% CIs Haz.ratio SE Sig 95% CIs Males
Generation by region
Reference 1 1
G1
North Africa 0.78 0.11 † 0.60 – 1.02 0.68 0.09 ** 0.52 – 0.89
Southern Europe 0.72 0.10 * 0.56 – 0.93 0.60 0.08 ** 0.47 – 0.77
Other regions 0.79 0.10 * 0.63 – 0.99 0.84 0.10 0.67 – 1.05
G2
North Africa 1.80 0.39 ** 1.18 – 2.74 1.66 0.36 ** 1.09 – 2.53
Southern Europe 0.63 0.11 ** 0.45 – 0.87 0.61 0.10 ** 0.44 – 0.85
Other regions 1.04 0.16 0.77 – 1.41 1.03 0.16 0.77 – 1.40
G2 mixed
North Africa 0.94 0.15 0.68 – 1.29 0.97 0.16 0.70 – 1.34
Southern Europe 0.80 0.10 † 0.63 – 1.01 0.77 0.09 * 0.61 – 0.98
Other regions 1.00 0.10 0.83 – 1.21 1.04 0.10 0.86 – 1.25
ISCED education level
Tertiary
(unadjusted)
1
Secondary 1.74 0.10 ** 1.56 – 1.94
Primary 2.48 0.15 ** 2.21 – 2.78
Missing 2.45 0.25 ** 2.01 – 2.99
Females
Generation by region
Reference 1 1
G1
North Africa 1.21 0.22 0.84 – 1.73 1.07 0.20 0.74 – 1.54
Southern Europe 0.55 0.11 ** 0.37 – 0.82 0.48 0.10 ** 0.32 – 0.73
Other regions 1.03 0.14 0.80 – 1.34 1.07 0.14 0.83 – 1.39
G2
North Africa 0.97 0.37 0.46 – 2.05 0.91 0.35 0.43 – 1.92
Southern Europe 0.69 0.15 † 0.45 – 1.04 0.66 0.14 † 0.44 – 1.01
Other regions 0.85 0.19 0.55 – 1.31 0.84 0.18 0.55 – 1.29
G2 mixed
North Africa 1.09 0.21 0.74 – 1.60 1.12 0.22 0.77 – 1.64
Southern Europe 0.91 0.14 0.68 – 1.22 0.91 0.14 0.67 – 1.21
Other regions 1.31 0.15 ** 1.05 – 1.64 1.32 0.15 ** 1.06 – 1.66
ISCED education level
Tertiary
(unadjusted)
1
Secondary 1.45 0.10 ** 1.27 – 1.65
Primary 1.83 0.13 ** 1.59 – 2.11
Missing 2.11 0.26 ** 1.65 – 2.69
3. Missing survival status among EHF individuals
The results presented in the paper are based on the ELM data set, which includes only those EHF individuals who could be matched with the RNIPP (National Directory for the Identification of Natural Persons), as explained in the paper. Individuals who could not be matched with the RNIPP had an unknown survival status and were thus excluded from the final sample. As explained in the paper, the matching procedure was based on information on first and last names as well as date of birth.
The overall proportion of the EHF individuals who could be matched with the RNIPP is 87.3% for males and 76.3% for females. Tables A-6 and A-7 show proportions matched for each of the subgroups identified in the above flowcharts. Results for males show that the proportions matched were highest for the reference population (90.9%) and lowest for the foreign-born groups (68.2% for G1 southern Europe and 61.0% for G1 North Africa). Second-generation immigrant groups were somewhere in between, with 82.8% matched for G2 southern Europe and 75.5% for G2 North Africa. Repatriates, whether G1 or G2, had proportions matched that were close to the reference population, which is consistent with the expectation that a large majority of repatriates had French last names (vs. Arabic last names for the North African immigrants) that were likely more easily matched with the RNIPP.
Table A-6: Counts and proportions of EHF individuals matched with the RNIPP, by population subgroup; males
Males, EHF, 18–65
Generation by region of origin Total Matched
n %
Foreign-born
G1 southern Europe 2,623 1,788 68.2
G1 North Africa (Definition 1)
Definition 2 2,688 1,640 61.0 Repatriates 1,869 1,637 87.6
Missing 43 36 83.7
G1 other 4,012 2,419 60.3
Native-born
Reference population 81,504 74,096 90.9
G2 southern Europe 2,072 1,715 82.8
G2 mixed southern Europe 2,430 2,144 88.2
G2 North Africa (Definition 1)
Definition 2 1,010 763 75.5
Repatriates 571 485 84.9
Missing 16 12 75.0
G2 mixed North Africa 2,055 1,810 88.1
G2 other 1,275 1,017 79.8
G2 mixed other 2,959 2,619 88.5
One parent born in France, other parent missing 3,641 3,194 87.7
Missing 6,273 5,210 83.1
Missing 4,432 3,722 84.0
Total 119,473 104,307 87.3
Table A-7: Counts and proportions of EHF individuals matched with the RNIPP, by population subgroup; females
Females, EHF, 18–65
Generation by region of origin Total Matched
n %
Foreign-born
G1 southern Europe 4,115 2,094 50.9
G1 North Africa (Definition 1)
Definition 2 3,447 1,594 46.2 Repatriates 2,889 2,110 73.0
Missing 81 47 58.0
G1 other 6,798 3,566 52.5
Native-born
Reference population 127,211 101,620 79.9
G2 southern Europe 3,243 2,408 74.3
G2 mixed southern Europe 3,841 3,057 79.6
G2 North Africa (Definition 1)
Definition 2 1,488 1,045 70.2
Repatriates 946 730 77.2
Missing 12 10 83.3
G2 mixed North Africa 3,196 2,635 82.4
G2 other 2,059 1,487 72.2
G2 mixed other 4,517 3,547 78.5
One parent born in France, other parent missing 5,478 4,149 75.7
Missing 7,844 5,320 67.8
Missing 6,649 4,921 74.0
Total 183,814 140,340 76.3
Note: See Table A-6.
Table A-8: Logistic regression for the probability of being unmatched with the RNIPP, EHF 1999
Males Females
HR S.E. Sig 95% CIs HR S.E. Sig 95% CIs Generation by region of origin
Ref 1 1
G2
North Africa 2.97 0.23 ** 2.56 – 3.46 2.62 0.16 ** 2.34 – 2.96 Southern Europe 1.82 0.12 ** 1.61 – 2.06 1.46 0.06 ** 1.34 – 1.59
Other 2.03 0.16 ** 1.74 – 2.36 1.48 0.08 ** 1.33 – 1.64
G2 mixed
North Africa 1.27 0.09 ** 1.10 – 1.46 1.19 0.06 ** 1.08 – 1.32 Southern Europe 1.18 0.08 ** 1.04 – 1.35 1.05 0.04 0.97 – 1.14
Other 1.17 0.07 ** 1.04 – 1.32 1.08 0.04 * 1.00 – 1.16
G1
North Africa 5.55 0.24 ** 5.10 – 6.04 4.01 0.15 ** 3.73 – 4.31 Southern Europe 4.10 0.18 ** 3.76 – 4.48 3.07 0.10 ** 2.88 – 3.28
Other 6.17 0.22 ** 5.76 – 6.62 3.56 0.09 ** 3.38 – 3.75
Age
18–24 1 1
25–29 1.14 0.05 ** 1.04 – 1.25 1.17 0.04 ** 1.09 – 1.26
30–34 1.18 0.06 ** 1.07 – 1.29 1.18 0.04 ** 1.10 – 1.26
35–39 1.16 0.06 ** 1.06 – 1.28 1.29 0.05 ** 1.20 – 1.39
40–44 1.21 0.06 ** 1.10 – 1.34 1.47 0.05 ** 1.37 – 1.58
45–49 1.29 0.06 ** 1.17 – 1.43 1.62 0.06 ** 1.52 – 1.75
50–54 1.30 0.07 ** 1.18 – 1.44 1.66 0.06 ** 1.54 – 1.78
55–59 1.28 0.07 ** 1.15 – 1.44 1.57 0.06 ** 1.45 – 1.70
60–64 1.22 0.09 ** 1.05 – 1.41 1.46 0.06 ** 1.34 – 1.59
ISCED education level
Tertiary 1 1
Secondary 1.12 0.03 ** 1.06 – 1.18 1.09 0.02 ** 1.05 – 1.12
Primary 1.40 0.05 ** 1.31 – 1.49 1.35 0.03 ** 1.30 – 1.41
Missing 2.22 0.11 ** 2.01 – 2.45 2.45 0.08 ** 2.30 – 2.62
Marital status
Single 1 1
Married 0.86 0.05 ** 1.31 – 0.90 2.14 0.04 ** 2.06 – 2.23
Widowed 1.00 0.03 1.06 – 1.26 2.96 0.11 ** 2.75 – 3.18
Divorced 0.95 0.11 2.01 – 1.05 2.14 0.06 ** 2.03 – 2.27
Economic activity
Employed 1 1
Studying 0.95 0.05 0.86 – 1.06 1.08 0.05 † 1.00 – 1.17
Unemployed 1.06 0.04 0.99 – 1.13 1.07 0.02 ** 1.03 – 1.13
Retired 0.89 0.05 * 0.80 – 1.00 1.09 0.03 ** 1.03 – 1.16
At home,
long-term sick 1.15 0.07 * 1.02 – 1.29 1.06 0.02 ** 1.03 – 1.10
The conclusion that the ELM produces conservative estimates of the true amount of excess mortality for G2 North African–origin males is further supported by a comparison of education distributions for all individuals (whether matched or unmatched in the RNIPP) vs. the education distributions for matched individuals only (i.e., those on the basis of whom mortality hazard ratios are estimated). Results (Table A-9) show that for the reference population and G2 southern Europe, there is little distortion in educational distribution for the matched sample vs. the entire EHF sample. For the G2 North Africa group, however, the matched sample is substantially distorted toward higher education categories. The proportions with primary education for this group are indeed systematically lower in the matched sample than in the entire EHF sample. This further suggests that the excess mortality we find for second-generation North African–origin males underestimates the true amount of excess mortality for this group.
Table A-9: Distribution (%) of reference and second-generation immigrant subgroups by educational attainment, all EHF individuals vs. EHF individuals matched with the RNIPP
ISCED education level Reference G2 southern Europe G2 North Africa
All Matched All Matched All Matched Males
18–34
Primary 11.0 10.7 16.2 14.8 23.6 19.1
Secondary 63.7 63.8 66.5 67.6 64.3 63.2
Tertiary 25.3 25.6 17.3 17.6 12.1 17.7
Total 100.0 100.0 100.0 100.0 100.0 100.0
35–44
Primary 16.5 16.3 21.4 20.6 26.7 18.9
Secondary 63.8 63.9 65.0 63.5 52.0 56.8
Tertiary 19.7 19.9 13.7 15.9 21.3 24.3
Total 100.0 100.0 100.0 100.0 100.0 100.0
45–64
Primary 30.1 29.6 33.8 33.1 52.4 35.7
Secondary 53.2 53.3 53.2 54.1 38.1 50.0
Tertiary 16.8 17.1 13.0 12.9 9.5 14.3
Total 100.0 100.0 100.0 100.0 100.0 100.0
Females 18–34
Primary 10.0 9.4 13.7 12.2 18.6 14.8
Secondary 58.1 58.2 63.7 63.3 64.6 62.3
Tertiary 31.9 32.4 22.7 24.5 16.9 22.9
Table A-9: (Continued)
ISCED education level Reference G2 southern Europe G2 North Africa
All Matched All Matched All Matched Females
35–44
Primary 18.8 17.7 19.5 18.8 24.1 17.8
Secondary 58.3 58.6 64.2 65.1 61.6 60.1
Tertiary 23.0 23.7 16.3 16.1 14.3 22.1
Total 100.0 100.0 100.0 100.0 100.0 100.0
45–64
Primary 40.7 40.0 47.0 47.3 63.9 44.4
Secondary 45.5 46.2 45.9 46.3 25.0 42.6
Tertiary 13.8 13.9 7.1 6.5 11.1 13.0
Total 100.0 100.0 100.0 100.0 100.0 100.0
4. Impact of out-migration on mortality estimates
As explained in the text, the ELM does not contain information on international out-migrations. As a result, individuals who leave France during the follow-up period (1999–2010) erroneously remain in the risk pool, producing a downward bias in mortality rates. This is a classic bias inherent to many studies in this literature (Palloni and Arias 2004). In the paper, we explain that G2 individuals are more likely to out-migrate than individuals with no immigration background, implying that the downward bias in mortality rates will be larger for G2 individuals than for the reference population. We conclude that the excess mortality we find among G2 North African males cannot be explained by a lack of information on international out-migrations.
Results are shown in Figure A-3. In this figure, the baseline scenario with an out-migration rate of 0% produces results that correspond to those presented in the paper, which is expected given that the paper does not adjust for out-migration. (The use of a Poisson framework here produces almost identical results as the Gompertz framework used in the paper.) When out-migration is introduced, the incidence ratios systematically increase, illustrating the point made in the paper that our hazard ratios underestimate true hazard ratios whenever G2 groups experience more out-migration than the reference population. Results for G2 North African males confirm the paper’s conclusion that our lack of information on out-migrations produces conservative estimates of the true hazard ratios for this population. Interestingly, our simulations also show that the mortality advantage we find among G2 southern European males is also unlikely to be explained by out-migration. Even in a scenario in which 15% of individuals at baseline leave by the end of the observation period, incidence rate ratios for this group would still remain below 1 and statistically significant. Results for females show that incidence rate ratios remain insignificant whatever the amount of assumed out-migration.
A different type of mechanism that could potentially affect our mortality estimates involves selective out-migration of healthier G2 individuals prior to the baseline year of 1999. Indeed, if such selective out-migration was taking place before 1999, this would make the baseline sample in 1999 less healthy than in the absence of out-migration, potentially generating an upward bias in mortality estimates. The importance of this mechanism is difficult to assess in the absence of longitudinal follow-up since birth. However, it is unlikely that the excess mortality we observe during the follow-up period among G2 North African–origin males would be explained by this mechanism, because out-migration among this population, while higher than for the reference population, is estimated to be rather small (Richard 2004). Also, a recent study has shown that the mortality disadvantage among second-generation North African individuals is already observed at infant ages, a result that cannot be explained by left-truncation bias (Wallace, Guillot, and Khlat 2019).
5. Overall quality of the ELM for mortality estimation purposes
The previous sections examine the robustness of our mortality estimates to various sources of errors in the ELM. In this section, we examine the overall quality of the ELM data for mortality estimation purposes by comparing ELM-based adult mortality estimates with mortality estimates based on official exhaustive census and vital registration (VR) data. This unlinked data forms the basis for the calculation of official life tables in France and thus constitutes a useful comparison point for evaluating the ELM-based mortality data.
This comparison is possible for only the native-born and the foreign-born, since G2 status cannot be derived from the information available on death certificates. We were able to access VR death data by nativity for 2005–2009, a period that is not exactly the same but overlaps with the time frame of the ELM (1999–2010). Exposure terms by sex and nativity for the period 2005–2009 were derived from census information. Deaths and exposure terms were then combined to calculate age-specific mortality rates, which were then converted into probabilities of dying between age 18 and 65 using standard life table methodologies. (For more information about these sources, see Guillot et al. 2018.)