Chairman
Jalal Shayegan Professor, Sharif University of Technology, Iran
Editor-in-Chief
Jafar Towfighi Professor, Tarbiat Modares University, Iran
Executive Director Leila Sadafi-Nejad (M.Sc.)
EDITORIAL BOARD
Abbasian, J. (Associate Professor, Illinois Institute of Technology, USA)
Badakhshan, A. (Emeritus Professor, University of Calgary, Canada)
Barikani, M. (Professor, Iran Polymer and Petrochemical Institute, Iran)
Jafari Nasr, M.R. (Associate Professor, Research Institute of Petroleum Industry (RIPI), Iran)
Kargosha, K. (Associate Professor, Chemistry & Chemical Engineering Research Center of Iran (CCERCI), Iran) Karimi, I.A. (Professor, National University of Singapore,
Singapore)
Madaeni, S.S. (Professor, Razi University, Iran)
Mansoori, G.A. (Professor, University of Illinois at Chicago, USA)
Moghaddas, J.S. (Professor, Sahand University of Technology, Iran)
Mohammadi, T. (Professor, Iran University of Science and Technology, Iran)
Moosavian, M.A. (Professor, University of Tehran, Iran) Moshfeghian, M. (Professor, Shiraz University, Iran)
Movagharnejad, K. (Associate Professor, Babol University of Technology, Iran)
Omidkhah, M.R. (Professor, Tarbiat Modares University, Iran) Pahlavanzadeh, H. (Professor, Tarbiat Modares University,
Iran)
Panjeshahi, M.H. (Professor, University of Tehran, Iran) Pazouki, M. (Associate Professor, Materials and Energy
Research Center (MERC), Iran)
Rahimi, R. (Professor, University of Sistan and Baluchestan, Iran)
Rashidi, F. (Professor, Amirkabir University of Technology, Iran)
Rashtchian, D. (Professor, Sharif University of Technology, Iran)
Shariaty-Niassar, M. (Professor, University of Tehran, Iran) Shayegan, J. (Professor, Sharif University of Technology, Iran) Shojaosadati, S.A. (Professor, Tarbiat Modares University,
Iran)
Soltanmohammadzadeh, J.S. (Associate Professor, University of Saskatchewan, Canada)
Towfighi, J. (Professor, Tarbiat Modares University, Iran)
INTERNATIONAL ADVISORY BOARD Arastoopour, H. (Professor, Illinois Institute of Technology,
USA)
Ataai, M.M. (Professor, University of Pittsburgh, USA) Barghi, Sh. (Assistant Professor, University of Western
Ontario,Canada)
Chaouki, J. (Professor, University of Polytechnique Montréal, Canada)
Ein-Mozaffari, F. (Associate Professor, Ryerson University, Canada)
Farnood, R.R. (Professor, University of Toronto, Canada) Jabbari, E. (Associate Professor, University of South Carolina,
USA)
Jand, N. (Assistant Professor, Universita de L’Aquila, Italy)
Lohi, A. (Professor, Ryerson University, Canada)
Moghtaderi, B. (Professor, University of Newcastle, Australia) Mohseni, M. (Associate Professor, University of British
Columbia, Canada)
Nassehi, V. (Professor, Loughborough University, UK) Noureddini, H. (Associate Professor, University of Nebraska,
USA)
Rohani, S. (Professor, University of Western Ontario, Canada) Shahinpoor, M. (Professor, University of Maine, USA) Soroush, M. (Professor, Drexel University, USA)
Taghipour, F. (Associate Professor, University of British Columbia, Canada)
* This journal is indexed in the Scientific Information Database (www.SID.ir). * This journal is indexed in the Iranian Magazines Database (www.magiran.com).
* This journal is indexed in the Regional Information Center for Science & Technology (www.srlst.com)
Editor:
Sheryl Nikpour
Art & Design:
Nahid Aghamirzaei
Iranian Association of Chemical Engineers, Unit 11, No. 13 (Block 3), Maad Building, Shahid Akbari Boulevard, Azadi Ave., Tehran - Iran.
Vol. 10, No. 1 (Winter), 2013, IAChE
3-15 Modelling and Experimental Study of Wax Deposition in Transportation Line Using a
Flow Loop System
A. Shahrabadi, M. Sadi, S. S. Hendi, B. Dabir
16 -29 Thermal Stability and Dynamic Mechanical Properties of Nano and Micron-TiO2 Particles Reinforced Epoxy Composites: Effect of Mixing Method
L. Rajabi, Z. Mohammadi, A. A. Derakhshan
30-44 Electro-Coalescence of an Aqueous Droplet at an Oil–Water Interface with an Investigation of Secondary Droplets Formation
S. H. Mousavi, M. Shariaty-Niassar, H. Bahmanyar, M. A. Moosavian
45-54 Nonequilibrium Dynamic Modeling of Hydrogen Sulfide Absorption Using Diglycolamine Solution
A. Ghaemi, Sh. Shahhosseini
55 -66 Study of Flow Behavior of Ultrafine Particles Agglomerations in the Riser
J. Zheng, X. Zhu, Y. Wang, Ch. Xu
67 -78 Modeling and Simulation of Six-Bed Cyclic Adsorption Process Using in Mercaptan Removal from Natural Gas: Non-Isothermal and Non-Adiabatic Conditions
J. Esmaili, M. R. Ehsani
79-91 Effect of Different Nucleation and Growth Kinetic Terms on Modeling Results of
KNO3CMSMPR Crystallizer
A. Heidari, M. Shirvani
Modelling and Experimental Study of Wax Deposition in
Transportation Line Using a Flow Loop System
A. Shahrabadi1, M. Sadi1, S. S. Hendi1, B. Dabir2
1- Research Institute of Petroleum Industry, Tehran, Iran 2- Amirkabir University of Technology, Tehran, Iran
Abstract
The gelling of waxy crudes and the deposition of wax on the inner walls of pipelines present a costly problem in the production and transportation of oil. The object of the present study is to investigate the factors that affect the deposition of the paraffin wax on the pipe surface under different conditions using a flow loop system. A series of experiments on wax deposition from a mixture of waxy oil have been performed in a 65cm by 1cm ID flow loop in both laminar and turbulent flow regime. These experiments were done to study the effect of some important factors on the amount of deposited wax on the pipe wall. These factors consist of flow rate, residence time, wax concentration and temperature difference between mixture and pipe wall. It was found that the wax deposition increases with increasing temperature difference and residence time, but the effect of flow rate depends on flow regime. The other goal is mathematical modeling of wax deposition for a multi-component hydrocarbon mixture. The procedure for generating the model is described in detail. Finally, the results obtained from the model were compared with experimental data. It was found that there is an acceptable match between experimental and theoretical data and to some extent, this confirms the validity of the model and also the ability of the developed model to predict the wax deposition on pipelines under different operational condition.
Keywords:Wax, Deposition, Mathematical Model, Pipeline, Flow Loop System
1. Introduction
Wax Deposition is a complex and very costly problem for the petroleum industry, widely reported and studied by researchers in decades past [1-2]. Many crude oils in the world contain significant quantities of wax which will readily crystallize during the production, transportation and storage of the oil. Waxy crude oils are characterized by a
high content of paraffin, a mixture of heavy hydrocarbons called n-alkanes, usually ranging from C18 to C40. The presence of
tendency to aggregate. The formed agglomerates can result in an increase in oil viscosity by several orders of magnitude, oil gelation and deposition on pipeline walls. Since the temperatures at which paraffin crystallize are not extreme, the problem of paraffin crystallization affects most parts of the waxy crude oils that are found in nature. The temperature at which paraffin starts to crystallize is commonly known as cloud point or Wax Appearance Point (WAP), whereas the temperature at which crystals begin to agglomerate is usually called pour point. Pour point is typically 10-15o C lower than the cloud point. At temperature below the cloud point paraffin starts to crystallize. Deposition of wax on the wall of transportation pipe line is one of the serious and longstanding problems in the petroleum industry and has attracted the attention of many researchers. The factors known to affect the deposition of paraffin waxes on the surface of the pipelines from the flowing systems are: flow rates, residence time, wax concentration, temperature difference between solution cloud point and the pipe surface and pipe wall roughness.
Deposition of wax in the production of tubing and pipelines reduces operating efficiency and production, increases the cost of prevention and remediation, horsepower requirement and manpower needs. These can cause millions of dollars in losses every year. To avoid waxing, thermal techniques are applied by keeping the flowing-fluid temperature higher than the wax appearance temperature.
Some researchers have studied correlations between the properties of crude oils and their
deposition in both open and closed pipeline systems. They combined phase equilibrium, phase transition and fluid dynamics to model wax deposition in pipelines. They concluded in large coefficient of thermal expansion some components may separate and move in the opposite direction at temperature below wax appearance temperature. Hsu and Brubaker[11] developed a wax deposition scale up model. They considered the effect of molecular diffusion and shear dispersion to scale up the experimental results for waxy crude production lines. They concluded that the flow turbulence effect has significant impact on wax deposition and cannot be neglected in wax deposition modeling. Hamouda and Davidson[12] investigated the effect of flow rate on wax deposition. Their study revealed a significant change in the wax deposition rate when the flow shifts from laminar to turbulent flow. Creek et al. [13] concluded that the deposition rate decreases with increasing flow rate rather than increasing as suggested by a number of authors. Fogler et al. investigated the effect of pipe wall temperature on wax deposition [14]. They reported that an increase in the wall temperature results in a decrease in the deposit thickness. An increase of flow rate also has a similar effect. Kok and Saracouglu developed a mathematical model for estimation of wax deposition in pipelines[15]. They concluded as the temperature of the fluid declines along the pipelines, the wax mass fraction, solid-liquid equilibrium constant and wax thickness increases. Soleymaninazar et al. [16] developed a mathematical model both in laminar and turbulent flow regime. For
turbulent flow regime they used k to predict the velocity and temperature distribution. They reported in the turbulent flow regime that there is critical flow rate for any system. Increasing flow rate beyond the critical rate leads to decreasing the amount of deposit.
2. Theory and model formulation
When transporting waxy oil through a cold pipeline, wax will be deposited on the cold pipe wall through molecular diffusion, shear dispersion, Brownian and settling mechanisms. Our data shows that shear dispersion effect on wax deposition is not significant under laminar flow conditions. However, when flow velocity exceeds a certain value, shear effect becomes significant and affects wax deposition rate, especially under turbulent flow conditions. Molecular diffusion on wax deposition is discussed and a model is created. This mechanism is the driving force for the transportation of dissolved and precipitated paraffin to the pipeline wall. The driving force for the molecular diffusion at any time is the concentration gradient (x r)along
the direction r, where x is the mass density of the liquid phase at a certain location from the pipeline wall at a lateral distance r. According to Fick’s law the flux of the dissolved wax molecules is :
x m
J D
r
(1)
where
m
x m s
(2)
Where m and sare the mass density of the mixture and solid phase respectively. It should be remembered that m,sare considered as linear functions of the temperature. Equation (1) can be rewritten as:
x m T j D T r
(3)
Combining Equations(1) to (3):
1
1s m
m m s
m
w T T
J D T w
T T T r
(4)
s
w
is the weight fraction of total wax crystals in the mixture. Ifw
i andz
i are considered as the weight fraction and mole fraction of each component in the feed, we have :1 i i i n i i i z Mw w z Mw
(5)On the other hand, if the weight fraction of component i which is in the solid phase is considered as
w
ti, the following relation can be written:s i i
ti
i i
L S M w
z M
(6)
s
L is the number of moles of solid phase.
i
S is the mole fraction of each component in solid phase. According to the definition of solid liquid equilibrium K-value i
i i s K x
equation (6) is rewritten as follows:
1 1 s i x ti s i i x L K L w L K K L (7) x
L is the number of moles of liquid phase
and is the ratio of s x L
L
Erickson et al [17] and Won [18] presented the following model to calculate K-value:
exp 1 ,
1, 2,...,
f
i x i i
i f
i si i
c
s h T
K
x R T T
i n (8)
In derivation of the above equation, it is assumed that the temperature and pressure are in such a way that the amount of vapor moles can be ignored normally. The weight fraction of component i of solid phase which is in the mixture
w
si can be written by the following relation:1
s i i i s i i
si n i ti
i i i i
i
L S M w L S M
w w w
z M z M
(9)Combining Equations (7) and (9) we have:
1 1 1
n n
s si i
i i i
w w w
K
(10)Now we need ws T
to be substituted in Equation (4) to calculate the flux of wax crystals. So, at first wti
T
2 2 1 1 f x i i ti iL H K
T RT w T K
(11)
And from Equation (9) we have :
si si i
w w w
T T
(12)
At this point we define a dimensionless parameter
i as follows:
22 1 1 i i f i i si i K K RT h T L T w T w T (13)
Now we substitute i in Equation (4) and the result will be:
1 1 1 c c n n m i m m i i sii i m
T T
J J D w w
T T r
(14)In the above Equation, if J 0 there is no wax crystal deposition. It should be mentioned that the Wilke-Chang equation was used to calculate diffusion coefficient.
6 . 0 8 10 4 . 7 V Mw T Dm
(15)
Where is association factor and V is molar volume of wax.
The following equation was used for calculating the solution viscosity.
exp B
A T
(16)
As it is clear, the temperature gradient is needed to calculate the mass flux. Temperature distribution of the flowing oil sample is dependent upon the velocity profile. It was assumed that the behavior of waxy fluid can be described by power law model.
n z rz K Vr
(17)
So, the velocity profile inside the pipe can be expressed by the following equation:
1max 1
n n
z r
V r V
R
(18)
Where
max 3 1n 1
V V
n
(19)
V is the average velocity. Neglecting the axial conduction, frictional heating and heat source in energy balance equation the simplified energy equation for fully developed flow of fluid can be written as :
22 1z T T T
V r
z r r r
(20)
Substituting the velocity profile in Equation (20) and solving that equation with appropriate initial and boundary conditions, temperature distribution inside the pipe can be obtained. The following initial and boundary conditions were used:
0
0 ,
0
,0
r
in T R z T cte
T r
T r T cte
(21)
0
T is the temperature of inlet fluid. The above equation was solved numerically using implicit finite difference method. A computer program based on the above formulation has been developed for deposition of wax in transportation pipeline.
3. Experimental studies
1- oil reservoir 2- steel pipe 3- chilling circulator 4- flow meter 5- circulation pump 0
0.5 1 1.5 2 2.5 3 3.5 4
0 10 20 30 40 50 60 70
Temperature (o C)
Vi
sc
os
ity
(c
P)
3 % wax 4% wax 5% wax 10% wax
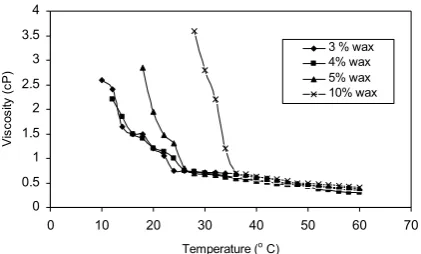
Figure 1. Temperature dependency of viscosity in different wax concentration.
After this work a flow loop was developed for wax depos ition research. Figure 2 shows the schematic flow diagram of this loop. This flow loop includes a chilling circulator, steel pipe, flow meter, circulation pump, oil reservoir and a data acquisition system. Test tube was 65 cm long with an inner diameter of 1cm through which the waxy fluid flows. The designed pipe was made from stainless steel and it was divided into six sections with the same length. So we were able to measure the wax deposited in each section. In other words, we could have the amount of wax deposit in different lengths. The procedure of the experiments is as follows. First, the waxy fluid is prepared by solving a specified amount of paraffin wax into toluene solvent and then transferring it into the tank. Waxy fluid is pumped inside the steel pipe at constant flow rate. There is a coolant fluid (a mixture of water and ethylenglycol) around the pipe for cooling the pipe wall down to a temperature below the WAP. The temperature of the heater and chiller and inlet flow rate of waxy fluid should be controlled. Waxy fluid is cooled down when it passes through the cold pipe and when the bulk temperature of waxy fluid reaches below
different mechanisms move toward the pipe wall. The waxy fluid is recirculated through the pipe following the same procedure. After a specified time the flow of waxy fluid is stopped and the steel pipe is evacuated from oil cut as the cold flow still exists. After complete evacuation pipe sections are detached from each other and all the sections are washed with hot toluene to gather the deposited wax on the pipe wall. The collected solution of each section is heated until the toluene is vaporized and solid wax remains. Thus the amount of wax deposited in each section of the pipe, and as a result total deposit in the pipe can be measured using a very accurate scale.
3 4 1
2
5
Figure 2.The schematic diagram of flow loop used in this work.
4. Results and discussion
In order to examine the effects of different parameters on wax precipitation, sensitivity analysis of different parameters was done by changing just one parameters and keeping the other parameters constant.
4-1. Temperature difference
results of this key parameter has been depicted in Fig. 3. As is clear with its trend, increasing this temperature difference causes an increase in the amount of wax precipitation, but it should be remembered that wax starts to precipitate in such a condition that the temperature of the pipe wall is lower than the solution temperature and WAP. Increasing the temperature difference increases the heat transfer rate and this factor increases the wax precipitation. One important point is that in the beginning, the rate of wax precipitation increases but by the passage of time the rate of wax precipitation decreases because of increasing the amount of wax precipitate. In other words, after some time the thickness of the wax layer increases, and this layer plays the role of insulator and this factor therefore decreases the rate of heat transfer.
Figure 3.The effect of temperature difference on total wax deposition in different wax concentration.
4-2. Flow rate
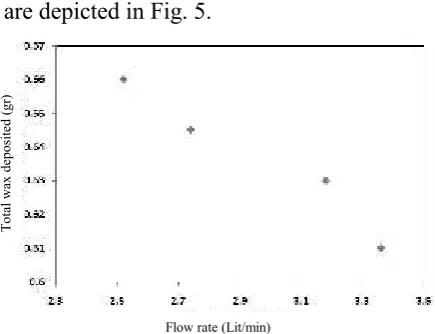
The other parameter studied is the flow rate of waxy fluid. The effect of this parameter in laminar flow regime is shown in Fig. 4. More solid particles exist in high flow rates and for this reason the heat transfer rate increases and so wax precipitation increases. But in
turbulent flow increasing the flow rate decreases wax precipitation rate and it can be resulted that there is another controlling mechanism in turbulent flow regime that controls the wax precipitation rate. Despite the fact that many studies intuitively attribute the reason to “shear removal”, Yingda Lu [19] and his group indentified three effects that give rise to an alternative explanation that has been overlooked in previous studies. They found that these three effects include the effect of the boundary layer thickness on mass transfer (effect 1), the diffusivity at the interface on
Figure 4. The effect of flow rate on total wax deposited in laminar flow regime.
mass transfer (effect 2), and the interface wax concentration on mass transfer (effect 3). Both effects 1 and 2 tend to increase the growth rate of the wax deposit, while effect 3 tends to have the opposite effect. The overall growth behavior of the wax deposit is the result of the competition between these three effects.The shear dispersion causes the wax deposit to detach from the pipe wall inside the bulk flow. Some experiments in turbulent flow regime were conducted and the results
Temperature difference (C)
Tot
al
w
ax
de
pos
ite
d
(gr
)
Tot
al
w
ax
de
pos
ite
d
(gr
)
Flow rate (Lit/min)
Tot
al
w
ax
de
pos
ite
d
(gr
are depicted in Fig. 5.
Figure 5.The effect of flow rate on wax deposition in turbulent flow regime.
3. Residence time
The effect of residence time on wax deposition for different wax content has been shown in Fig. 6. As expected, increasing time causes an increase in the amount of precipitation. The residence time permits more heat loss and leads to a lower oil temperature, which in turn leads to wax precipitation and deposition.
Figure 6. The effect of residence time on wax deposition.
4-4. Wax concentration in fluid
The effect of wax content in the feed on the total deposition of wax is shown in Fig. 7, where the y-axis corresponds to the
percentage of wax deposited. Increasing the concentration of wax in feed increases wax deposition. From the figure it can clearly be observed that the higher the paraffin content (the supersaturation level), the more wax deposit produced at any given time; the faster the deposition rates; and the quicker it reaches the 100% wax deposition. These results are well expected: with the increase of the paraffin wax content in solution, there are more wax molecules available to produce wax crystals.
Figure 7. The effect of wax concentration in feed on wax deposition.
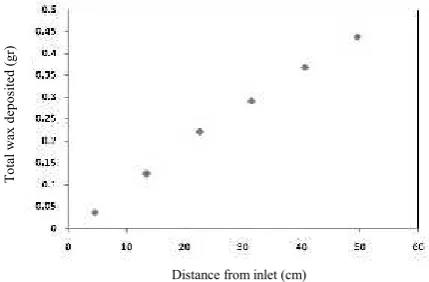
Fig. 8 presents the amount of wax deposition with respect to the length of pipe. Regarding this figure, increasing the length, the amount of wax increases as the distance from the inlet of the pipe leads to greater cooling on the fluid sample and then there is greater potential to form wax precipitate.
Residence time (min) Flow rate (Lit/min)
Tot
al
w
ax
de
pos
ite
d
(gr
)
Wax content in feed (%)
Tot
al
w
ax
de
pos
ite
d
(gr
Figure 8. The amount of wax deposited along the pipe.
At the end of this section, it should be noted that experiments for three cases were duplicated. The results of the duplicated experiments and the corresponding calculated errors showed that the average value of these
errors is 2.24% . Table 1 and Fig. 9 shows these results.
Figure 9.The results of three duplicated tests.
Table 1.The results of three duplicated tests.
Test No.
Temperature Wax Residence Flow Rate Wax Deposited (gr) Wax Deposited (gr) Error (%) Difference Content(%) Time(min) (Lit/min) first try second try
test1 25 4 60 0.4 0.523 0.508 2.87
test2 25 4 60 0.6 0.457 0.446 2.41
test3 30 3 60 0.4 0.554 0.546 1.44
average error 2.24
4-5. Comparing model results with
experimental data
In this section the results of the model are compared with the measured experimental data. The results of this part have been depicted in Tables 2-4 quantitatively and in Figs. 10-12. Experimental results are very well predicted by the simulated wax deposition model that shows the molecular diffusion is a dominant mechanism in the laminar flow.
Table 2. Comparison of the model and experimental
data. Effect of temperature difference. Temp
difference Experimental Model
Absolute error(%)
20 0.362 0.324 10.50
25 0.441 0.406 7.94
30 0.537 0.483 10.06
35 0.628 0.569 9.39
Table 3. Comparison of model and experi-mental data. Effect of flow rate.
Flow Rate
(Lit/min) Experimental Model
Absolute Error(%)
0.4 0.306 0.285 6.86
Tot
al
w
ax
de
pos
ite
d
(gr
)
Distance from inlet (cm) Total
w
ax
de
pos
ite
d
(gr
)
0.6 0.326 0.311 4.60
0.7 0.352 0.325 7.67
0.8 0.364 0.333 8.52
1.4 0.429 0.387 9.79
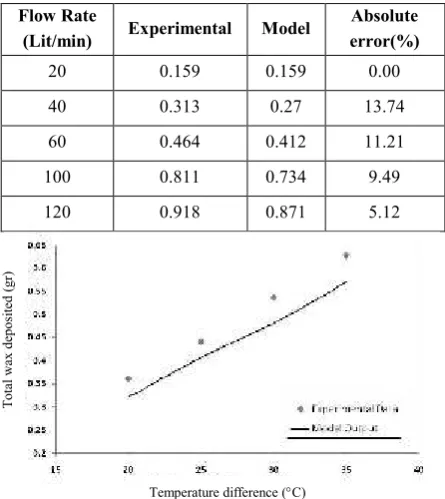
Table 4.Comparison of model and experimental data. Effect of residence time.
Flow Rate
(Lit/min) Experimental Model
Absolute error(%)
20 0.159 0.159 0.00
40 0.313 0.27 13.74
60 0.464 0.412 11.21
100 0.811 0.734 9.49
120 0.918 0.871 5.12
Figure 10.Comparison of the model and experimental data. Effect of temperature difference.
Figure 11. Comparison of model and experimental data. Effect of flow rate.
Figure 12. Comparison of model and experimental data. Effect of residence time.
As it can be observed in those Figures, the proposed model predicts the amount of wax deposition 6 to 13 percent less than real amount of wax. In order to analyze the accuracy of the experiments the following test was done. Four different samples were made by solving different percentage of wax in toluene which were then heated on a heater in order to vaporize the toluene and after weighting of the containers the amount of wax in any sample was measured. After that, the amount of initial added waxes were compared with the extracted waxes. The results have been shown in Fig. 13. In Fig. 3-4 percent difference is observed.
0.3861 0.5644
0.7733
1.2152
0 0.2 0.4 0.6 0.8 1 1.2 1.4
0 0.2 0.4 0.6 0.8 1 1.2 1.4
Wax in Feed(gr)
W
ax
M
ea
su
re
d(
gr
)
0.3998 0.5905
0.7974
1.2567
Figure 13. Comparison of the amount of wax in feed and wax measured.
So it can be said that 3-4 percent of disagreement between the results of model
Tot
al
w
ax
de
pos
ite
d
(gr
)
Temperature difference (C)
Tot
al
w
ax
de
pos
ite
d
(gr
)
Flow rate (Lit/min)
Tot
al
w
ax
de
pos
ite
d
(gr
)
Residence time (min)
W
ax
m
ea
sur
ed
(gr
)
and experimental data is related to the measurement error. Therefore our model has good capability for prediction of wax deposition in pipelines.
5. Conclusions
A detailed literature review on wax deposition problems was done in this paper. The main aim of this study was to investigate some problems related to the precipitation of the heavy organic material in oil pipelines. Noting that the main precipitates are waxes and asphaltenes, it was decided to focus on one of these namely, wax. Paraffin deposition flow loop system was designed to investigate the factors affecting wax deposition. Based on this target some experiments were done using a mixture of waxy oil. Then, using the available thermodynamic model and transport equations, an attempt was made to develop a computer program in order to predict the amount of wax precipitate. Finally, the results of the model and the experimental data were compared and good agreement between them was observed. The main conclusions of this work can be expressed as follow:
- In laminar flow regime, increasing the inlet flow rate intensifies the heat transfer rate and this causes more solid particles to form. In other words, increasing the flow rate increases wax precipitation rate.
- Increasing the temperature difference between inlet fluid and pipe increases the amount of wax precipitate and this is because of increasing heat transfer.
- Increasing the residence time increases the amount of wax precipitate.
- Inlet fluid samples have greater potential
for wax precipitation, therefore the amount of wax precipitation increases as the concentration of inlet fluid sample increases.
Nomenclature
A, B Constants in Equation (16) m
D Mass diffusion coefficient f
i
h Heat of fusion J Mass flux of wax
i
K Equilibrium constant
x
L Number of moles in liquid phase
s
L Number of moles in solid phase
i
Mw Molecular weight of component i r Radial distance
R Gas constant i
s Mole fraction of component i in the solid phase
f i
T Freezing temperature of component i
o
T Initial temperature
in
T Inlet temperature V Molar volume
z
V Velocity distribution
max
V Maximum velocity V Average velocity
s
w Weight fraction of total wax in the mixture
ti
w Weight fraction of component i in the solid phase
i
w Weight fraction of component i
i
x Mole fraction of component i in liquid phase
i
Greek Letters
xi
Activity coefficient of component i in liquid phase
si
Activity coefficient of component i in solid phase
1Lx
/Lxx
Mass density of liquid phase
m
Mass density of the mixture
s
Mass density of solid phase Viscosity
i
T wsi
T
rz
Shear stress
References
[1] Bilderback, C. A. and McDougall, L. A., "Complete paraffin control in petroleum production", SPE J. Petrol. Technol., 21, 1151–1156, (1963). [2] Haq, M. A., Deposition of paraffin wax
from its solution with hydrocarbons (USMS 10541), Society of Petroleum Engineers, (1978).
[3] Carmen García, M., Orea, M., Carbognani, L. and Urbina, A., "The effect of paraffinic fractions on crude oil wax crystallization", Petrol. Sci. Technol., 19, 189–196, (2001).
[4] Carmen García, M., "Paraffin deposition in oil production", SPE International Symposium on Oilfield Chemistry, Houston, Society of Petroleum Engineers, (2001).
[5] Hammami, A., Ratulowski, J. and Coutinho, J. A. P., "Cloud points: can we measure or model them?", Petrol. Sci. Technol., 21, 345–358, (2003).
[6] Bern, P. A., Winthers, V. R., and Cairns, J. R., "Wax deposition in crude oil pipelines", Presented at European Offshore Petroleum Conference and Exhibition, London, October 21-24, (1980).
[7] Burger, E. D., Perkins, T. K. and Striegler, J. H., "Studies of wax deposition in the trans Alaska pipeline", JPT, 1075, (1981).
[8] Hamouda, A. A., and Ravnoy, J. M., "Prediction of wax deposition in pipelines and field experience on the influence of wax on drag reducer performance", Offshore Tech. Conference, OTC 7060, 669, (1992). [9] Brown, T. S., Niesen, V. G. and
Erickson, D. D., "Measurement and prediction of kinetics of paraffin depositions", Paper SPE 26548 presented at 69th Annual Technical Conference and Exhibition, Houston, TX, October 3-6, (1993).
[10] Svendsen, J. A., "Mathematical modelling of wax deposition in oil pipelines systems", AIChE Journal, 39, 1377, (1993).
[11] Hsu, J. J. C. and Brubaker, J. P., "Wax deposition measurement and scale up modelling for waxy live crude under turbulent flow conditions", Paper SPE 29979 Presented at International Meeting on Petroleum Engineering, Beijing, November, (1995).
Antonio, TX, February 14-17, (1995). [13] Creek, J. L., Lund, H. J., Brill, J. P. and
Volk, M., "Wax deposition in single phase flow", Fluid Phase Equilibria, 158,801, (1999).
[14] Fogler, H. S., Singh, P., Venkatsean, R. and Nagarajan, N., "Formation and aging of incipient thin film wax oil gels", AIChE Journal, 46, 1059, (2000).
[15] Kok, M. V. and Saracoflu, O., "Mathematical modelling of wax deposition in crude oil pipeline system", Paper SPE 64514 Presented at the SPE Asia Pacific Oil and Gas Conference and Exhibition, Australia, 16-18 October, (2000).
[16] Soleymaninazar, A. R., Dabir, B., Vaziri, H. and Islam, M. R., "Experimental and mathematical modelling of wax deposition and propagation in pipes transporting crude oil", Paper SPE 67328 Presented at the SPE Production and Operations Symposium in Oklahoma city, Oklahoma, 24-27 March, (2001).
[17] Erickson, D. D., Niesen,V. G. and Brown, T. S., "Thermodynamic measurements and prediction of paraffin precipitation in crude oil", SPE 26604 Presented at 68th Annual Technical Conference and Exhibition, New Orleans, October, (1986).