Remote Sensing and GIS for Hydrology and Water Resources (IAHS Publ. 368, 2015) (Proceedings RSHS14 and ICGRHWE14, Guangzhou, China, August 2014). 424
Impacts of lake water environmental condition on
bioavailable-phosphorus of surface sediments in Lixia River basin, China
YING ZHANG
1, LING LIU
2& CHENGPENG LU
21 Hydraulic Engineering Planning Bureau of Jiangsu Province, Nanjing, Jiangsu Province, 210029, China
2 State Key Laboratory of Hydrology-Water Resources and Hydraulic Engineering, Nanjing, Jiangsu Province, 210098, China
Abstract Bioavailable-phosphorus (BAP) fractions of the lake surface sediments (the upper 0−5cm depth) and environmental indicators of the related lake water column were investigated in five lakes in Lixia River basin during three seasons in order to evaluate the impacts of environmental indicators of the water column on the BAP fractions of surface sediments. The concentration of BAP varied significantly in different seasons. Factor analysis was used to identify the factors which influence sedimentary BAP significantly in the different seasons. The results showed that AAP and Olsen-P were significantly affected by the chemical oxygen demand through the bacterial activity in summer. The high intensity of bacterial activity and density of algae, and low concentrations of NO3-N and dissolved oxygen under high temperature enhanced the BAP released from anaerobic sediment and significantly contributed to the eutrophication of the lake, especially in summer. In addition, macrophyte roots were beneficial to absorption of AAP and Olsen-P.
Key words bioavailable phosphorus; lake water environmental indicators; surface sediment; seasonal variation; Lixia River basin
1 INTRODUCTION
Phosphorus (P) plays a crucial role in the health of freshwater ecosystems, behaving as the principal limiting nutrient in eutrophication (Fytianos and Kotzakioti 2005). P has two major origins, i.e. external and internal. External P comes from diffuse sources or point sources. Internal P loading, which is mainly from lake sediments, has significant impacts on water quality and results in continuing eutrophication (Wang et al. 2008). However, not all fractions of P in lake sediment could be released into the water column and knowledge of total P concentration of sediment is not always adequate to determine the risk of lake eutrophication from internal P loading (Katsaounos et al. 2007). Therefore, the concept of bioavailable-phosphorus (BAP), proposed by Boström et al. (1988) has received increased interest from limnologists. There are many fractions of BAP in sediment such as (a) algae available P (AAP); (b) NaHCO3 extractable P
(Olsen-P); (c) water-soluble P (WSP); (d) readily-desorped P (RDP). Many previous studies suggested that the BAP is an important indicator for predicting future internal P load and release amounts to overlying water (Rydin 2000). The amount of internal P loading from sediments was governed not only by the concentration of BAP but also by the environmental condition (Boström
et al. 1988). Recently, more studies were focused on the relationship between BAP and P fractions of sediment. However, few studies focused on the impact of environmental conditions of the lake water column on the activity and distribution of BAP of sediment. The percentages of AAP and Olsen-P account for more than 90% of the total sediment BAP and the fractions of P in the upper 5−10 cm sediments are likely to participate in the metabolism process of the whole shallow lakes (Fan and Wang 2007). In this study, the AAP and Olsen-P were measured and the sediment from the top 0−5cm layers of lake sediments was sampled to represent the surface sediment in the study area. To reflect the lake water and surface sediment condition in different part of the lake, two or three sites were chosen in each study lake. All of the sampling sites were located by latitude and longitude coordinates on a map initially, and were located by hand held GPS each season during fieldwork.
In the present study, BAP fractions (AAP and Olsen-P) of surface sediment were investigated seasonally (spring, summer and winter) with the following objectives: (1) To evaluate the seasonal variations of the major BAP fractions in surface sediments of study area. (2) To assess the impacts of environmental conditions of the water column on the concentration of BAP fractions originating from surface sediments.
2 SAMPLING AND METHODS 2.1 Study area
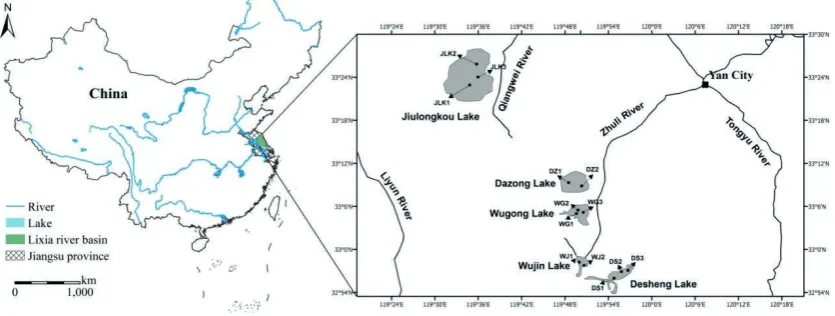
Lixia River basin is a typical flood plain which integrates several shallow lakes and rivers and faces a serious eutrophication problem in the southeast of the lower reaches of Huai River region, Jiangsu Province. Most of the lakes in the Lixia River basin were developed for fish farming and use cages. Wujin (WJ) Lake, Jiulongkou (JLK) Lake, Dazong (DZ) Lake, Desheng (DS) Lake and Wugong (WG) Lake were chosen in the Lixia River basin in present study (Fig. 1).
2.2 Sampling and analysis
To reflect the spatial distribution and characteristics of lake water conditions, two or three sites were chosen in each study lake. The surface water samples were collected at 13 sites within five lakes during three different seasons: May 2009 (spring), August 2009 (summer) and December 2009 (winter). The locations of sampling sites are shown in Fig. 1. All the sampling sites were located by handheld GPS each season. The water temperature (Temp), electrical conductivity (EC), total dissolved solids (TDS), pH, redox potential (Eh) and dissolved oxygen (DO) were measured on site using portable electrodes (HACH Inc. DR 2500). Water samples from sites within the lakes were taken at 1 m below the water surface and 0.5 m above the sediment surface and mixed. Samples for another 11 environmental indicators (total P (TP), soluble reaction P (SRP), dissolved total P (DTP), particulate P (PP), dissolved organic P (DOP), total nitrogen (TN), ammonia nitrogen (NH4-N), nitrate nitrogen (NO3-N), total organic carbon (TOC), chemical
oxygen demand (COD) and chlorophyll a (Chla)) were stored and analysed immediately after transportation. All of the above indicators pre-treatment and analysis methods were made by the reference Standard Monitoring and Analytic Methods of Water and Sewage.
Fig. 1 The map of sampling sites.
The upper 5 cm of surface sediments were collected simultaneously using a modified Kajak gravity corer in the same location as the water sampling. The samples were put into air-sealed plastic bags, kept cool (4ºC) with ice and protected from light. After transportation to the laboratory, the samples were sent for analysis immediately. Water content was estimated by drying sediments at 105°C until a stable weight was reached. The detailed steps for the determination of the two fractions of BAP in sediment are shown in Table 1 (Reddy et al. 1980; Olsen et al. 1954). The analytical results were normalized to air-dry weight.
2.3 Statistical analyses
Table 1 Chemistry extraction method of BAP in the sediments. BAP form Extraction method
AAP 0.80 g of wet sediment, shaken for 4.0 h with 200 ml of 0.1 mol L-1 NaOH solution on a reciprocating shaker at 150 rev min-1 at 25°C, The suspensions were filtered through 0.45 μm pore size membrane filter and the filtrates analysed for AAP using the AMAA method Olsen-P 2.50 g of wet sediments, shaken for 0.5 h with 50 ml of 0.5 M NaHCO3 solution (pH 8.5) on a
reciprocating shaker at 150 rev min-1 at 25°C, The suspensions were filtered through 0.45 μm pore size membrane filter and the filtrates were analysed for Olsen-P using the AMAA method
aquatic ecosystem in the different seasons. First, the distributions of the datasets used in the factor analysis were tested by the Shapiro-Wilk test. Principal component analyses and varimax rotation with Kaiser Normalization were used for extraction and deriving of factors, respectively. All of the analyses were carried out using PASW Statistical 18.
3 RESULTS AND DISCUSSION 3.1 Lake water column chemistry
The Temp had the highest value in the summer (28.4°C) and lowest value in the winter (9.3°C). EC was relatively stable in the three seasons. TDS was higher in the winter (321.54 ± 66.68 mg L-1)
relative to the spring (231.81 ± 96.38 mg L-1) and summer (246.85 ±37.47 mg L-1). The entire lake
water column was slightly acidic in the summer (pH: 6.90−7.98) and alkaline (pH: 7.96−9.88) in the winter. In the summer with higher temperature, the DO concentration (4.86 ± 1.76 mg L-1) was
substantial lower than in the spring (9.13 ± 3.20 mg L-1) and winter (8.48 ± 2.19 mg L-1). Since Eh
was generally associated with DO, seasonal variation in Eh had a similar trend with the exception of DZ Lake. It should be noted that the Chla concentration in the winter (9.75 ± 19.10 µg L-1) had
as high levels as in the summer (9.98 ± 15.45 µg L-1) and was much lower in the spring (3.76 ±
6.71 µg L-1). The concentration of TP had no significant difference among the three seasons and
was of the somewhat higher values in the spring (0.13 ±0.11 mg L-1). DTP concentration was
much higher in the summer (0.05 ± 0.02 mg L-1) than in the spring (0.05 ±0.02 mg L-1) and winter
(0.05 ± 0.03 mg L-1), respectively. SRP also had the highest concentration in the summer (0.07 ±
0.04 mg L-1), followed by the spring (0.04 ± 0.01 mg L-1) and the winter (0.03 ± 0.02 mg L-1).
However, the concentrations of both PP and DOP were lower in summer compared with the other two seasons. In the winter, DOP became higher in the studied lakes with the exception of JLK Lake. The TN, NH4-N and NO3-N were obviously lower in the summer and the peak appeared in
spring at most of sites. TOC was significantly higher in summer (38.64 ± 23.52 mg L-1) than in the
other seasons (5.64 ± 2.98 mg L-1 in spring and 5.46 ± 1.59 mg L-1 in winter). The average
concentration of COD was higher in the summer and was relatively lower in spring and winter.
3.2 Surface sediment BAP contribution and seasonal variation
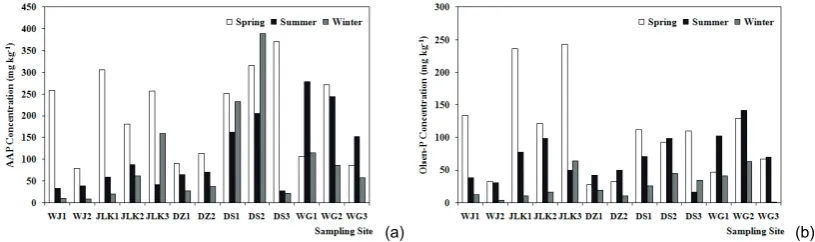
The average AAP concentration of the studied lakes was higher in the spring (206.29 ± 101.51 mg kg-1), followed by the summer (112.35 ± 86.11 mg kg-1) and winter (92.70 ± 111.59 mg kg-1). AAP
had significant seasonal variation during the season change (P value as 0.015). In most of the studied lakes’ sediments, AAP showed higher concentration in the spring and decreased in the summer (Fig. 2 (a)). In both seasons, excessive fish feed in pellet form, which cannot be consumed by fish, as well as the waste of fish, was deposited in the bottom of lakes and increased the AAP concentration. In summer, the AAP concentration in the studied sediment where flourishing bullrushes grew showed significant decrease from spring to summer indicating that macrophyte rooting has an effective function in decreasing and controlling the BAP concentration in the sediments. Since external P loading from agriculture and fish farming was much less in the winter, the average concentration of AAP was lowest in most of the studied lakes.
The average concentration of Olsen-P in the lakes (spring, 104.48 ± 70.54 mg kg-1; summer,
with that of AAP and had significant seasonal variation too (P value 0.0005). The average concen-trations of Olsen-P were lower than AAP in all seasons. According to the index system of the UK Agricultural Development and Advisory Service (ADAS), higher Olsen-P concentrations in soils (>46 mg kg-1) indicate a high nutrient status (MAFF 1991). Figure 2(b) shows that most of the
studied sediments suffered high nutrient pollution during the spring and summer season. The concentration of Olsen-P in sediment was also correlated with external P loading and macrophyte community density.
(a) (b)
Fig. 2 The seasonal variation of two fractions of BAP concentration in studied sediment.
3.3 Factor analysis
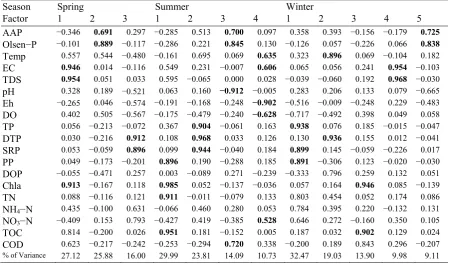
The results of the Shapiro-Wilk test showed that the datasets of three seasons were normally distributed (P > 0.05). Factor analysis of the seasonal data of BAP fractions, along with environmental indicators of lake water, indicated six factors for the summer and winter, but only five factors were identified for the spring. Part of the loading of each variable on each factor is shown in Table 2. The total variability accounted for by the six factors was 91.41% in summer and 91.44% in winter, while the variability was 84.89% during the spring season.
In the spring season (Table 2), factor 1 accounted for 27.12% of total variance, and was correlated strongly with EC, TDS and Chla. Factor 2 accounted for 25.88% of the total variance and was correlated with AAP and Olsen-P. Factor 3 was significantly correlated with DTP and SRP as the soluble P impact factor. BAP fractions as factor 2 accounted for 25.88% of the total variance. It noted that the BAP factor contributed more variance than P (factor 3 and factor 4) and N (factor 5). It suggested that the BAP of sediment played an important role in the aquatic ecosystem as the critical nutrient (N and P) factors of the surface water during the spring. However, the loading values of the water column environmental indicators were all much smaller than the loading values of the BAP fraction in factor 2. This indicated that the environmental condition of the lake water had little impact on BAP release or adsorption in the spring season.
In the summer (Table 2), factor 3 accounted for 14.09% of the variance, and was positively correlated with AAP, Olsen-P and COD, while factor 3 was negatively correlated with pH. COD is considered the carbon source in the water column. Carbon is an essential energy source for bacterial activity. Bacterial activity could affect the P release. To further compare the carbon concentration in the sediment, the TOC concentrations of surface sediments were measured in this study. The result showed that TOC had a significantly higher value in the summer than in the spring and winter. Therefore, the intensity of bacterial activity could be enhanced under high Temp and sufficient energy supplement. Consequently, AAP and Olsen-P were more likely to be released from sediment under high Temp and COD concentration through the bacterial activity of sediment.
Table 2 Factor analysis for three seasons.
Season Spring Summer Winter
Factor 1 2 3 1 2 3 4 1 2 3 4 5
AAP −0.346 0.691 0.297 −0.285 0.513 0.700 0.097 0.358 0.393 −0.156 −0.179 0.725 Olsen−P −0.101 0.889 −0.117 −0.286 0.221 0.845 0.130 −0.126 0.057 −0.226 0.066 0.838 Temp 0.557 0.544 −0.480 −0.161 0.695 0.069 0.635 0.323 0.896 0.069 −0.104 0.182 EC 0.946 0.014 −0.116 0.549 0.231 −0.007 0.606 0.065 0.056 0.241 0.954 −0.103 TDS 0.954 0.051 0.033 0.595 −0.065 0.000 0.028 −0.039 −0.060 0.192 0.968 −0.030 pH 0.328 0.189 −0.521 0.063 0.160 −0.912 −0.005 0.283 0.206 0.133 0.079 −0.665 Eh −0.265 0.046 −0.574 −0.191 −0.168 −0.248 −0.902 −0.516 −0.009 −0.248 0.229 −0.483 DO 0.402 0.505 −0.567 −0.175 −0.479 −0.240 −0.628 −0.717 −0.492 0.398 0.049 0.058 TP 0.056 −0.213 −0.072 0.367 0.904 −0.061 0.163 0.938 0.076 0.185 −0.015 −0.047 DTP 0.030 −0.216 0.912 0.108 0.968 0.033 0.126 0.130 0.936 0.155 0.012 −0.041 SRP 0.053 −0.059 0.896 0.099 0.944 −0.040 0.184 0.899 0.145 −0.059 −0.226 0.017 PP 0.049 −0.173 −0.201 0.896 0.190 −0.288 0.185 0.891 −0.306 0.123 −0.020 −0.030 DOP −0.055 −0.471 0.257 0.003 −0.089 0.271 −0.239 −0.333 0.796 0.259 0.132 0.051 Chla 0.913 −0.167 0.118 0.985 0.052 −0.137 −0.036 0.057 0.164 0.946 0.085 −0.139 TN 0.088 −0.116 0.121 0.911 −0.011 −0.079 0.133 0.803 0.454 0.052 0.174 0.086 NH4−N 0.435 −0.100 0.631 −0.066 0.460 0.280 0.053 0.784 0.395 0.220 −0.132 0.131 NO3−N −0.409 0.153 0.793 −0.427 0.419 −0.385 0.528 0.646 0.272 −0.160 0.350 0.105 TOC 0.814 −0.200 0.026 0.951 0.181 −0.152 0.005 0.187 0.032 0.902 0.129 0.024 COD 0.623 −0.217 −0.242 −0.253 −0.294 0.720 0.338 −0.200 0.189 0.843 0.296 −0.207
% of Variance 27.12 25.88 16.00 29.99 23.81 14.09 10.73 32.47 19.03 13.90 9.98 9.11
The factor analysis results show that both AAP and Olsen-P had high loading values in the different factors throughout the three seasons. It suggested that those major fractions of BAP are closely related to the aquatic ecosystem. Although many environmental indicators were not significantly correlated with BAP fractions in the same factor, they had high loading values in other factors. Therefore, it could affect BAP release and adsorption through their impact on environmental conditions to some extent. P adsorption is usually assumed to be simultaneous with an increase in Eh and P release while observing a decrease in Eh (Gomez et al. 1999). Factor 4 of the summer season aquatic ecosystem had a significant negative correlation with DO and Eh. However, in the spring and winter, Eh and DO did not show a significant impact on the aquatic ecosystem. It suggested that in the anaerobic conditions, the changes of oxygen supply levels could affect the BAP release. NO3-N stabilizes Eh in the lakes, and is considered more efficient than oxygen because of
being mainly reduced by denitrifying bacteria (Wang et al. 2008). In this study, NO3-N showed a
pronounced decrease from the spring to summer. The AAP and Olsen-P of sediment showed a similar pattern of variation. It indicated that the low lake water NO3-N concentration during the
spring−summer period could be one of the potential influences on BAP release.
4 CONCLUSIONS
Both AAP and Olsen-P concentration were significantly different from season to season. The seasonal variation trend was spring > summer > winter. In the spring and summer seasons, the massive amount of external P loading from basin sewage and uneaten fish feed or faeces caused the high concentrations of BAP. The absorption by the macrophyte root was effective for AAP and Olsen-P. The results of factor analysis indicated that AAP and Olsen-P were significantly affected by the chemical oxygen demand through the bacterial activity in summer. The high intensity of bacterial activity and density of algae, low concentration of NO3-N and dissolved oxygen under
Acknowledgements The study is supported by NSFC (50879018) funding. The authors are grateful to Fan Yang and Karla M. Jarecke of the University of Nebraska-Lincoln for many valuable suggestions.
REFERENCES
Boström, B., Persson, G. and Broberg, B. (1988) Bioavailability of different phosphorus forms in freshwater systems, Hydrobiologia 170, 133−155.
Fan, C.,and Wang, C. (2007) Environmental Geochemistry and Eutrophication in the Lakes of the Lower Yangze Region. Science Press, Beijing.
Fytianos, K., and Kotzakioti, A. (2005) Sequential fractionation of phosphorus in lake sediments of northern Greece, Environmental Monitoring and Assessment 100, 191−200.
Gomez, E., et al. (1999) Phosphate adsorption and release from sediments of brackish lagoons: pH, O2, and loading influence,
Water Research 33, 2437−2447.
Katsaounos, C.Z., et al. (2007) Speciation of phosphorus fraction in river sediments by explanatory data analysis. Water Research 41, 406−418.
MAFF (UK Ministry of Agriculture Fisheries and Food) (1991) Fertilizer Recommendations for Agricultural and Horticultural Crops. Reference Book 209. London: HMSO.
Ministry of Environment of protection of the People’s Republic of China (2006) Water and Sewage Monitor and Analysis Method (4th edition). Beijing: China Environmental & Science Press.
Olsen, S.R., et al. (1954) Estimation of available phosphorus in soils by extraction with sodium bicarbonate. Washington DC:USDA Circular.
Reddy, K.R., et al. (1980) Phosphorus adsorption-desorption characteristics of two soils utilized for disposal of animal wastes, Journal of Environmental Quality 9, 86−92.
Rydin, E. (2000) Potentially mobile phosphorus in Lake Erken sediment. Water Research 34, 2037−2042.