https://doi.org/10.5194/bg-14-3371-2017 © Author(s) 2017. This work is distributed under the Creative Commons Attribution 3.0 License.
On the challenges of using field spectroscopy to measure
the impact of soil type on leaf traits
Matheus H. Nunes, Matthew P. Davey, and David A. Coomes Department of Plant Sciences, University of Cambridge, CB2 3EA, UK Correspondence to:David A. Coomes ([email protected])
Received: 11 October 2016 – Discussion started: 4 November 2016 Revised: 16 May 2017 – Accepted: 18 May 2017 – Published: 14 July 2017
Abstract. Understanding the causes of variation in func-tional plant traits is a central issue in ecology, particularly in the context of global change. Spectroscopy is increasingly used for rapid and non-destructive estimation of foliar traits, but few studies have evaluated its accuracy when assess-ing phenotypic variation in multiple traits. Workassess-ing with 24 chemical and physical leaf traits of six European tree species growing on strongly contrasting soil types (i.e. deep alluvium versus nearby shallow chalk), we asked (i) whether variabil-ity in leaf traits is greater between tree species or soil type, and (ii) whether field spectroscopy is effective at predicting intraspecific variation in leaf traits as well as interspecific ferences. Analysis of variance showed that interspecific dif-ferences in traits were generally much stronger than intraspe-cific differences related to soil type, accounting for 25 % ver-sus 5 % of total trait variation, respectively. Structural traits, phenolic defences and pigments were barely affected by soil type. In contrast, foliar concentrations of rock-derived nutri-ents did vary: P and K concentrations were lower on chalk than alluvial soils, while Ca, Mg, B, Mn and Zn concentra-tions were all higher, consistent with the findings of previous ecological studies. Foliar traits were predicted from 400 to 2500 nm reflectance spectra collected by field spectroscopy using partial least square regression, a method that is com-monly employed in chemometrics. Pigments were best mod-elled using reflectance data from the visible region (400– 700 nm), while all other traits were best modelled using re-flectance data from the shortwave infrared region (1100– 2500 nm). Spectroscopy delivered accurate predictions of species-level variation in traits. However, it was ineffective at detecting intraspecific variation in rock-derived nutrients (with the notable exception of P). The explanation for this failure is that rock-derived elements do not have absorption
features in the 400–2500 nm region, and their estimation is indirect, relying on elemental concentrations covarying with structural traits that do have absorption features in that spec-tral region (“constellation effects”). Since the structural traits did not vary with soil type, it was impossible for our regres-sion models to predict intraspecific variation in rock-derived nutrients via constellation effects. This study demonstrates the value of spectroscopy for rapid, non-destructive estima-tion of foliar traits across species, but highlights problems with predicting intraspecific variation indirectly. We discuss the implications of these findings for mapping functional traits by airborne imaging spectroscopy.
1 Introduction
sub-stantial advances in trait-based community ecology over the past decade (Kunin et al., 2009; Funk et al., 2016), the im-portance of environmental filters is still debated, especially at small scales where biotic factors may prevail over abiotic en-vironmental constraints (Vellend, 2010). Global analyses of leaf nitrogen, phosphorus and leaf mass per unit areas (LMA) indicate that about half of all variation occurs within commu-nities (Wright et al., 2004), underscoring the importance of community-level variation in traits.
An increasing number of leaf traits are measured rou-tinely in plant communities, and global trade-offs among these traits are often interpreted in terms of the life his-tories of different species (Adler et al., 2014; Pillar et al., 2003; Aubin et al., 2009; Fry et al., 2014). In this study we measured 24 traits which we organise into three func-tional groups (Asner, 2014; Asner et al., 2014, 2015): (i) light capture and growth traits include pigments, the maximum efficiency of photosystem II (PSII), nitrogen concentration which is closely related to protein concentration (Milton and Dintzis, 1981), soluble C compounds and leaf water con-tent, C isotope discrimination (δ13C), N isotope discrimina-tion (δ15N); (ii) defence and structural traits include silicon (Si) organic cell wall constituents (cellulose, hemicellulose and lignin) that are associated with leaf toughness, longevity and defence capability (Hikosaka, 2004), polyphenols that are associated with defence against herbivores (Mithöfer and Boland, 2012), and LMA, a primary axis of specialisation among plants (Grime et al., 1997; Lambers and Poorter, 1992) that plays a crucial role in herbivore defence as well as leaf longevity (Wright et al., 2004); finally, (iii) rock-derived nutrients include phosphorus (P), which is involved in many enzymatic, genetic and epigenetic processes (Schachtman et al., 1998), and calcium (Ca), magnesium (Mg), potassium (K), zinc (Zn), manganese (Mn), boron (B) and iron (Fe), which are involved in signalling pathways and/or cofactors of enzymes (Marschner, 2012). We recognise that leaf traits can contribute to more than one class (e.g. LMA is related to growth but also to defence, P is a rock-derived nutrient also associated with growth). Many analyses of traits have focused on interspecific variation, but there is recognition that intraspecific variation can strongly influence species and community responses to environmental change (e.g. Weiner, 2004; Funk et al., 2016).
There is currently great interest in using hyper-spectroscopy as a tool for studying the chemical and struc-tural traits of leaves, particularly because improved airborne sensors and faster computing make it possible to map func-tional traits from the air (Ustin et al., 2009; Asner and Mar-tin, 2016b; Jetz et al., 2016; Asner et al., 2017). Plans to put hyperspectral sensors into space (e.g. the German Aerospace Center, DLR, plans to launch the Environmental Mapping and Analysis Program, EnMAP, in 2018; Guanter et al., 2015) will soon enable spectral response curves of vegetation communities to be assessed at the global scale. Rapid, non-destructive determination of leaf traits in vivo and in situ
us-ing spectroscopy reduces the need to collect large amounts of material in the field, decreases processing time, lessens costly chemical analyses and eliminates sampling that could itself alter experimental conditions (Couture et al., 2013). Spec-troscopy can provide predictions of a range of foliar traits at the leaf and canopy scales within diverse tropical ecosystems (Asner et al., 2011a; Doughty et al., 2011) and temperate forests (Wessman et al., 1988; Serbin et al., 2014). However, some traits do not have absorption features within the vis-ible and shortwave infrared spectral range of spectrometers conventionally used for vegetation analyses, but can be esti-mated indirectly through their covariance with traits that do have absorption features in the visible-to-shortwave-infrared region (“constellation effects” sensu Dana Chadwick and As-ner, 2016). These traits include elemental concentrations and isotope ratios (e.g. Serbin et al., 2014). In addition, struc-tural differences (i.e. leaf thickness, number of air water in-terfaces, cuticle thickness and pubescence) between leaves may have significant effects on the relationship between leaf reflectance and traits, and can complicate interpretation of data (Sims and Gamon, 2002; Wu et al., 2016). The abil-ity of spectroscopy to measure intraspecific variation in mul-tiples traits between soil types, particularly when some of those traits are indirectly determined through constellation effects, has not been critically evaluated.
This paper examines the drivers of leaf trait variation in temperate woodlands growing on chalk in southern England compared with woodlands growing on nearby alluvial soils. Several studies have evaluated change in species composition among British semi-natural habitats that differ markedly in soil type (Haines-Young et al., 2003; Smart et al., 2003), but none to our knowledge have compared within- and between-species variation of leaf traits in this context. The alkalinity of calcareous soils gives rise to phosphorus limitation, pre-venting short-term responses to nitrogen addition (Grime et al., 2000), so comparisons of chalklands with less-alkaline soils nearby provide strong edaphic contrast. We investi-gated 24 leaf traits on these contrasting soil types and exam-ined the ability of reflectance spectroscopy to quantify these leaf chemical and structural traits. We place these traits into groups based on ordination analyses, rather than working with pre-defined functional groups, and evaluate the func-tional significance of these groups. Our specific questions were as follows: (i) Is variability in leaf traits greater between tree species or soil type? (ii) Is field spectroscopy effective at predicting intraspecific variation in leaf traits between soil types, as well as interspecific differences?
2 Material and methods 2.1 Field site and sampling
(latitude=51◦160N, longitude=0◦190W). The alluvial soil, along the banks of the river Mole, was a loam of several me-tres depth. The chalk soil was located on a steep south-facing escarpment into which the river was cutting; the top soil was a few centimetres deep, underlain by solid chalk (i.e. a typical rendzina soil). The chalk soils were alkaline with an average pH and standard deviation of 7.9±1.0 (n=10), whereas the alluvial was near neutral, having a pH of 6.7±0.2 (n=10). Phosphorus becomes unavailable to plants in alkaline chalk soil (Gerke, 1992), and greater depth of loamy soil on the alluvial surfaces must result in much greater availability of nutrients to plants.
Across both sites, leaves were collected from 66 trees, rep-resenting six species. The six species common to both sites were Acer campestre (field maple), Acer pseudoplatanus (sycamore),Corylus avellana(hazel),Crataegus monogyna (hawthorn),Fraxinus excelsior(ash) andSambucus nigra (el-der). Two fully sunlit branches were selected, cut and placed in a cool box, and subsequently transported to a laboratory for processing within 2 h. For each branch, 10 mature leaves were selected. Three samples of 15 leaf disks were cored from these leaves using a 6 mm corer, wrapped in aluminium foil and frozen in liquid N for later chemical analyses. Leaf area was measured from fixed-height photos against a white background analysed in ImageJ. The scanned leaves were weighed to give hydrated mass, then dried at 70◦C for a min-imum of 72 h to obtain dry mass. LMA was calculated as dry mass per unit of fresh leaf area. Leaf water content was com-puted as the ratio between the quantity of water (fresh weight – dry weight) and the fresh weight. A further 22 leaf chemi-cal traits were measured on these samples (see below).
2.2 Chemical assays
Protocols for chemical assays are adapted from those de-veloped by the Carnegie Airborne Observatory (see http: //spectranomics.ciw.edu). Briefly, oven dried leaves were ground and analysed for a variety of elements and carbon fractions. Concentration of elements (B, Ca, K, Mg, Mn, P, Si, Fe, Zn) were determined by ashing samples in a muffle furnace followed by digesting them in nitric acid and analysis on an inductively coupled plasma mass spectrometry (Perkin Elmer SCIEX, Elan DRCII, Shelton, CT, USA). Nitrogen and carbon concentrations were determined using a Thermo Finnigan 253 with elemental analyser using a gas chromato-graphic separation column linked to a continuous flow iso-tope ratio mass spectrometer. This technique also provided foliar concentrations of the stable isotopes of N and C. Car-bon fractions, including hemicellulose, cellulose, lignin and soluble carbon (mainly carbohydrates, lipids, pectin and sol-uble proteins), were determined by sequential digestion of increasing acidity (Van Soest, 1994) in an Ankom fibre anal-yser (Ankom Technology, Macedon, NY, USA). These car-bon fractions are presented on an ash-free dry mass basis. Concentrations of photosynthetic pigments (chlorophyll a,
b, anthocyanins and total carotenoids) were measured by spectroscopy of solution derived from frozen leaf disks on area basis. Absorbance values of the supernatant were mea-sured at wavelengths 470, 649 and 665 nm for chlorophyll a,band total carotenoids determination and published equa-tions used to calculate pigment concentraequa-tions as in Licht-enthaler (1987). Absorbance values were also measured at wavelengths 530 and 650 nm for anthocyanins determination and published equations used as per Giusti et al. (1999), but corrected for possible chlorophyll contamination as per Sims and Gamon (2002). The maximum efficiency of photosys-tem II (PSII) was calculated according to Genty et al. (1989) by measuring the maximum fluorescence (Fm)and the yield
of fluorescence in the absence of an actinic (photosynthetic) light (Fo)using a PAM fluorometer. Total phenolic
concen-tration of the upper methanol/water layer was determined colorimetrically using the Folin–Ciocalteau method, based on absorbance at 760 nm on a spectrophotometer and quan-tified using tannic acid equivalents with water serving as a blank as per Davey et al. (2007).
2.3 Leaf and canopy spectroscopy
The remaining leaves were detached from the branches, and 10 leaves were selected at random, avoiding damaged and soft or young leaves. These leaves were laid on a matt black surface. Reflectance within bands ranging from 400 to 2500 nm was measured using a FieldSpec 4, produced by Analytical Spectral Devices (ASD, Boulder, Colorado, USA). The spectrometer’s contact probe was mounted on a clamp and firmly pushed down onto the sample, so that no light escaped through the sides. The spectral measurements were taken at the midpoint between the main vein and the leaf edge, approximately halfway between the petiole and leaf tip, with the abaxial surface pointing towards the probe. The readings were calibrated against a Spectralon white ref-erence every five samples. In all statistical analyses, the mean reflectance values of the 10 measurements per branch were used.
2.4 Statistical analyses
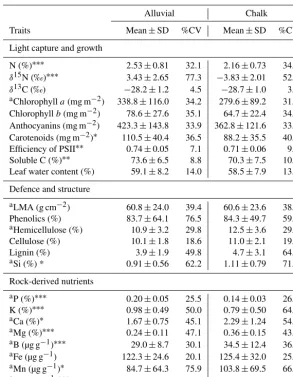
(resid-Table 1.Average, standard deviation (SD) and coefficient of variation (CV) in percentage for leaf traits of six generalist species growing on alluvial and chalk soils. Foliar trait was statistically different between soil types withP-value<0.05∗,<0.01∗∗and<0.001∗∗∗. Note that water content and the concentrations of defence and structure compounds are invariant of soil type, as this is key to understanding why variation in elemental concentrations between soil types cannot be predicted indirectly by constellation effects.
Alluvial Chalk
Traits Mean±SD %CV Mean±SD %CV
Light capture and growth
N (%)∗∗∗ 2.53±0.81 32.1 2.16±0.73 34.0 δ15N (‰)∗∗∗ 3.43±2.65 77.3 −3.83±2.01 52.3 δ13C (‰) −28.2±1.2 4.5 −28.7±1.0 3.6
aChlorophylla(mg m−2) 338.8±116.0 34.2 279.6±89.2 31.9
Chlorophyllb(mg m−2) 78.6±27.6 35.1 64.7±22.4 34.7 Anthocyanins (mg m−2) 423.3±143.8 33.9 362.8±121.6 33.5 Carotenoids (mg m−2)∗ 110.5±40.4 36.5 88.2±35.5 40.2 Efficiency of PSII∗∗ 0.74±0.05 7.1 0.71±0.06 9.8 Soluble C (%)∗∗ 73.6±6.5 8.8 70.3±7.5 10.6 Leaf water content (%) 59.1±8.2 14.0 58.5±7.9 13.5
Defence and structure
aLMA (g cm−2) 60.8±24.0 39.4 60.6±23.6 38.9
Phenolics (%) 83.7±64.1 76.5 84.3±49.7 59.0
aHemicellulose (%) 10.9±3.2 29.8 12.5±3.6 29.4
Cellulose (%) 10.1±1.8 18.6 11.0±2.1 19.3
Lignin (%) 3.9±1.9 49.8 4.7±3.1 64.8
aSi (%) * 0.91±0.56 62.2 1.11±0.79 71.5
Rock-derived nutrients
aP (%)∗∗∗ 0.20±0.05 25.5 0.14±0.03 26.8 K (%)∗∗∗ 0.98±0.49 50.0 0.79±0.50 64.4
aCa (%)∗ 1.67±0.75 45.1 2.29±1.24 54.1
aMg (%)∗∗∗
0.24±0.11 47.1 0.36±0.15 43.8
aB (µg g−1)∗∗∗ 29.0±8.7 30.1 34.5±12.4 36.0
aFe (µg g−1) 122.3±24.6 20.1 125.4±32.0 25.5 aMn (µg g−1)∗ 84.7±64.3 75.9 103.8±69.5 66.9
aZn (µg g−1)∗∗∗
22.9±12.6 55.0 34.1±18.7 54.9
alog-transformed prior to ANOVA.
ual variance). The residual variance comprises analytical er-ror and various types of intraspecific variation including mi-crosite and within-canopy variation. Where necessary, vari-ables were log-transformed to meet assumptions of ANOVA (see Table 1 for details). In addition, permutation-based multivariate analysis of variance (PERMANOVA; Anderson 2001) was applied to the matrix of dissimilarity among traits to evaluate the importance of soil type, species identity and the soil–species interaction as a source of variation in the 24 traits simultaneously. The non-parametric permutation-based analysis of variance (PERMANOVA) was then per-formed on the resulting distances (10 000 permutations). An alpha level of 0.05 was used for all significance tests, and no effort was made to test for or address non-normal data dis-tributions. The PERMANOVA used distance matrices calcu-lated using theadonisfunction in theveganpackage of R.
[image:4.612.152.445.117.493.2]Partial least squares regression (PLSR) was used to evalu-ate whether field spectroscopy can reliably predict leaf traits (Haaland and Thomas, 1988). The spectral reflectance val-ues of each sample were transformed into pseudo-absorption values; that is, log [1/R]) whereRis reflectance (see Bolster et al., 1996; Gillon et al., 1999; Richardson and Reeves III, 2005; Petisco et al., 2006; Kleinebecker et al., 2009). There is strong autocorrelation in pseudo-absorption values, so PLSR involves dimensionality reduction, producing orthogonal un-correlated latent vectors containing the maximum explana-tory power in relation to the trait data (Wold et al., 2001). The number of latent variables (nL) used in the PLSR analy-sis was predicted by minimising the prediction residual error sum of squares (PRESS) statistic (Chen et al., 2004; Zhao et al., 2015). We adopted a leave-one-out cross-validation for each PLSR model. Model accuracy and precision were expressed by the coefficient of determination (R2)and root mean square error (RMSE). We also standardised RMSE to the percentage of the response range (RMSE%) by dividing each RMSE by the maximum and minimum values of each leaf trait, as in Feilhauer et al. (2010). RMSE andR2were ac-quired during both model calibration and after model valida-tion. PLSR was conducted initially using all available wave-lengths (i.e. 400–2500 nm), but we then evaluated whether models based on smaller regions of the spectrum performed any better (see Serbin et al., 2014), based on comparisons of RMSE. The smaller regions were selected from absorp-tion features recognised in previous papers (Curran, 1989; Elvidge, 1990; Kokaly et al., 2009). The visible (VIS, 400– 700 nm), near infrared (NIR, 700–1500 nm) and shortwave infrared I (SWIR I, 1500–1900 nm), shortwave infrared II (SWIR II, 1900–2500 nm) regions, as well as combinations of the regions (700–1100, 700–1900, 700–2500, 1100–1500, 1100–1900, 1100–2500, 1500–2500 and 400–2500 nm) were tested and the best-supported model selected based on min-imisation of RMSE. To evaluate the effectiveness of field spectroscopy at measuring variation in traits related to soil type and species identity, we partitioned variance in model-predicted trait values using exactly the same approach as we used with lab-measured traits (i.e. first paragraph of the methods section).
3 Results
3.1 Soil and species controls on leaf traits
Foliar concentrations of rock-derived nutrients varied with soil type, but few other traits varied strongly with soil. Fo-liar concentrations of the macronutrients N, P and K were 17, 43 and 24 % higher on alluvial than on chalk soils (Ta-ble 1). Nitrogen isotope discrimination (δ15N) varied greatly between the two soils, from−3.8 ‰ in the chalk soil to 3.4 ‰ in the alluvial. Foliar concentrations of nutrients required in smaller quantities (Si, Ca, Mg, B, Mn and Zn) showed the
op-Figure 1.Partitioning of variance of foliar traits between species, soil, species–soil interaction and residual components for six gen-eralist species found on both chalk and alluvial soils. Residual ation arises from within-site intraspecific variation, microsite vari-ability, canopy selection and measurement error variance.
posite trend: they were higher in chalk soils (by 22, 37, 50, 19, 23 and 49 %, respectively). Fe was the only rock-derived mineral nutrient that was unaffected by soil type. In contrast, hemicellulose, cellulose, lignin and LMA were completely unaffected by soil type, and pigments and traits related to wa-ter status (δ13C and water content) varied little with soil type, with the exception of carotenoids concentration, which was 25 % higher in alluvial soil. The efficiency of PSII showed only a slight increase of 4 % in alluvial soil. The percent-age contribution of soluble C was affected by soil, with an increase in soluble C of 9 % in the alluvial soil.
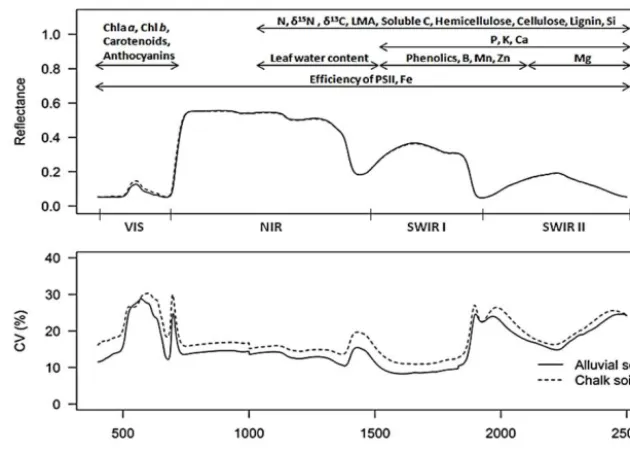
[image:5.612.306.549.66.296.2]Figure 3.Spectral reflectance and percentage coefficient of variation (CV) of reflectance of six generalists species for alluvial and chalk soils. The spectral regions for each trait were selected based on the model that minimised RMSE.
species and soil accounted for virtually no variation (i.e. the traits of different species responded similarly to soil type).
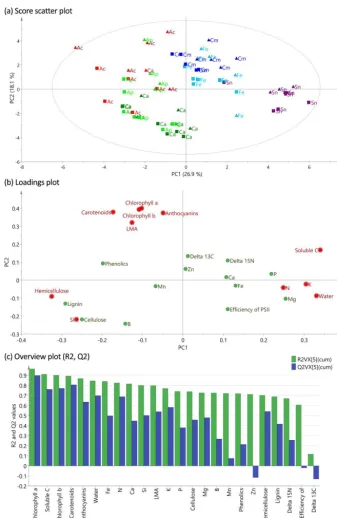
The principal component analysis (PCA) was able to dis-tinguish species across components 1 and 2 (Fig. 2a), with less separation of species within the same genus (i.e. A. campestreandA. pseudoplatanus). The first two components of PCA explain 45 % of the total variance. Separation of in-dividuals between the soil types was weak. Growth vs. struc-tural/defence traits were separated in its first axis and area-based vs. concentration-area-based traits in its second axis. The first two components of PCA explain 46 % of the total vari-ance. Considering only traits that were well predicted by PCA (i.e. had Q2>0.5), the first component distinguishes the traits associated in growth (i.e. N, K and soluble car-bon concentrations, and water content) from traits associ-ated with leaf defence and structure (i.e. hemicellulose and Si). The second component is chlorophylla, chlorophyllb, carotenoids, anthocyanins and LMA, and mainly separates the traits that were calculated on area basis. The first compo-nent distinguishes species relatively well, with less separa-tion of species within the same genus (i.e.A. campestreand A. pseudoplatanus).
3.2 Spectroscopy of leaf traits
The ability to predict leaf traits from hyperspectral re-flectance spectra varied greatly among the 24 traits (Table 2). The R2 values of validation data varied from 0.92 to 0.16, with traits ranked by goodness of fit as follows (highest first): LMA, leaf water content, Si, phenolics, carotenoids, K, B, efficiency of PSII, N, chlorophyllaand chlorophyllb. Some
minerals, such as P, Zn and Mn, as well asδ13C andδ15N showed lowR2. There was virtually no difference in the aver-age reflectance curves of leaves of trees growing on chalk and alluvial soils (Fig. 3a), but the coefficient of variation among plants was greater on the chalk soil (Fig. 3b). Pigments were most accurately modelled using reflectance data from the vis-ible region of the spectra, while other traits were most ac-curately modelled using spectral data in the 1100–2500 nm range (Fig. 3). Efficiency of PSII and Fe were the only fo-liar traits for which the strength of relationship was greatest when all wavelengths between 400 and 2500 nm were used in the model.
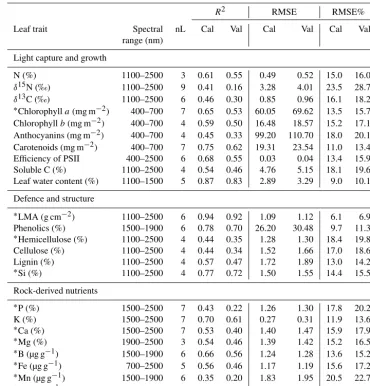
Table 2.Partial least squares regression (PLSR) on spectral data and leave-one-out cross-validation for 24 leaf traits of six species occurring on both alluvial and chalk soils. The model calibration (indicated with subscript cal) and validation (indicated as subscript val) performance was evaluated for each leaf trait by calculating the coefficient of determination (R2), root mean square error (RMSE) and the percentage root mean square error (%) based on the given number of latent variables (nL) for each PLS model.
R2 RMSE RMSE%
Leaf trait Spectral nL Cal Val Cal Val Cal Val
range (nm)
Light capture and growth
N (%) 1100–2500 3 0.61 0.55 0.49 0.52 15.0 16.0
δ15N (‰) 1100–2500 9 0.41 0.16 3.28 4.01 23.5 28.7 δ13C (‰) 1100–2500 6 0.46 0.30 0.85 0.96 16.1 18.2 ∗Chlorophyll
a(mg m−2) 400–700 7 0.65 0.53 60.05 69.62 13.5 15.7 Chlorophyllb(mg m−2) 400–700 4 0.59 0.50 16.48 18.57 15.2 17.1 Anthocyanins (mg m−2) 400–700 4 0.45 0.33 99.20 110.70 18.0 20.1 Carotenoids (mg m−2) 400–700 7 0.75 0.62 19.31 23.54 11.0 13.4 Efficiency of PSII 400–2500 6 0.68 0.55 0.03 0.04 13.4 15.9 Soluble C (%) 1100–2500 4 0.54 0.46 4.76 5.15 18.1 19.6 Leaf water content (%) 1100–1500 5 0.87 0.83 2.89 3.29 9.0 10.1
Defence and structure
∗
LMA (g cm−2) 1100–2500 6 0.94 0.92 1.09 1.12 6.1 6.9 Phenolics (%) 1500–1900 6 0.78 0.70 26.20 30.48 9.7 11.3 ∗Hemicellulose (%) 1100–2500 4 0.44 0.35 1.28 1.30 18.4 19.8
Cellulose (%) 1100–2500 4 0.44 0.34 1.52 1.66 17.0 18.6 Lignin (%) 1100–2500 4 0.57 0.47 1.72 1.89 13.0 14.2 ∗
Si (%) 1100–2500 4 0.77 0.72 1.50 1.55 14.4 15.5
Rock-derived nutrients
∗
P (%) 1500–2500 7 0.43 0.22 1.26 1.30 17.8 20.2
K (%) 1500–2500 7 0.70 0.61 0.27 0.31 11.9 13.6
∗
Ca (%) 1500–2500 7 0.53 0.40 1.40 1.47 15.9 17.9
∗Mg (%) 1900–2500 3 0.54 0.46 1.39 1.42 15.2 16.5
∗
B (µg g−1) 1500–1900 6 0.66 0.56 1.24 1.28 13.6 15.2 ∗Fe (µg g−1) 700–2500 5 0.56 0.46 1.17 1.19 15.6 17.2
∗
Mn (µg g−1) 1500–1900 6 0.35 0.20 1.83 1.95 20.5 22.7 ∗Zn (µg g−1) 1500–1900 7 0.41 0.21 1.50 1.60 19.5 22.4
∗Trait values were natural log-transformed for PLSR.
PLSR (Fig. 5). The explanation for this failure to model soil-related variation correctly is that concentrations of their as-sociated traits remain invariant of soil type (Table 1). The use of PLSR also considerably underpredicted the importance of soil (∼37 %) on theδ15N variation, presumably for similar reasons. Some species–soil interaction effects were detected by PLSR modelling, except for traits that showed strong in-teraction (Mn, P andδ13C). PLSR models were better able to detect intraspecific variation in foliar N concentrations, be-cause much of the nitrogen is contained in proteins, which have strong absorbance features.
4 Discussion
4.1 Patterns of variation in leaf traits
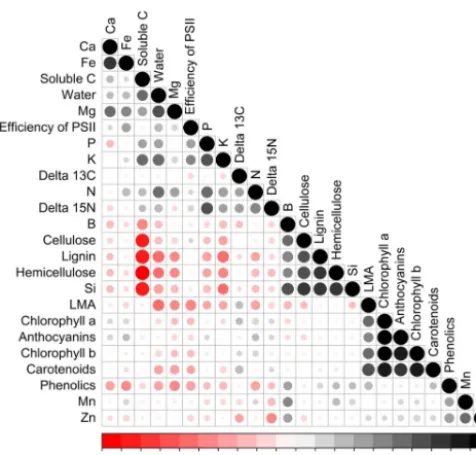
Figure 4.Spearman correlation rank test among leaf traits of six species growing on both soil types. Red and black circles mean, respectively, negative and positive correlations. Foliar traits were organised using cluster analysis.
to be a consequence of phosphorus deficiency (dos Santos et al., 2006). Importantly for our later discussion on indirect estimation of traits by spectroscopy, species did not vary be-tween soil types in their structural and defensive traits (i.e. LMA, lignin, phenolics) despite these differences in rock-derived nutrients. A similar lack of intraspecific change has been found in New Zealand rainforest trees growing on allu-vium or phosphorus-depleted marine terraces (Wright et al., 2010) and in several other studies (Koricheva et al., 1998; Boege and Dirzo, 2004; Fine et al., 2006).
Species had a greater influence on trait values than soils for all traits except P, and PCA analyses demonstrated that species with traits associated with fast growth had low con-centrations of traits associated with defence and structure (see Coley, 1983, 1987; Fine et al., 2006). Traits favour-ing high photosynthetic rate and growth are usually consid-ered advantageous in resource-rich soil environments, while traits favouring resource conservation are considered advan-tageous in low-resource environments (Aerts and Chapin, 1999; Westoby et al., 2002), but in this study the species were generalists growing on both soil types. The traits most influ-enced by species (in descending order) were Si, leaf water content, B, soluble C, N, LMA, K, cellulose, lignin, hemi-cellulose, magnesium, Zn, phenolics and Fe. It is interest-ing to note that two trace elements were near the top of this list; it is likely that strong differences in B and Si concentra-tions between species reflect differences in ion channel ac-tivity in roots (Ma and Yamaji, 2006). Previous studies have also shown Si to be under strong phylogenetic control, and
Figure 5.Partitioning of variance of foliar traits between species, soil, species–soil interaction and residual components for six gen-eralist species found on both chalk and alluvial soils from predicted data. Residual variation arises from within-site intraspecific vari-ation, microsite variability, canopy selection but not measurement error variance, and is therefore smaller than for field measurements (Fig. 1). Predicted data were obtained from partial least square re-gression (PLSR).
to be little affected by environmental conditions (Hodson et al., 2005). We also found Si and B concentrations to be pos-itively correlated, which might ameliorate the effects on B toxicity as Si can increase B tolerance of plants (Gunes et al., 2007). High Zn organisation at the species level corroborates earlier analyses that showed more than 70 % of Zn variation occurred within a family and substantial differences existed between and within species (Broadley et al., 2007).
[image:9.612.306.548.67.297.2]which may be why species and soil explained little of its vari-ance in our study. These parallels between tropical and tem-perate systems suggest broad similarities in plant responses to soil across different regions that differ greatly in tempera-ture.
4.2 Measuring interspecific variation in leaf traits with field spectroscopy
The spectral regions selected by our PLSR models match the locations of known spectral absorption features related to proteins, starch, lignin, cellulose, hemicellulose and leaf water content (Knipling, 1970; Curran, 1989; Elvidge, 1990; Fourty and Baret, 1998; Kokaly et al., 2009). In the region between 700 and 2500 of the electromagnetic spectrum, ab-sorption features are commonly the result of overtones and combinations of fundamental absorptions at longer wave-lengths. The visible region was useful to predict pigment concentrations and contributed to the predictions of the ef-ficiency of PSII and Fe only, whereas the infrared region was associated with the most traits. The region of impor-tance with correlated wavelengths with nitrogen varies be-tween 1192 nm in deciduous forest (Bolster et al., 1996) and 2490 for forage matter (Marten et al., 1983), which results directly from nitrogen in the molecular structure. Accord-ing to Kumar et al. (2002), three main protein absorption features reported as important for N estimation are located around 1680 nm, 2050 and 2170 nm. In this study, pigments were found to influence the visible region of the spectrum while PSII-efficiency was predicted from features across the VSWIR range. The spectra of chlorophylls are distinct from those of proteins because C-H bonds in their phytols tails cre-ate a strong absorption feature not found in proteins (Katz et al., 1966). However, pigments are tightly bound by proteins to form photosynthetic antenna complexes that capture light energy and transfer it to the PSI and PSII reaction centres (Liu et al., 2004). The vibration of the bonds in the pigment– protein complex adds additional absorption features to the spectra of pigments and may help explain why so many bands were involved in PSII-efficiency prediction (Porcar-Castell et al., 2014). The 1500–1900 nm region was impor-tant for phenolic compounds prediction, which includes the 1660 nm feature across a variety of species and phenolic compounds (Windham et al., 1988; Kokaly and Skidmore, 2015). The primary and secondary effects of water content on leaf reflectance are greatest in spectral bands centred at 1450, 1940, and 2500 nm (Carter and Porter, 1991), but have also been predicted using bands between 1100 and 1230 nm (Ustin et al., 1998; Asner et al., 2004). With respect to the other rock-derived nutrients, Galvez-Sola et al. (2015) also showed that near-infrared spectroscopy can constitute a fea-sible technique to quantify several macro and micronutrients such as N, K, Ca, Mg, Fe and Zn in different citrus leaves with the coefficient of determination (R2)varying between 0.53 for Mn and 0.98 for Ca, whereas B showed less accurate
results with the use of spectroscopy. The regions of impor-tance for prediction described in those studies were relatively similar to all the mineral nutrients analysed in our study, ex-cept for B, which had the band between 1500 and 1900 as the best predictive region.
Some of most accurately predicted traits have no absorp-tion features in the visible-to-near-infrared, but were instead estimated indirectly via constellation effects. LMA is con-sistently among the more accurately predicted traits using spectroscopy (Asner and Martin, 2008; Serbin et al., 2014; Chavana-Bryant et al., 2016), but is measured indirectly via its close coupling with water content and structural traits of leaves (Asner et al., 2011b). Silicon (Si) concentrations were well predicted by field spectroscopy, as recently re-ported by Smis et al. (2014). Silicon is absorbed by plants from the soil solution in the form of silicic acid (H4SiO4),
having been translocated to the aerial parts through xylem, and then deposited as phytoliths (Tripathi et al., 2011). Si is closely associated with phenol- or lignin-carbohydrate complexes (Inanaga et al., 1995), cellulose (Law and Ex-ley, 2011), and polysaccharide and peptidoglycans (Schwarz, 1973). It seems that spectroscopy is able to predict Si concen-trations reliably because it integrates information on several of these foliar traits to make the predictions. Similarly, the relative high precisions for K, Fe and B predictions may be as strong as they are because information on several foliar traits are integrated. Unfortunately, foliar P concentrations are not closely predicted by spectroscopy. RNA and DNA absorb in the ultraviolet (e.g. Tataurov et al., 2008) and phosphates in the longwave infrared, but there are no pronounced absorp-tion features in the VSWIR region (Homolova et al., 2013) and covariance with other traits is weak, making constella-tion effects unreliable. While a few spectroscopy studies have modelled P with some success, the spectral bands chosen dif-fer among studies (Homolova et al., 2013), suggesting that constellation effects cannot be relied upon.
4.3 Difficulties in measuring intraspecific variation by field spectroscopy and its implications for mapping functional traits
There are likely to be implications of the constellation-effect problem for mapping functional traits using imaging spectroscopy. Ever larger areas of earth are being mapped with airborne spectrometers (e.g. Asner et al., 2017) and the anticipated launch of satellite-borne sensors (e.g. En-MAP was approved by the DLR, with launch planned for mid-2018; Guanter et al., 2015) will soon enable vegeta-tion and ecosystem funcvegeta-tion to be characterised at the global scale. The effectiveness of indirect prediction of traits us-ing constellation-effect approaches will depend critically on whether soils act as a strong filter on tree species within a particular region. In the Amazonian lowlands, Asner et al. (2015) found that variation in soil P was mirrored by changes in species composition, and that P variation among species was correlated with changes in structural and defence compounds: in this instance, indirect estimation should be ef-fective (e.g. Dana Chadwick and Asner, 2016). However, in low-diversity temperate forests, a single tree species is often found to span many different soil types and show substan-tial phenotypic plasticity in some traits (Oleksyninst et al., 2002; Turnbull et al., 2016). The six species growing on both chalk and alluvial soils in this study are a case in point. In these low-diversity systems, it will be much more difficult to map variation using constellation effects, for the reasons ex-plained above. Our study confirms the power of spectroscopy for predicting biochemical and structural plant traits, but we urge caution in interpreting results when species range across contrasting soil types.
5 Conclusions
Trees on thin chalk soils had lower concentrations of N, P and K macronutrients in their leaves than trees growing on deep alluvium, but had high concentrations of several mi-cronutrients. Phosphorus is sequestered in insoluble forms in alkaline soils. This shortage of plant-available phosphorus was associated in this study with low concentrations of fo-liar N and low efficiency of PSII, but had no effect on struc-tural and defensive traits. Trait differences were far greater among species than between soil types, for all traits except foliar P. Foliar traits predicted from VSWIR reflectance spec-tra matched the locations of known specspec-tral absorption fea-tures related to proteins, starch, lignin, cellulose, hemicel-lulose and leaf water content. Some of the most accurately predicted traits have no absorption features in the VSWIR range, and were estimated indirectly through their covariance with structural traits that do have absorption features in that spectral region (constellation effects) including cell wall con-stituents. Since these structural traits did not vary with soil type, our models were unable to reliably predict intraspecific variation in rock-derived nutrients via constellation effects. Similarities between our results and those of large-scale trop-ical studies suggest this problem is likely to be widespread. This study demonstrates the value of spectroscopy for rapid,
non-destructive estimation of foliar traits across species, but highlights the difficulties that can arise in detecting within-species changes along environmental gradients.
Data availability. The data has become publicly available through deposit to NERC’s Environmental Information Data Centre (EIDC; Coomes et al., 2017).
Author contributions. MHN participated in the chemical analyses, analysed the data and wrote the manuscript; MPD led the chemi-cal analysis and contributed to the writing of the manuscript; DAC conceived the ideas, designed the methods, supervised the collec-tion of field data and led the writing of the manuscript. All authors contributed critically to the drafts and gave final approval for publi-cation.
Competing interests. The authors declare that they have no conflict of interest.
Acknowledgements. David Coomes was supported by a grant from NERC (NE/K016377/1) and Matheus H. Nunes is supported by a PhD scholarship from the Conselho Nacional de Pesquisa e Desenvolvimento(CNPq). We thank the NERC Field Spectroscopy Facility, and particularly Alasdair MacArthur, for training and loan of the ASD spectrometer. We thank undergraduate stu-dents Thomas Hitchcock, Lilian Halstead, Matt Chadwick and Connor Willmington-Holmes for helping with field work, and Alexandra Jamieson for measuring phenolics. We are grateful to David Burslem, University of Aberdeen, for providing access to the carbon fractions analyser.
Edited by: Michael Bahn
Reviewed by: two anonymous referees
References
Adler, P. B., Salguero-Gómez, R., Compagnoni, A., Hsu, J. S., Ray-Mukherjee, J., Mbeau-Ache, C., and Franco, M.: Functional traits explain variation in plant life history strategies, P. Natl. Acad. Sci. USA, 111, 740–745, 2014.
Aerts, R. and Chapin, F. S.: The Mineral Nutrition of Wild Plants Revisited: A Re-evaluation of Processes and Patterns, Adv. Ecol. Res., 30, 1–67, 1999.
Albert, C. H., Grassein, F., Schurr, F. M., Vieilledent, G., and Violle, C.: When and how should intraspecific variability be considered in trait-based plant ecology?, Perspectives in Plant Ecology, Evo-lution and Systematics, 13, 217–225, 2011.
Anderson, M. J.: A new method for non-parametric multivariate analysis of variance, Austral Ecol., 26, 32–46, 2001.
Asner, G. P. and Martin, R. E.: Spectral and chemical analysis of tropical forests: Scaling from leaf to canopy levels, Remote Sens. Environ., 112, 3958–3970, 2008.
Asner, G. P. and Martin, R. E.: Canopy phylogenetic, chemical and spectral assembly in a lowland Amazonian forest, New Phytol., 189, 999–1012, 2011.
Asner, G. P. and Martin, R. E.: Convergent elevation trends in canopy chemical traits of tropical forests, Glob. Change Biol., 22, 2216–2227, 2016a.
Asner, G. P. and Martin, R. E.: Spectranomics: Emerging science and conservation opportunities at the interface of biodiversity and remote sensing, Global Ecology and Conservation, 8, 212– 219, https://doi.org/10.1016/j.gecco.2016.09.010, 2016b. Asner, G. P., Nepstad, D., Cardinot, G., and Ray, D.: Drought stress
and carbon uptake in an Amazon forest measured with space-borne imaging spectroscopy, P. Natl. Acad. Sci. USA, 101, 6039– 6044, 2004.
Asner, G. P., Martin, R. E., Knapp, D. E., Tupayachi, R., Ander-son, C., Carranza, L., Martinez, P., Houcheime, M., Sinca, F., and Weiss, P.: Spectroscopy of canopy chemicals in humid trop-ical forests, Remote Sens. Environ., 115, 3587–3598, 2011a. Asner, G. P., Martin, R. E., Tupayachi, R., Emerson, R., Martinez,
P., Sinca, F., Powell, G. V., Wright, S. J., and Lugo, A. E.: Taxon-omy and remote sensing of leaf mass per area (LMA) in humid tropical forests, Ecol. Appl., 21, 85–98, 2011b.
Asner, G. P., Martin, R. E., Carranza-Jiménez, L., Sinca, F., Tu-payachi, R., Anderson, C. B., and Martinez, P.: Functional and biological diversity of foliar spectra in tree canopies through-out the Andes to Amazon region, New Phytol., 204, 127–139, https://doi.org/10.1111/nph.12895, 2014.
Asner, G. P., Anderson, C. B., Martin, R. E., Tupayachi, R., Knapp, D. E., and Sinca, F.: Landscape biogeochemistry reflected in shifting distributions of chemical traits in the Amazon forest canopy, Nat. Geosci., 8, 567–573, 2015.
Asner, G. P., Martin, R. E., Knapp, D. E., Tupayachi, R., Ander-son, C. B., Sinca, F., Vaughn, N. R., and Llactayo, W.: Airborne laser-guided imaging spectroscopy to map forest trait diversity and guide conservation, Science, 355, 385–389, 2017.
Aubin, I., Ouellette, M. H., Legendre, P., Messier, C., and Bouchard, A.: Comparison of two plant functional approaches to eval-uate natural restoration along an old-field – deciduous forest chronosequence, J. Veg. Sci., 20, 185–198, 2009.
Boege, K. and Dirzo, R.: Intraspecific variation in growth, defense and herbivory, Plant Ecol., 175, 59–69, 2004.
Bolster, K., Martin, M., and Aber, J.: Determination of carbon frac-tion and nitrogen concentrafrac-tion in tree foliage by near infrared reflectances: a comparison of statistical methods, Can. J. Forest Res., 26, 590–600, https://doi.org/10.1139/x26-068, 1996. Broadley, M. R., White, P. J., Hammond, J. P., Zelko, I., and Lux,
A.: Zinc in plants: Tansley review, New Phytol., 173, 677–702, 2007.
Buchmann, N., Kao, W. Y., and Ehleringer, J.: Influence of stand structure on carbon-13 of vegetation, soils, and canopy air within deciduous and evergreen forests in Utah, United States, Oecolo-gia, 110, 109–119, 1997.
Carter, P. W. and Porter, J. D.: Probing of π conjuga-tion in trans-polyacetylene using near-infrared photo-luminescence spectroscopy, Phys. Rev. B, 43, 14478, https://doi.org/10.1103/PhysRevB.43.14478, 1991.
Chavana-Bryant, C., Malhi, Y., Wu, J., Asner, G. P., Anastasiou, A., Enquist, B. J., Caravasi, C., Eric, G., Doughty, C. E., Saleska, S. R., and Martin, R. E.: Leaf aging of Amazonian canopy trees as revealed by spectral and physiochemical measurements, New Phytol., 214, 1049–1063, https://doi.org/10.1111/nph.13853, 2016.
Chen, S., Hong, X., Harris, C. J., and Sharkey, P. M.: Sparse Model-ing UsModel-ing Orthogonal Forward Regression With PRESS Statistic and Regularization, IEEE T. Syst. Man Cy. B, 34, 898–911, 2004. Coley, P. D.: Herbivory and Defensive Characteristics of Tree Species in a Lowland Tropical Forest, Ecol. Monogr., 53, 209– 234, https://doi.org/10.2307/1942495, 1983.
Coley, P. D.: Interspecific Variation in Plant Anti-Herbivore Proper-ties: the Role of Habitat Quality and Rate of Disturbance, New Phytol., 106, 251–263, 1987.
Coomes, D. A., Davey, M., and Nunes, M. H.: Field spec-troscopy and leaf trait data from a field experiment in Surrey [HMTF], NERC Environmental Information Data Centre, https://doi.org/10.5285/e24264f8-2821-4d6a-ad77-3688b2c69f24, 2017.
Couture, J. J., Serbin, S. P., and Townsend, P. A.: Spectroscopic sensitivity of real-time, rapidly induced phytochemical change in response to damage, New Phytol., 198, 311–319, 2013. Curran, P. J.: Remote sensing of foliar chemistry, Remote Sens.
En-viron., 30, 271–278, 1989.
Dana Chadwick, K. and Asner, G. P.: Organismic-scale remote sensing of canopy foliar traits in lowland tropical forests, Remote Sens., 8, 87, https://doi.org/10.3390/rs8020087, 2016.
Davey, M. P., Harmens, H., Ashenden, T. W., Edwards, R., and Bax-ter, R.: Species-specific effects of elevated CO2on resource
al-location in Plantago maritima and Armeria maritima, Biochem. Syst. Ecol., 35, 121–129, 2007.
Davey, M. P., Ian Woodward, F., and Paul Quick, W.: Intraspecfic variation in cold-temperature metabolic phenotypes of Arabidop-sis lyratassp. petraea, Metabolomics, 5, 138–149, 2009. Donohue, K., Dorn, L., Griffith, C., Kim, E., Aguilera, A., Polisetty,
C. R., and Schmitt, J.: ENVIRONMENTAL AND GENETIC INFLUENCES ON THE GERMINATION OF ARABIDOPSIS THALLANA IN THE FIELD, Evolution, 59, 740–757, 2005. dos Santos, U. M., de Carvalho Gonçalves, J. F., and Feldpausch,
T. R.: Growth, leaf nutrient concentration and photosynthetic nu-trient use efficiency in tropical tree species planted in degraded areas in central Amazonia, Forest Ecol. Manage., 226, 299–309, 2006.
Doughty, C. E., Asner, G. P., and Martin, R. E.: Predicting tropical plant physiology from leaf and canopy spectroscopy, Oecologia, 165, 289–299, 2011.
Elvidge, C. D.: Reflectance characteristics of dry plant materials, Int. J. Remote Sens., 11, 1775–1795, 1990.
Fourty, T. and Baret, F.: On spectral estimates of fresh leaf biochem-istry, Int. J. Remote Sens., 19, 1283–1297, 1998.
Fry, E. L., Power, S. A., and Manning, P.: Trait-based classifica-tion and manipulaclassifica-tion of plant funcclassifica-tional groups for biodiversity-ecosystem function experiments, J. Veg. Sci., 25, 248–261, 2014. Funk, J. L., Larson, J. E., Ames, G. M., Butterfield, B. J., Cavender-Bares, J., Firn, J., Laughlin, D. C., Sutton-Grier, A. E., Williams, L., and Wright, J.: Revisiting the Holy Grail: Using plant func-tional traits to predict ecological processes, Biol. Rev., 92, 1156– 1173, 2016.
Galvez-Sola, L., García-Sánchez, F., Pérez-Pérez, J. G., Gimeno, V., Navarro, J. M., Moral, R., Martínez-Nicolás, J. J., and Nieves, M.: Rapid estimation of nutritional elements on citrus leaves by near infrared reflectance spectroscopy, Frontiers in Plant Science, 6, https://doi.org/10.3389/fpls.2015.00571, 2015.
Genty, B., Briantais, J.-M., and Baker, N. R.: The relation-ship between the quantum yield of photosynthetic electron transport and quenching of chlorophyll fluorescence, Biochim. Biophys. Acta, 990, 87–92, https://doi.org/10.1016/S0304-4165(89)80016-9, 1989.
Gerke, J.: Orthophosphate and organic phosphate in the soil solu-tion of four sandy soils in relasolu-tion to pH-evidence for humic-FE-(AL-) phosphate complexes, Communications in Soil Science and Plant Analysis, 23, 601–612, 1992.
Gillon, D., Houssard, C., and Joffre, R.: Using near-infrared re-flectance spectroscopy to predict carbon, nitrogen and phospho-rus content in heterogeneous plant material, Oecologia, 118, 173–182, 1999.
Giusti, M. M., Rodríguez-Saona, L. E., and Wrolstad, R. E.: Molar absorptivity and color characteristics of acylated and non- acy-lated pelargonidin-based anthocyanins, J. Agr. Food Chem., 47, 4631–4637, 1999.
Green, J. L., Bohannan, B. J. M., and Whitaker, R. J.: Microbial bio-geography: from taxonomy to traits, Science, 320, 1039–1043, 2008.
Grime, J. P., Brown, V. K., Thompson, K., Masters, G. J., Hillier, S. H., Clarke, I. P., Askew, A. P., Corker, D., and Kielty, J. P.: The response of two contrasting limestone grasslands to simulated climate change, Science, 289, 762–765, 2000.
Grime, J. P., Thompson, K., Hunt, R., Hodgson, J. G., Cornelis-sen, J. H. C., Rorison, I. H., Hendry, G. A. F., Ashenden, T. W., Askew, A. P., Band, S. R., and Booth, R. E.: Integrated screen-ing validates primary axes of specialisation in plants, Oikos, 79, 259–281, 1997.
Guanter, L., Kaufmann, H., Segl, K., Foerster, S., Rogass, C., Chabrillat, S., Kuester, T., Hollstein, A., Rossner, G., Chle-bek, C., and Straif, C.: The EnMAP spaceborne imaging spec-troscopy mission for earth observation, Remote Sens., 7, 8830– 8857, 2015.
Gunes, A., Inal, A., Bagci, E. G., Coban, S., and Sahin, O.: Silicon increases boron tolerance and reduces oxidative damage of wheat grown in soil with excess boron, Biol. Plantarum, 51, 571–574, 2007.
Haaland, D. M. and Thomas, E. V.: Partial least-squares methods for spectral analyses. 1. Relation to other quantitative calibra-tion methods and the extraccalibra-tion of qualitative informacalibra-tion, Anal. Chem., 60, 1193–1202, 1988.
Haines-Young, R., Barr, C. J., Firbank, L. G., Furse, M., Howard, D. C., McGowan, G., Petit, S., Smart, S. M., and Watkins, J. W.:
Changing landscapes, habitats and vegetation diversity across Great Britain, J. Environ. Manage., 67, 267–281, 2003. Hikosaka, K.: Interspecific difference in the
photosynthesis-nitrogen relationship: Patterns, physiological causes, and ecolog-ical importance, J. Plant Res., 117, 481–494, 2004.
Hillier, S. H., Walton, D. W. H., and Wells, D. A.: Calcareous grass-lands: ecology and management, Bluntisham Books, Hunting-don, 1990.
Hodson, M. J., White, P. J., Mead, A., and Broadley, M. R.: Phylo-genetic variation in the silicon composition of plants, Ann. Bot., 96, 1027–1046, 2005.
Homolova, L., Malenovský, Z., Clevers, J. G., García-Santos, G., and Schaepman, M. E.: Review of optical-based remote sensing for plant trait mapping, Ecol. Complex., 15, 1–16, 2013. Inanaga, S., Okasaka, A., and Tanaka, S.: Does silicon exist in
as-sociation with organic compounds in rice plant?, Soil Sci. Plant Nutr., 41, 111–117, 1995.
Jetz, W., Cavender-Bares, J., Pavlick, R., Schimel, D., Davis, F. W., Asner, G. P., Guralnick, R., Kattge, J., Latimer, A. M., Moorcroft, P., and Schaepman, M. E.: Monitoring plant functional diversity from space, Nature Plants, 2, 16024, https://doi.org/10.1038/nplants.2016.24, 2016.
Katz, J. J., Dougherty, R. C., and Boucher, L. J.: Infrared and nu-clear magnetic resonance spectroscopy of chlorophyll, A. Press, New York, 1966.
Kleinebecker, T., Schmidt, S. R., Fritz, C., Smolders, A. J., and Hölzel, N.: Prediction ofδ13C andδ15N in plant tissues with near-infrared reflectance spectroscopy, New Phytol., 184, 732– 739, https://doi.org/10.1111/j.1469-8137.2009.02995.x, 2009. Knipling, E. B.: Physical and physiological basis for the reflectance
of visible and near-infrared radiation from vegetation, Remote Sens. Environ., 1, 155–159, 1970.
Kokaly, R. F. and Skidmore, A. K.: Plant phenolics and absorp-tion features in vegetaabsorp-tion reflectance spectra near 1.66-m, Int. J. Appl. Earth Obs. Geoinf., 43, 55–83, 2015.
Kokaly, R. F., Asner, G. P., Ollinger, S. V., Martin, M. E., and Wessman, C. A.: Characterizing canopy biochem-istry from imaging spectroscopy and its application to ecosystem studies, Remote Sens. Environ., 113, S78–S91, https://doi.org/10.1016/j.rse.2008.10.018, 2009.
Koricheva, J., Larsson, S., Haukioja, E., and Keinänen, M.: Regu-lation plant secondary metabolism by resource availability?: hy-pothesis testing by means of meta-analysis, Oikos, 83, 212–226, 1998.
Kumar, L., Schmidt, K., Dury, S., and Skidmore, A.: Imaging Spectrometry and Vegetation Science, in Imaging spectrometry, Springer Netherlands, 111–156, 2002.
Kunin, W. E., Vergeer, P., Kenta, T., Davey, M. P., Burke, T., Wood-ward, F. I., Quick, P., Mannarelli, M. E., Watson-Haigh, N. S., and Butlin, R.: Variation at range margins across multiple spa-tial scales: environmental temperature, population genetics and metabolomic phenotype, Philos. T. R. Soc. B., 276, 1495–1506, 2009.
Lambers, H. and Poorter, H.: Inherent Variation in Growth Rate Between Higher Plants: A Search for Physiological Causes and Ecological Consequences, Adv. Ecol. Res., 34, 283–362, 1992. Law, C. and Exley, C.: New insight into silica deposition in
Lichtenthaler, H. K.: Chlorophylls and carotenoids: Pigments of photosynthetic biomembranes, Method. Enzymol., 148, 350– 382, 1987.
Liu, Z., Yan, H., Wang, K., Kuang, T., Zhang, J., Gui, L., An, X., and Chang, W.: Crystal structure of spinach major light-harvesting complex at 2.72 Å resolution, Nature, 428, 287–292, 2004. Ma, J. F. and Yamaji, N.: Silicon uptake and accumulation in higher
plants, Trends Plant Sci., 11, 392–397, 2006.
MacGillivray, C. W., Grime, J. P., and The Integrated Screening Pro-gramme (Isp) Team: Testing predictions of the resistance and re-silience of vegetation subjected to extreme events, Funct. Ecol., 9, 640–649, 1995.
Marschner, H.: Functions of Mineral Nutrients: Macronutrients, in: Mineral Nutrition of Higher Plants, Academic press, 229–312, 1995.
Marschner, M.: Mineral Nutrition of Higher Plants, available at: http://books.google.com/books?id=_a-hKcXXQuAC&pgis= 1, 2012.
Marten, G. C., Halgerson, J. L., and Cherney, J. H.: Quality pre-diction of small grain forages by near infrared reflectance spec-troscopy, Crop Sci., 23, 94–96, 1983.
McGill, B. J., Enquist, B. J., Weiher, E., and Westoby, M.: Re-building community ecology from functional traits, Trends Ecol. Evol., 21, 178–185, 2006.
Milton, K. and Dintzis, F. R.: Nitrogen-to-Protein Conversion Fac-tors for Tropical Plant-Samples, Biotropica, 13, 177–181, 1981. Misra, A. and Tyler, G.: Effects of soil moisture on soil solution
chemistry, biomass production , and shoot nutrients in two native grasses on a calcareous soil, Commun. Soil Sci. Plan., 31, 37–41, 2000.
Mithöfer, A. and Boland, W.: Plant Defense Against Herbivores: Chemical Aspects, Annu. Rev. Plant Biol., 63, 431–450, 2012. Niklas, K. J., Owens, T., Reich, P. B., and Cobb, E. D.:
Ni-trogen/phosphorus leaf stoichiometry and the scaling of plant growth, Ecol. Lett., 8, 636–642, 2005.
Oleksyninst, J., Reich, P. B., Zytkowiak, R., Karolewski, P., and Tjoelker, M. G.: Needle nutrients in geographically diverse pinus sylvestris L. populations, Ann. Forest Sci., 59, 1–18, 2002. Petisco, C., García-Criado, B., Mediavilla, S., De Aldana, B. V.,
and Zabalgogeazcoa, I.: Near-infrared reflectance spectroscopy as a fast and non-destructive tool to predict foliar organic con-stituents of several woody species, Anal. Bioanal. Chem., 386, 1823–1833, 2006.
Pillar, V. D., Sosinski, E. E., and Lepš, J.: An improved method for searching plant functional types by numerical anal-ysis, J. Veg. Sci., 14, 323–332, https://doi.org/10.1658/1100-9233(2003)014[0323:AIMFSP]2.0.CO;2, 2003.
Porcar-Castell, A., Tyystjärvi, E., Atherton, J., van der Tol, C., Flexas, J., Pfündel, E. E., Moreno, J., Frankenberg, C., and Berry, J. A.: Linking chlorophyll a fluorescence to photosynthesis for remote sensing applications: mechanisms and challenges, J. Exp. Bot., 65, 4065–4095, 2014.
R Core Team: A language and environment for statistical comput-ing, R Foundation for Statistical Computcomput-ing, Vienna, Austria, available at: http://www.R-project.org (last acces: 21 June 2017), 2014.
Richardson, A. D. and Reeves III, J. B.: Quantitative reflectance spectroscopy as an alternative to traditional wet lab analysis
of foliar chemistry: near-infrared and mid-infrared calibrations compared, Can. J. Forest Res., 35, 1122–1130, 2005.
Sardans, J. and Peñuelas, J.: Increasing drought decreases phospho-rus availability in an evergreen Mediterranean forest, Plant Soil, 267, 367–377, 2004.
Schachtman, D. P., Reid, R. J., and Ayling, S. M.: Phosphorus Up-take by Plants?: From Soil to Cell, Plant Physiol., 116, 447–453, 1998.
Schwarz, K.: A bound form of silicon in glycosaminoglycans and polyuronides, P. Natl. Acad. Sci. USA, 70, 1608–1612, 1973. Serbin, S. P., Singh, A., McNeil, B. E., Kingdon, C. C., and
Townsend, P. A.: Spectroscopic determination of leaf morpho-logical and biochemical traits for northern temperate and boreal tree species, Ecol. Appl., 24, 1651–1669, 2014.
Sims, D. A. and Gamon, J. A.: Relationships between leaf pigment content and spectral reflectance across a wide range of species, leaf structures and developmental stages, Remote Sens. Environ., 81, 337–354, 2002.
Smart, S. M., Clarke, R. T., Van De Poll, H. M., Robertson, E. J., Shield, E. R., Bunce, R. G. H., and Maskell, L. C.: National-scale vegetation change across Britain; an analysis of sample-based surveillance data from the Countryside Surveys of 1990 and 1998, J. Environ. Manage., 67, 239–254, 2003.
Smis, A., Murguzur, F. J. A., Struyf, E., Soininen, E. M., Jusdado, J. G. H., Meire, P., and Bråthen, K. A.: Determination of plant sili-con sili-content with near infrared reflectance spectroscopy, Frontiers in Plant Science, 5, 1–9, 2014.
Sultan, S. E.: Phenotypic plasticity for fitness components in Poly-gonum species of contrasting ecological breadth, Ecology, 82, 328–343, 2001.
Tataurov, A. V., You, Y., and Owczarzy, R.: Predicting ultraviolet spectrum of single stranded and double stranded deoxyribonu-cleic acids, Biophys. Chem., 133, 66–70, 2008.
Tripathi, D. K., Kumar, R., Chauhan, D. K., Rai, A. K., and Bicanic, D.: Laser-induced breakdown spectroscopy for the study of the pattern of silicon deposition in leaves of Saccharum species, In-strum. Sci. Technol., 39, 510–521, 2011.
Turnbull, M. H., Griffin, K. L., Fyllas, N. M., Lloyd, J., Meir, P., and Atkin, O. K.: Separating species and environmental determinants of leaf functional traits in temperate rainforest plants along a soil-development chronosequence, Funct. Plant Biol., 43, 751–765, 2016.
Tyler, G.: Phosphorus fractions in grassland soils, Chemosphere, 48, 343–349, 2002.
Ustin, S. L., Roberts, D. A., Pinzon, J., Jacquemoud, S., Gardner, M., Scheer, G., Castaneda, C. M., and Palacios-Orueta, A.: Es-timating canopy water content of chaparral shrubs using optical methods, Remote Sens. Environ., 65, 280–291, 1998.
Ustin, S. L., Gitelson, A. A., Jacquemoud, S., Schaepman, M., Asner, G. P., Gamon, J. A., and Zarco-Tejada, P.: Retrieval of foliar information about plant pigment systems from high res-olution spectroscopy, Remote Sens. Environ., 113, S67–S77, https://doi.org/10.1016/j.rse.2008.10.019, 2009.
Van Soest, P. J.: Nutritional ecology of the ruminant, Cornell Uni-versity Press, 1994.
Vellend, M.: Conceptual synthesis in community ecology, Q. Rev. Biol., 85, 183–206, 2010.
Violle, C., Enquist, B. J., McGill, B. J., Jiang, L., Albert, C. H., Hul-shof, C., Jung, V., and Messier, J.: The return of the variance: In-traspecific variability in community ecology, Trends Ecol. Evol., 27, 244–252, 2012.
Weiner, J.: Allocation, plasticity and allometry in plants, Perspec-tives in Plant Ecology, Evolution and Systematics, 6, 207–215, 2004.
Wessman, C. A., Aber, J. D., Peterson, D. L., and Melillo, J. M.: Foliar analysis using near infrared reflectance spectroscopy, Can. J. Forest Res., 18, 6–11, 1988.
Westoby, M., Falster, D. S., Moles, A. T., Vesk, P. A., and Wright, I. J.: Plant ecological strategies: some leading dimensions of varia-tion between species, Annu. Rev. Ecol. Syst., 33, 125–159, 2002. Windham, W. R., Fales, S. L., and Hoveland, C. S.: Analysis for tannin concentration in sericea lespedeza by near infrared re-flectance spectroscopy, Crop Sci., 28, 705–708, 1988.
Wold, S., Sjöström, M., and Eriksson, L.: PLS-regression: A ba-sic tool of chemometrics, Chemometr. Intell. Lab., 58, 109–130, 2001.
Wright, D. M., Jordan, G. J., Lee, W. G., Duncan, R. P., Forsyth, D. M., and Coomes, D. A.: Do leaves of plants on phosphorus-impoverished soils contain high concentrations of phenolic de-fence compounds?, Funct. Ecol., 24, 52–61, 2010.
Wright, I. J., Reich, P. B., Westoby, M., Ackerly, D. D., Baruch, Z., Bongers, F., Cavender-Bares, J., Chapin, T., Cornelissen, J. H., Diemer, M., and Flexas, J.: The worldwide leaf economics spectrum, Nature, 428, 821–827, 2004.
Wu, J., Chavana-Bryant, C., Prohaska, N., Serbin, S. P., Guan, K., Albert, L. P., Yang, X., Leeuwen, W. J., Garnello, A. J., Mar-tins, G., and Malhi, Y.: Convergence in relationships between leaf traits, spectra and age across diverse canopy environments and two contrasting tropical forests, New Phytol., 214, 1033– 1048, https://doi.org/10.1111/nph.14051, 2016.
Yan, C. F., Han, S. J., Zhou, Y. M., Wang, C. G., Dai, G. H., Xiao, W. F., and Li, M. H.: Needle-age related variability in nitrogen, mo-bile carbohydrates, andδ13C within pinus koraiensis tree crowns, PLoS ONE, 7, https://doi.org/10.1371/journal.pone.0035076, 2012.