© Institute of Actuaries and Faculty of Actuaries
B
YR. J. C
HAPMAN, T. J. G
ORDON ANDC. A. S
PEED[Presented to the Institute of Actuaries, 23 April 2001]
ABSTRACT
In this paper, we identify the economic system in which occupational pension schemes operate. This system includes all parties to the pension arrangement, particularly the members of the scheme and the shareholders of the sponsoring company. This requires us to model the pension scheme not as a self-contained fund but simultaneously alongside the company, and to recognize its interaction with other parties with financial interests in the scheme. Under this method, the stakes of the various parties aggregate to 100% of the assets of the company including the assets of the pension scheme. The power of this approach is that decisions taken in relation to the management of the pension scheme can be assessed by the effect they have on the way in which the overall economic value of the company is divided between stakeholders.
KEYWORDS
Actuarial; Pensions; Funding; Risk; Financial Economics; Deflators
CONTACT ADDRESSES
R. J. Chapman, M.A., F.I.A., Bacon & Woodrow, Parkside House, Ashley Road, Epsom, Surrey KT18 5BS, U.K. Tel: +44(0)1372-733395; Fax: +44(0)1372-733991; E-mail: [email protected]
T. J. Gordon, M.A., F.I.A., Bacon & Woodrow, Colmore Gate, 2 Colmore Row, Birmingham B3 2QD, U.K. Tel: +44(0)121-262-5000; Fax: +44(0)121-262-5099; E-mail: [email protected] C. A. Speed, B.Sc., F.F.A., Bacon & Woodrow, Ivy House, 107 St. Peter’s Street, St. Albans, Hertfordshire AL1 3EW, U.K. Tel: +44(0)1727-814200; Fax: +44(0)1727-814343; E-mail: [email protected]
1. INTRODUCTION
1.1 A value-based approach to strategic pension decisions
quantifying, in value terms, who gains and who loses from decisions in relation to funding levels and investment policy. At the heart of the approach is a link between pension schemes and the concept of shareholder value.
1.1.2 For many companies, pension considerations are material in strategic and reporting terms. We reflect this by linking the cash flows for the pension scheme and the sponsoring firm, which enables us to value the interests of all parties to pension scheme transactions. This approach contrasts with the traditional actuarial approach, which is ‘scheme-centric’, i.e. focussed solely on the finances on the pension scheme. Some of the insights provided by a value-based approach confirm traditional actuarial conclusions, but some do not.
1.1.3 Companies are in business to create value for their shareholders and many do successfully and simultaneously create value for their shareholders, employees and pensioners. But some companies fail and one outcome of our approach is that it provides insights into the interaction of the solvency of companies and the solvency of pension schemes. It may therefore prove a useful tool in investigating the effects of MFR changes.
1.1.4 The paper concentrates on the financial implications of the strategic decisions taken in the course of running a pension scheme. This focus on the financial aspects is deliberate for two major reasons:
(1) the decisions taken in the running of a pension scheme are primarily about the transfer of financial stakes; and
(2) the understanding of financial risks offers the best opportunity for improved risk management in the provision of pensions.
1.2 Basis of modelling
1.2.1 Our starting point is to identify a closed economic system that includes all the key parties who have a financial interest in the pension arrangement. We refer to these parties as stakeholders. We have assessed decisions taken in relation to the pension scheme by how they affect each stakeholder’s share of the overall ‘cake’, in particular by identifying who wins and who loses.
paper demonstrates the insights that models incorporating deflators can provide in a pensions context.
1.2.3 We recognise that there is a wide range of projection models and that different models may produce different valuation results. However, we would expect all economically coherent models that are calibrated to the same initial market conditions and based on the same system of stakeholders to produce broadly the same strategic insights even though the precise valuation figures differ.
1.2.4 As well as exploring these value-based concepts using their own models, readers may wish to follow up potential research topics arising from the conclusions. Particular areas are solvency issues for weaker companies, and funding and investment policies for pension schemes that are material in relation to their sponsor. In addition, if the system of stakeholders is extended, the inclusion of new or re-defined stakeholders will result in changes to the stakes of the original stakeholders.
1.3 Structure of the paper
1.3.1 At the core of this paper are the results demonstrating how strategic decisions within a pension scheme affect the value of the different stakeholders’ interests. Sections 2 and 3 set the scene and section 4 outlines the main principles of the method. Details of the stakeholder model are given in Appendix A. The results are introduced in section 5 and discussed in detail in section 6. Section 7 includes some remarks about disclosure and summarises our conclusions.
2. CURRENT SITUATION
2.1 Current pension provision
policy is controlled by the trustees (although they are required to consult sponsoring employers).
2.1.2 Over the past 15 years, defined benefit schemes have become significantly more regulated. We now see:
— compulsory triennial MFR valuations;
— production of schedules of contributions (requiring annual re-certification);
— production of statements of investment principles; — restrictions on the tax-free roll up of scheme surpluses; — developments in company accounting requirements;
— creation of a debt on the employer when a scheme winds up (although this debt ranks only with other unsecured creditors);
— complicated overriding amendments to the priority order of benefits where there are insufficient assets on wind up; and
— minimum pension increases (in deferment and in payment).
2.1.3 Changes in the pensions regulatory environment, particularly for defined benefit schemes, are encouraging a trend of reporting clearer financial information. This in turn is pushing traditional actuarial methods of funding and investment advice gradually closer to modern financial methods. Examples of new types of reporting and disclosure include the provision of information to members in the form of the MFR and to shareholders in the form of FRS 17 (ASB, 2000).
2.1.4 In parallel, the Turnbull report has raised the profile of overall risk management for U.K. companies. This report was produced by the Institute of Chartered Accountants in England & Wales as part of its internal control requirements of the Combined Code on Corporate Governance.
2.1.5 The trend of accounting standards towards transparency through market-based reporting is likely to result in further changes in disclosure requirements for pension schemes. It is less certain whether there will be a corresponding rationalisation of other regulations, for instance the contradictory minimum and maximum funding requirements for U.K. pension schemes.
2.1.6 The overwhelming majority of new schemes set up in the U.K. in recent years have been defined contribution. Employers like cost certainty and cost reduction but this move has also been driven by:
— the increased funding costs of running a defined benefit scheme; — the risk that new legislation will impose further costs on employers;
and
— the introduction of new types of defined contribution arrangements (i.e. group personal pension plans and stakeholder pensions), which offer a reduced burden on employers.
2.2 Current actuarial advice
2.2.1 These are the key features of a typical actuarial valuation of a defined benefits scheme:
— a contribution rate will be recommended (and, in practice, a strong steer has usually been agreed beforehand with whichever party sets the contribution rate);
— the valuation method (usually the projected unit method) will target pensions earned to the date of the valuation but with projected salary increases;
— the valuation assumptions are often ‘off-market’ (usually taking advance credit for equity out-performance and sometimes taking assets into account at an off-market value);
— the actuary has scope to adjust the off-market assumptions in arriving at a contribution recommendation;
— a comment is included about the suitability of investments; and
— the actuary can choose whether to disclose the discontinuance position on an insurance cost basis, a cash equivalent basis or a ‘closed fund’ basis. The first of these is market driven, the second is in effect prescribed given that many scheme’s have adopted the MFR as their cash equivalent basis, and the third is left as a matter of ‘actuarial judgement’.
2.2.2 Valuation reports are not required to disclose the (economic) cost of the benefits, which is a key item of information for the sponsoring employer. Similarly, valuation reports are not required to disclose how much of the benefits could have been secured if the scheme had wound up at the valuation date, which ought to be one of the more interesting items for trustees and members. The omission of these important items reduces the level of transparency of actuarial valuation reports.
— indications of how the funding position will change in the future given the recommended contribution rate and the scheme’s investment strategy; or
— comments on other risks which may affect the value of the employer’s and the members’ stakes in the scheme.
2.2.4 Finally, it is often the case that the same techniques (and sometimes the same actuarial basis) as used for the formal actuarial valuation are used for:
— strategic advice to the employer, e.g. on benefit design; and
— benefit calculations, e.g. where members trade one benefit for another of the same ‘value’ as determined by the actuary.
2.3 Current investment strategies
2.3.1 Current investment strategies are typically characterised by: — large holdings in equities;
— active investment management with the objective of out-performing a peer group or benchmark;
— holdings in gilts not constrained to the duration of the liabilities; — limited exposure to bonds other than gilts; and
— control of risk being indirect only (by limits on particular asset classes and by target levels of out-performance).
2.3.2 Trustees are required to set out their investment strategy in a statement of investment principles. These often state that the trustees’ objectives are broadly:
(1) to ensure that funds are available to pay the benefits as and when they fall due; and
(2) to maximise the return on the investments subject to an acceptable level of risk.
2.3.3 The statement does not usually set out: — how risk is quantified;
— whose risk it is, or
— what level of risk is acceptable.
a stance of minimum risk, while the second indicates that risks will be inherent in the investment allocation.
2.3.5 References are sometimes made in the statement to the statutory minimum funding requirement. However, the MFR is not investible, i.e. there is no asset that moves in line with MFR liabilities. Despite this, many schemes have framed their investment strategies around the assumption that the best way of ensuring that the scheme meets the MFR is to track the asset allocation implied by MFR regulations. The Pensions Board has partly addressed this investibility issue by proposing that the MFR measure of liabilities is modified to be based wholly on bond yields.
2.3.6 In practice, investment strategies are often set on the basis of either: — experience and general rules of thumb (which tend to differ depending on the investment consultancy), e.g. ‘assets covering salary-related liabilities should be invested in 75% equities and 25% bonds’; or — an ‘asset-liability model’ where random scenarios are generated from a
plausible economic model and the results are examined to steer the trustees towards an appropriate investment strategy.
2.3.7 The rule of thumb approach has no quantitative risk justification. It is our understanding that trustees and companies who ask for a more robust risk assessment are often steered towards asset-liability modelling by their actuarial or investment advisers.
2.4 Asset-liability models – the promise
2.4.1 An asset-liability model (ALM) uses an economic model to produce stochastic simulations of returns on asset classes and other relevant economic data, e.g. inflation. The output from this model is used in calculating (approximate) liability values at different time horizons. Given an investment strategy and a contribution rate, the model produces a range of funding levels at future times.
2.4.2 The introduction of ALMs was heralded as a step forward in the financial management of pension schemes. We could quote many practitioners; Clark (1992) is typical:
2.4.3 Unfortunately, the typical application of an ALM in the pensions context seems to amount to little more than producing ‘funnels of doubt’, which serve only to demonstrate the (unsurprising) conclusion that the further into the future projections are made, the more uncertainty there is about key outputs.
2.4.4 Figure 2.1 shows a typical ‘funnel of doubt’ for one possible ALM output, in this case funding level, for a scheme with the following characteristics:
— 100% equity investment;
— liabilities valued on a market-consistent PUM basis (without any additional investment mismatch reserve);
— fixed contribution of 15% of payroll; — no discretionary benefit increases.
0% 50% 100% 150% 200% 250% 300%
0 1 2 3 4 5 6 7 8 9 10
Years from projection start date
Funding Level
95th-75th %ile
75th-50th %ile
median
50th-25th %ile
[image:8.420.56.370.235.411.2]5th-25th %ile
Figure 2.1. Funding level – equity investment strategy and 15% contributions.
results in a lower dispersion of funding levels but has a lower expected return provides little in the way of new information.
0% 50% 100% 150% 200% 250% 300%
0 1 2 3 4 5 6 7 8 9 10
Years from projection start date
Funding Level
95th-75th %ile
75th-50th %ile
median
50th-25th %ile
[image:9.420.56.371.106.270.2]5th-25th %ile
Figure 2.2. Funding level – bond investment strategy and 15% contributions.
2.5 ALMs – the reality
2.5.1 The stark contrast between the charts in Figure 2.1 and Figure 2.2 is beneficial when explaining investment risks to trustees. However, this use as an educational aid is undermined by the common practices of:
— discarding the worst scenarios (e.g. cutting the chart off at the 5th percentile); and
— labelling outcomes simply as ‘unfavourable’ or ‘very unfavourable’, without identifying the percentiles these outcomes refer to.
2.5.3 The inability to apply ALMs quantitatively stems from having ill-defined objectives. For example, Yakoubov, Teeger and Duval’s (1999), commentary on their own funnel of doubt diagrams includes the phrases “unacceptable risk of a below 100% funding level” and “unacceptable decline in the median funding level”. In quantitative terms, one would want to know to whom the risk is unacceptable and what the critical level of risk is.
2.5.4 We are interested in this paper in the ability of ALMs to provide quantitative assessment of risks. We work on the premise that the prime purpose of such a study should be to answer the question “How does a given strategy affect the value of the interests of different stakeholders, including allowance for risk?”
2.6 Other features of ALMs
2.6.1 What other information do ALMs provide? The models can provide an assessment of the likelihood of a shortfall (i.e. a funding level below 100%) occurring at a particular time. For example, if the scheme considered in section 2.4 adopts an equity strategy this leads to a shortfall at the end of 10 years in 30% of the scenarios while with a bond strategy a shortfall occurs in 26% of the scenarios.
2.6.2 What is lacking is a method of quantifying the value of the different strategies. We could assess both the frequency and magnitude of the shortfalls. For the example scheme, the equity strategy led to a shortfall in 30% of cases, and the average shortfall (given that a shortfall occurs) was £87 million. When a bond strategy was adopted, a shortfall occurred in 26% of the scenarios and the average shortfall was £19 million. However, these statistics still fail to measure the value to the stakeholders of these different strategies.
2.6.3 It is tempting for the unwary to combine the probabilities and the magnitude of the shortfalls to arrive at a value, but this approach suffers the same defects as pricing options using direct (or real world) probabilities. Some insurers have recently found the flaw in this simplistic approach in relation to their policy guarantees. For further information, see the ‘Parable of the bookmaker’ of Baxter and Rennie (1996), or any introductory text on option pricing.
amount of the deficit at the end of the projection period. This is nothing other than shortfall insurance.
2.6.5 To price these shortfalls correctly, we need either to derive ‘risk neutral probabilities’ or to use deflators (discussed in section 4.3). In either case, we find that the cost of this protection for the equity strategy is £111 million, while for the bond strategy the cost is just £10 million.
2.6.6 The cost of providing downside protection is a useful measure of the risks inherent in different investment strategies. It could be argued that this approach is too pessimistic as it costs the downside protection while taking no account of the upside the equity investment offers.
2.6.7 This could be taken into account by selling the upside. For example a call option that pays the value of the assets in excess of a given funding level, say 120%, could be sold. For the equity strategy outlined, the value of this call is £48 million. Although this provides a non-trivial realisation price for giving up the upside, it still falls well short of the £111 million cost of protection against under-funding. The results are summarised in Table 2.1.
Table 2.1. Pricing investment under and out performance
Shortfall protection for
equities
Shortfall protection for bonds
Value of upside for equity investment
Option type Put Put Call
Strike level 100% funding 100% funding 120% funding
Investment Equities Bonds Equities
Probability of option paying out 30% 26% 54%
Average payout (given payout > 0) £87m £19m £239m
Average payout £26.5m £4.8m £130m
Deflated cost £111m £10m £48 m
Implied discount rate −13.3% −7.3% +10.5%
excess of the expected return on the underlying asset. This reflects the gearing implicit in holding an option.
2.6.9 These pricing numbers are useful in quantifying the risks when choosing an investment strategy. However, they are still not sufficient to give the full picture, which involves the quantification of transfers of value between the different stakeholders.
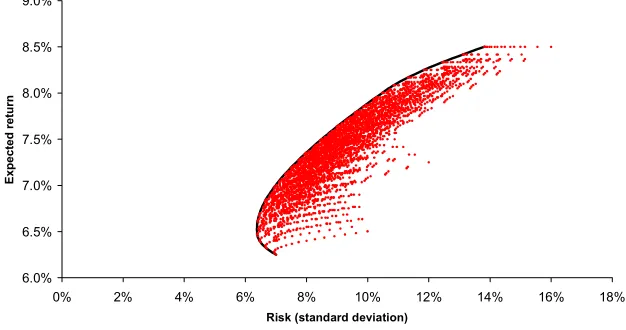
2.6.10 Another common attempt to answer the risk/reward question in the context of the pension scheme has been to produce graphs that show ‘risk’ versus expected return. At first sight, such graphs are similar to those that arise in modern portfolio theory. Different portfolios are constructed and a boundary known as the ‘efficient frontier’ is found where for a given expected return, the ‘risk’ (usually taken to be the standard deviation) of the portfolio is minimised. A typical plot is shown in Figure 2.3: the dots represent different possible portfolios and the black line traces portfolios on the efficient frontier.
6.0% 6.5% 7.0% 7.5% 8.0% 8.5% 9.0%
0% 2% 4% 6% 8% 10% 12% 14% 16% 18%
Risk (standard deviation)
[image:12.420.53.366.273.438.2]Expected return
Figure 2.3. Risk and return plot.
make sense if we plotted them separately for each stakeholder and if we included in the analysis all the stakeholders’ other financial assets and liabilities. In other words, seeking to optimise portfolios in this manner for a corporate entity is the equivalent of seeking an optimal portfolio for only a portion of an individual’s wealth. Not only does this make little sense, but it leads to a blanket solution for individual stakeholders irrespective of their actual financial state and risk preferences.
2.6.12 ALMs do provide some useful, if ‘scheme-centric’, insights into pension developments. But the various possible approaches described above do not tell us enough to be able to place values for each set of stakeholders on the different possible strategies.
2.7 Agency costs
2.7.1 Stakeholders cannot make optimal financial decisions unless they have accurate information. This applies as much to pension funding as, for example, to new capital projects. Accounting standards and other regulations are examples of attempts to inform all interested parties about a wide area of corporate issues, including pensions.
2.7.2 Shareholders often appoint managers to run a business on their behalf. However, it is unlikely that the managers will be motivated purely to maximise shareholder value. Instead, managers may seek to maximise some combination of their pay, job security and future job prospects.
2.7.3 Shareholders can monitor their appointed managers or provide incentives to align the manager’s interests with the shareholders’ interests. These arrangements collectively constitute what has come to be known as corporate governance. The additional costs of corporate governance, together with any reduction in shareholder value resulting from their managers not acting to optimise shareholder value, are known as agency costs. The seminal reference on agency costs is Jensen & Meckling (1976), although since then whole consultancy businesses have been built on the back of advising how to reduce agency cost – further and more up-to-date details are set out in Chew (1999). Shareholders have to trade the cost of corporate governance against the cost of the managers not acting solely in their interests.
2.7.5 The corollary is that the better members understand their scheme, the more easily they can place a value on the benefits being offered. This suggests that shareholder value is created when pension scheme design is simple and communications are effective.
2.7.6 In summary, financial transparency acts as a driver to recognising economic values and so to reducing agency costs. Accordingly, we welcome the main proposals contained in FRS 17.
3. PROPOSED APPROACH
3.1 A value-based approach
3.1.1 The trend for more disclosure and information leads us to seek a method whereby actuarial advice could become cleaner and clearer. This would leave us to focus on the ‘added-value’ elements that actually matter to the stakeholders. Achieving this aim requires the actuarial profession to take on board some key concepts from finance theory. Actuarial knowledge of liability structures will remain an integral skill in providing robust advice.
3.1.2 We suggest that the above objective could be met if actuaries: (1) disclosed clearly the effect of different courses of action on the various
stakeholders; and
(2) used the same market-consistent basis for their advice regardless of the recipient of the advice.
3.2 Improvements to the current approach
3.2.1 Advice in relation to benefit design, pension scheme funding and investment is often:
— opaque in derivation and at odds with basic economic constraints, leaving actuarial advice open to external criticism and vulnerable to manipulation; and
3.2.2 Switching to a narrower range of acceptable actuarial bases would in itself be a significant step towards clarity and simplicity. One very relevant example is that it is fruitless to generate a debate about the size of the ‘equity risk premium’ to use in funding bases because risk premiums do not appear in the assessment of economic cost (see e.g. Copeland & Weston, 1988 or Brealey & Myers, 1996). In any case, the equity risk premium is an untestable figure with estimates ranging from 2% to 10% a year.
3.2.3 There are also advantages for the profession if we adopt a benchmark approach that is internally consistent and coherent. We could then:
— defend our advice in public more robustly;
— minimise the number of U-turns, such as those on the MFR and on company pensions accounting; and
— use the benchmark to cross-reference off-market advice. 3.3 Comments on ‘long-term’ advice
3.3.1 Actuarial advice has often been characterised, and justified, by appeal to the ‘long-term’. For example, the ‘long-term view’ has been given as the reason for the heavy equity investment by U.K. pension schemes.
3.3.2 Can we unpick the ‘long-term view’ and reconcile it with the economic value approach? The answer is that the ‘long-term view’ omits explicit consideration of the risks attaching to investment. So, for example, advance credit is taken for some or all of the expected returns on equities but no allowance is made for risks.
3.3.3 It is not so easy to ignore risks in the short-term view because this is the end of the spectrum at which disclosure and the regulators bite. And even if disclosure and regulation were relaxed, the risks themselves would not go away.
3.3.4 The explanation of the ‘long-term view’, under which risks are selectively ignored, is that it assumes the employer has infinite resources to absorb any series of reverses that might cause the company to go into liquidation or to wind-up its pension scheme.
3.4 Market-consistent assumptions
3.4.1 The value of any cash flow stream is equivalent to the value of a matching asset. Accrued pension liabilities (excepting mortality risk) can be priced by a bond portfolio. Hence discounting liabilities at rates implied by bonds produces an economically-consistent price for the liabilities. We are aware that a shortage in duration of available bonds may give rise to reinvestment risk for very long-dated liabilities, but these are typically the least financially significant part of the total pension liability being considered (i.e. younger members, who tend to have low accrued pensions). We use the terms ‘price’ and ‘value’ interchangeably as price is the monetary expression of value.
3.4.2 There is a debate about whether gilt or corporate bond yields should be used when valuing the liabilities. The difference in yield between, for example, investment grade corporate bonds and gilts is the sum of the liquidity premium and the credit risk premium.
3.4.3 Pension promises are typically illiquid and hence the matching portfolio should also contain illiquid assets. There are technical issues with incorporating allowances for illiquidity in a simple model because, for instance, it implies no clear market price exists for the asset and hence it is difficult to value liquidity risk. In this paper, we have used gilt rates for our modelling.
3.4.4 The issue of credit risk of a pension scheme is, we think, more clear-cut. Credit risk can and should be modelled directly because the credit risk will favour one party at the expense of another and therefore involves an exchange of wealth. A subjective adjustment to a discount rate is an inaccurate and potentially misleading way of dealing with this risk. 3.5 Projected unit funding method
3.5.1 The general overall method for funding U.K. pension schemes is the ‘projected unit’ method (PUM) as set out in the actuarial guidance note ‘GN26: Pension Fund Terminology’. This method has typically been allied with slowly changing, off-market actuarial assumptions and ‘smoothed’ (i.e. also off-market) values of assets. These practices still have a significant following – see, for instance, the summary of the range of actuarial assumptions used by different actuaries in PwC (2000).
— statutory revaluation in deferment (and the fall in inflation expectations) means that discontinuance benefits are, in current economic conditions, primarily index-linked;
— the limited price indexation of pensions in payment means that pension increases are now generally prescribed rather than discretionary;
— the fall in long-dated interest rates following the 1998 Russian debt crisis means that the cost of securing accrued benefits, especially those with fixed increases (e.g. in deferment GMPs), has increased;
— the statutory minimum funding requirement (in combination with the debt on the employer regulations) means that much of the deficit in a pension scheme sponsored by a still solvent employer can be recovered; and
— PUM ‘past service reserves’ are not always greater than the value of discontinuance benefits.
3.5.3 Against this background, it seems odd to us that actuaries should continue to focus on an ongoing funding method that has as its a funding target a subjective measure.
3.5.4 In the current subjective circumstances, the interactions between ongoing and discontinuance methods are difficult to unravel. We suggest that the solution is to start from something objectively measurable, i.e. the discontinuance position, and to use this as a benchmark from which to determine contributions.
3.6 Defined accrued benefit method
3.6.1 McLeish & Stewart (1987) put the case for using an alternative method to PUM very eloquently.
“It seems to us … that the prime purpose of funding an occupational pension scheme must be to secure the accrued benefits … in the event of the employer being unable or unwilling to continue to pay at some time in the future. To that end, the contributions would have to be sufficient both to pay the benefits as they fell due for as long as the scheme continued, and also to establish and maintain a fund which would be sufficient to secure the accrued benefits in the event of contributions ceasing and the scheme being discontinued, whenever that might occur.”
is covered. The DABM takes no account of future salary increases in assessing a scheme’s funding position and so does not place a liability on the balance sheet for them. With these characteristics, and substituting fully market-consistent assumptions, the DABM becomes a coherent method for funding defined benefit schemes in the current regulatory environment.
3.6.3 It is worth noting that in 1987 the funding levels implied by DABM were well below the norm at that time. Regulatory requirements have since then closed the gap between discontinuance reserves and ongoing reserves, especially when ongoing valuations frequently resort to off-market assumptions.
3.6.4 If the party responsible for determining the company contribution rate in a defined benefit scheme in practice wishes to fund a scheme at a lower level than 100% of accrued benefits then this might be a reasonable course of action. However, we believe that actuarial advice should be clear about this, and that conflicts will arise if we use opaque methods and off-market assumptions that have the effect of presenting such schemes as fully funded. The use of the DABM coupled with market-consistent assumptions and a target fund that reflects the required level of security (measured against the level of benefits which can be secured on discontinuance) would make this clear.
4. OVERALL FRAMEWORK
4.1 Economic system and stakeholders
4.1.1 We first consider the scope of the economic system by identifying the stakeholders. For a typical U.K. pension scheme, the stakeholders will include:
— current pension scheme members;
— current employees who are potential future members;
— company shareholders (or, more generally, the owners of the enterprise);
— company creditors, especially holders of loan stock issued by the company;
— the Government, represented by the Inland Revenue;
— professional advisers, including wind-up administrators and investment managers, a group we have called collectively ‘consultants’; and — suppliers and customers, a combined stakeholder group whom we refer
to as ‘externals’.
4.1.2 Some of these categories can be further subdivided. For example, we could split pensioner and active pension scheme members, these two groups effectively being subject to different economic contracts.
4.1.3 If we were to consider only a subset of the stakeholders, then an impression could be given that a particular funding method or investment strategy would benefit all parties. Of course, this would usually be happening at the expense of the stakeholder excluded from the analysis. 4.2 Pensions – an economic contract
4.2.1 An occupational pension is an economic contract between employer and employee. The totality of these contracts is significant in the context of the U.K. economy; in the U.K. private sector there were 151,000 funded pension schemes recorded in the Government Actuary’s 1995 assessment (Government Actuary’s Department, 1998) and assets held by U.K. pension schemes as a whole are about £800bn according to the Faculty and Institute of Actuaries (2000).
they all operate. Within our framework, which could be applied to any economic contract, we place values on the interests of different stakeholders and examine how they are affected by different strategies.
4.2.3 The characteristic of the stakeholder approach is that it tracks and values the cash flows generated within the economic system under various strategies. Although actuaries do not generally use this approach, it should be more within their ‘comfort zone’ than for many other finance professionals.
4.3 Deflators
4.3.1 The method of assessing stakeholder values involves stochastic projections of asset and liability cash flows. Each projection represents a simulation of the various cash flows within the defined system and we use deflators to value these cash flows. Deflators work as stochastic discount factors and each simulation produces a different realised value for the deflator. The amount of particular cashflows differs between simulations; equities for example have more volatile cashflows than gilts. The cash flows are multiplied by the deflator and the average is taken over all simulations. The effect is that the cashflow in a particular projection is weighted according to the economic characteristics emerging in that projection. The consequence of using deflators is that cash flows for separate asset classes discount back to their market value at time 0, i.e. they retain economic coherence. The values of liability cash flows reflect the economic characteristics of each projection and their present values are derived in the same way.
4.3.2 Deflators were first introduced by Arrow (1953), although their first appearance in the actuarial literature was at the 1991 AFIR International Colloquium (Ami et al., 1991). Smith (1996) introduced the concepts to the U.K. profession and, more recently, an introduction to deflators for actuaries has been published by Jarvis, Southall & Varnell (2001). A rigorous approach to deflators in a conventional Brownian motion setting can be found in Duffie (1996).
4.3.3 The advantages of using a model based on deflators are as follows: — values can be placed on the stakes of all stakeholders;
— the values will be consistent with market conditions if the deflator model is calibrated against relevant market indicators;
(because the result is independent of the value of the risk premium), appears to have confused actuaries unused to the mathematical formalism; and
— many market models, such as those frequently used to price options, rely on the existence of a perfect dynamic hedge (which equates to the unrealistic assumption of a complete market) whereas deflators can be generalised to incomplete markets.
4.3.4 The deflator technique allows us to replace the ALM ‘funnels of doubt’ in section 2.4 above by an analysis of how the overall value of the enterprise, including pension assets, is shared between the various stakeholders. This gives us a framework to compare who wins and who loses as a result of particular decisions and strategies, which we will explore in detail in section 6.
4.3.5 When setting up a deflator-based model there is an issue in deciding what tax treatment should be applied to the cash flows modelled. This reflects the different tax treatment cash flows receive in the hands of different investors. We have modelled the cash flows from assets for a tax-exempt investor, as this is consistent with the financial assets being held in the pension scheme. Where tax flows directly impact the system we have modelled these explicitly (i.e. income tax and corporation tax).
4.3.6 If we include in our analysis other stakeholders who face differential tax rates then, for a model calibrated to non-taxed cash flows, we would have the possibility of tax arbitrages. These arbitrages would not be necessarily be a flaw of the model as tax-arbitrages do exist. We encourage others to take up the challenge implicit in Modigliani & Miller’s famous irrelevance proposition 1 (Modigliani & Miller, 1958) and explore how corporations can take full advantage of differential taxation.
4.4 The economic value of pension promises
4.4.2 In these terms, a defined benefit promise is effectively a debt, i.e. a liability of the employer, upon which a value may be placed. Recognising this, we can identify debt instruments traded on financial markets that are closest to replicating the pension promise in cash flow terms. The market value of these instruments can be used to establish an objective economic value for pension promises.
4.4.3 In comparison, traditional actuarial methods have not been directed towards putting an economic, or market, price on defined benefit pension promises. The exception is at discontinuance, where actuarial valuations normally coincide with economic valuations.
4.5 Transfers of value
4.5.1 A first order analysis suggests that switching assets within a pension scheme cannot, following Black (1980) and Tepper (1981), create value. But switching pension investments can, and usually does, result in a transfer of economic value between stakeholders.
4.5.2 For example, if surpluses are shared between the sponsor and members, switching assets into equities may have the effect of increasing the value of the stakes of members, particularly pensioners. This is because the extra volatility in funding level resulting from equity investment means pensions are more likely to receive discretionary increases.
4.5.3 The question is: who has paid for this increase in the value of the members’ stake? In a closed system, an increase in value for one set of stakeholders results in a reduction for another set. Many strategic actions result in wealth transfers between stakeholders and in some cases these transfers are unintentional.
4.5.4 For sound and transparent financial management we need to help our clients to identify the winners and losers from any action and to assess for them the magnitude of the wealth transfer.
4.6 Modelling the employees’ stake
4.6.2 The cash benefits modelled take account of benefits in addition to basic pay, including an element of profit-related pay, and a differential rate of pay is included for non-pension scheme members.
4.6.3 There is a trade-off between the provision of cash benefits and pension provision (i.e. deferred pay). In the event of pension provision being reduced it would be logical to expect the employees to seek compensation by negotiating higher benefits elsewhere in their remuneration package, see Exley, Mehta & Smith (1997). It would then follow that shareholders would not gain at the employees’ expense by curtailing pension benefits.
4.6.4 However strategic decisions do affect the value of the pension promise. For example in section 6, we show how a change of investment policy, or actuarial assumptions can alter the stakes of different stakeholders. In practice, we do not see evidence of employees negotiating higher salaries as a result of, for instance, a change in the pension scheme’s funding basis or investment strategy. This may in part be due to the lack of clarity in pension reporting that makes it difficult for employees to accurately value pension promises made by employers. We also note that pensioners are not in a position to negotiate higher benefits to compensate for reduced pensions. Therefore, we have not modelled compensating effects on the non-pension benefits that may result from strategic decisions affecting the pension scheme.
5. RESULTS – INTRODUCTION
5.1 Details of statistical model
5.1.1 Details of the model developed to value the financial interests of the stakeholders in a pension arrangement are given in the appendices.
5.1.2 All the results presented are based on projections of the cash flows over a period of 10 years. This time horizon was used as it produced convergence of the calculated stakes. Testing indicated that this horizon was sufficient for the stakes calculated to be accurate to within 0.1% of the total value of the combined entity.
5.2 A base case for comparison
5.2.1 In this section we specify the benchmark case that we use for comparative purposes in presenting the main results.
5.2.2 The benchmark pension scheme has the following features: — pension discontinuance liabilities £230 million at the outset;
— market value of the ongoing pension liabilities at the start of the projection £267 million;
— ongoing funding method is Projected Unit Method (PUM);
— valuation assumptions are derived from current market conditions; — salary inflation assumed to be 2% in excess of price inflation;
— 100% funded on an ongoing basis at the start of the projection period; — assets invested 100% in equities;
— value of pensioner liabilities initially 45% of total scheme liabilities on PUM basis; and
— surplus is measured on an ongoing basis and split 20% to augment pensions in payment and 80% to reduce company contributions over a period of 5 years.
5.2.3 The sponsoring company has the following features: — a total value of realisable assets of £385 million;
— a total combined value of the company and pension scheme of £652m, of which PUM liabilities are 41%;
— a dividend policy of distributing 50% of its reserves, subject to the dividend not changing by more than 10% in any year;
— it is financed by loan stock, share capital and shareholder funds such that initial borrowing ratio, defined as total loans divided by shareholder capital and shareholders funds, is 35%.
5.2.4 The capital of the benchmark company was constructed to reflect the median gearing of companies in the FTSE All Share Index (source Datastream).
5.3 Results for the base case
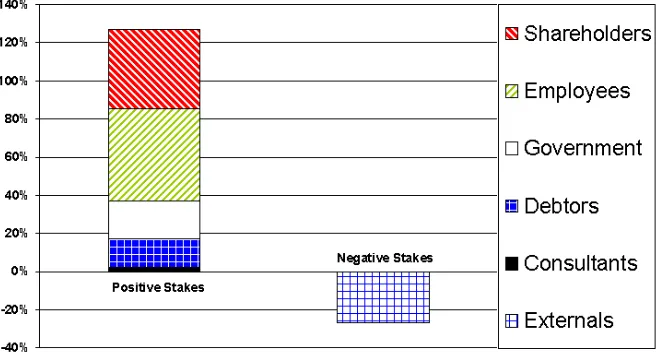
[image:25.420.46.376.308.485.2]5.3.1 For the base case, the stakes of the different stakeholders are shown in Figure 5.1. The stake of the shareholders represents the market value of the equity of the company. In the base case, the value of this equity, i.e. the company’s equity market capitalisation, is £270 million. Where we show the effects of changes in the shareholders’ stakes, these represent the change in share value consistent with the market’s current valuation of the company. We note that empirical tests would be unable to validate the size of these changes, as it is not possible to isolate the impact of a single new piece of information on a share price.
5.3.2 The sum of all the stakes is equal to 100% of the value of the combined entity of the company and pension scheme. Employees (which group includes ex-employees) have the largest stake representing 48% of the total value of the entity; this represents their total benefits package including pension provision. The other major stakeholders are shareholders (41%), Government (20%) and debtors (15%). In contrast, the share of externals is negative because it acts as a measure of the economic value added by the firm’s operations. The externals’ stake measures the payments by the company to suppliers for materials and services less the revenues it receives from its customers. For a company that normally operates profitably, the stake of externals will therefore be negative.
5.3.3 In the base case, the company enters liquidation and the pension scheme is wound up in 4.0% of the scenarios. This figure was calibrated within the model to data on the company loan stock defaults reported in Moody’s Investment Service report (2000). We have not modelled the option for the company to wind up the pension scheme whilst its trading activities continue.
5.3.4 The lender of last resort, although included in the modelling, has been omitted from the charts because this stake (and change in stake) was insignificant compared with the stakes of the other stakeholders.
5.4 Tests to be considered
5.4.1 In the next section we consider a range of different strategies that we compare to the base case. The strategies that we explicitly consider are: — funding strategy;
— investment strategy;
— scheme surplus distribution and deficit amortisation periods; and — dividend policy.
5.4.2 In addition, we shall consider the relation between scheme size, scheme maturity and investment strategy.
5.5 Risks highlighted by the results
that, by considering a closed economic system, for every loser there is a winner, hence a risk that has a negative effect for one stakeholder will create a positive effect for other stakeholder(s).
— Benefit leakage. If surpluses are shared with the employees then this will make a positive contribution to the employees’ stake. The size and frequency of these discretionary increases will be influenced by the investment strategy.
— Strong company balance sheet. This could be the result of a slow pace of pension funding or a low rate of distribution of company funds to shareholders. Whatever the cause, extra reserves on the balance sheet will decrease the risk of the company entering liquidation. Hence salaries continue to be paid and pension rights accrue in more scenarios.
— Low funding level. This will stem from a slow pace of funding or from a volatile funding level. Employees will often lose out due to the reduced security of benefits.
— Volatile funding levels. On the downside these could result in default on the pension promise; equally on the upside, where surplus is shared, extra discretionary benefits will arise.
— Option to default on pension promise. The shareholders may avoid paying the pension promised if the company enters liquidation and insufficient funds are available to meet discontinuance rights. In some circumstances, a high-risk strategy may be beneficial to the shareholders as they have the option to default if the strategy fails, but may reap rewards if it is successful. High borrowing ratios and high-risk investment strategies would enable the shareholders to maximise the value of this option.
— Failing to minimise tax. If funds are not allocated to minimise tax liabilities, the Government will take a higher share of the economic value of the entity.
— Leakages to advisers. If two strategies are the same in other respects then the strategy that minimises the payment to external advisors should be preferred.
5.6 Cash flows excluded from the analysis
5.6.1 The model considers all cash flows between the company (including the pension scheme) and other parties who have a financial interest in the scheme. As such it is a micro-economic model focusing on a single company (or industry).
5.6.2 As with any model, the object is not to produce an exhaustive description of all aspects of the real world but to focus on the key aspects that enable insights to be gained. We have therefore prescribed the model to include those stakeholders identified in section 4.1 above. In our view, for the analysis of a corporate pension scheme, redefining the closed system to include additional stakeholders would result in second order effects that would not alter the conclusions regarding the company and pension scheme.
5.6.3 The model does not consider cash flows between third parties. For example, tax payments made by employees to the Government as a result of other income are not modelled. Similarly, the Government’s stake does not include the tax flows arising from dividends being paid net of tax, as opposed to debt payments that are made pre-tax. If these tax flows were included, they would show an increase in the Government’s stake from pension schemes holding equities.
5.6.4 When analysing any financial problem, the stakeholders and cash flows to be modelled will be determined by the focus of the investigation. If we were to consider the Government’s overall interest in pension provision, other effects would need to be included. For example, by making pension provision, employees are removing their entitlement to means-tested social security benefits in retirement. A complete model of all Government involvement would have to include all social security benefits as well as the tax incentives offered for pension provision.
6. RESULTS – DETAIL
6.1 The impact of different funding strategies
6.1.1 In this section 6, we consider how different strategies affect the stakes of the different stakeholders. We look at the pace of funding, at investment policy and at the size of the scheme in relation to the company.
6.1.2 First we consider the pace of funding and compare new strategies with the base case described in the previous section (market-consistent PUM). The different funding strategies considered are:
— market-consistent DABM;
— PUM basis incorporating 1% p.a. loading on the discount rate; — PUM basis incorporating 6% p.a. loading on the discount rate; and — market-consistent PUM with contributions fixed as a percentage of
payroll.
6.1.3 These strategies are all examples of altering the pace of funding. In each case the pension scheme is set up to be 100% funded on the ongoing basis. Choosing different bases alters the absolute amount of assets in the pension scheme. The value of the combined entity of the company and the pension scheme is maintained by a compensating adjustment to the company’s reserves. This ensures that an economic entity with the same total value is considered.
6.2 Moving from PUM to DABM
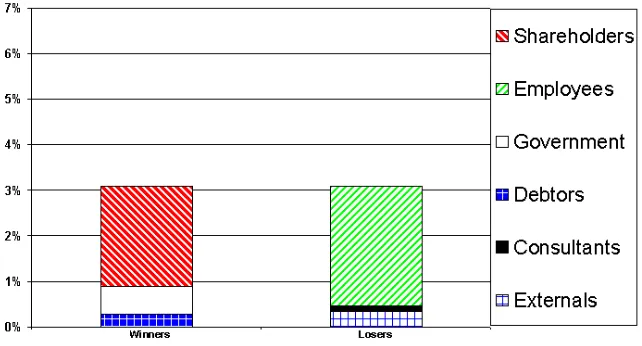
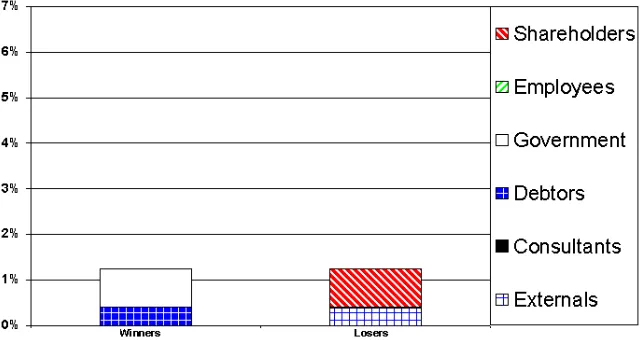
Figure 6.1. Changes in stakes – moving to a DABM equity strategy. 6.2.2 The clear winners from the change in funding method are shareholders, primarily at the expense of employees. This is the result of the slower pace of funding implied by the DABM.
6.2.3 The gain in the stake of shareholders arises from the reduced number of liquidations and because the slower pace of funding increases the chance of the pension promise not being met in full in the event of a company liquidation. This increase in the shareholders’ stake of 4.4% of the total value of the combined entity is equivalent to an appreciation of 11% in the share price.
6.2.4 The Government also gains from this strategy as money held within the company is subject to a higher average rate of tax than money inside the pension scheme. More tax is payable to the Government and tax also continues to be paid in more scenarios. Debt holders also gain from the reduced numbers of liquidations.
winding-up because they are more likely not to receive their pension entitlement. This outweighs the impact of employees receiving salaries and pension benefits in more scenarios.
6.2.6 There are other ways in which the pace of funding can be altered. The next section looks at different ways of adjusting the pace of funding assuming that, as in the base case, the pension scheme continues to invest in equities.
6.3 Adding a loading onto the discount rate
6.3.1 In practice many actuarial valuations start from market-derived assumptions and then increase the discount rate used. If an attempt is made to justify the increase it is usually based on claiming advance credit for expected excess equity returns over bonds (the equity risk premium). This premium however is compensation for the additional risk associated with equity investment and is already reflected in the price. Hence loading the discount rate double counts the risk premium (see Gordon 1999).
Figure 6.2. Changes in stakes – adding a 1% p.a. loading onto the discount rate for a PUM funding strategy.
6.3.3 The winners and losers are the same as for the change to the DABM funding method.
6.3.4 Many have argued that 1% p.a. is a significant under-estimate of the expected excess return from investing in equities and a larger loading should be used. Indeed commentators point to historic out-performance of equities over bonds in excess of 6% p.a. (over certain periods in the U.K. and the U.S.) as demonstrating that actuarial methodology is ‘chronically conservative’.
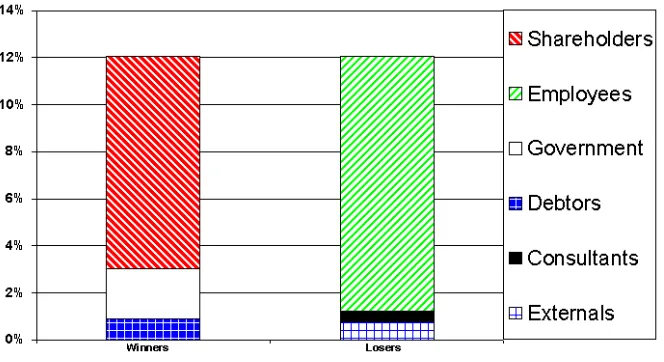
Figure 6.3. Changes in stakes from adding a 6% p.a. loading onto the discount rate for a PUM funding strategy.
6.3.6 The winners and losers have not altered but the shift in wealth from employees to shareholders is significant. In monetary terms, we have a combined entity of company and pension scheme with a value of £652 million, where the pension scheme has £267 million of liabilities (ongoing market consistent PUM basis). Using the 6% p.a. loading on the discount rate increases the shareholders stake by £59 million (9% of the total entity, or a 22% share price appreciation) and decreases the stake of employees by £70 million (11% of the total entity).
6.4 Pace of funding – summary
Table 6.1. Impact of slowing the pace of funding
Shareholders Gain. Money retained in the company is available for distribution, also benefit from fewer liquidations.
Employees Lose. Less security in the pension scheme resulting in reduced benefits in the event of the pension scheme winding-up.
Government Gain. Higher tax rate on money outside of the pension scheme. Debtors Gain. Stronger balance sheet, fewer defaults.
Consultants Lose. Less money in the pension scheme on which fees can be earned and receivership income diminishes.
Externals Lose. Reduced number of wind-ups results in externals contributing more to the operations of the continuing entity.
6.5 Stability of contributions
6.5.1 Stability of the contribution rate is often listed as a priority when considering a funding method. Rather than actuaries adjusting assumptions to provide the rate required, the sponsor could agree to pay a fixed contribution rate irrespective of the funding position of the scheme. This would provide a defined benefit scheme with the stability of contributions associated with defined contribution schemes.
Figure 6.4. Effect of paying a fixed contribution of 20% of payroll. 6.5.3 When the scheme is in surplus, the sponsor continues to pay contributions of 20% of payroll without any reduction to amortise surplus. Similarly contributions are not increased when the scheme is in deficit. Figure 6.4 shows that employees benefit from this strategy mainly at the expense of shareholders.
6.5.4 This transfer of wealth to employees could be interpreted as too high a contribution being paid into the scheme. Turning this around, we could search for a contribution rate that did not alter the stake of employees.
Figure 6.5. Effect of paying a fixed contribution of 15% of payroll. 6.5.6 Paying 15% of payroll results in the stake of employees not altering compared with paying the contribution derived from a market-consistent PUM valuation. The PUM basis increases contributions when the scheme is in deficit so reducing the risk to employees of default on the pension promise. The fixed contribution of 15% of payroll results in contributions being maintained even if the scheme is in surplus, and so employees benefits from the discretionary increases.
6.5.7 Figure 6.5 also shows that shareholders are losers. Hence paying a fixed contribution is an inefficient strategy as shareholders lose but employees do not gain; the main beneficiary is the Government. Under a fixed contribution strategy the combined stakes of employees and shareholders decreases compared with paying a higher average and more volatile contribution implied by a market-consistent valuation.
6.6 Funding strategy – key stakeholder summary
Table 6.2. Impact of different strategies on shareholders and employees.
New strategy Shareholders Employees
DABM funding +4.4% −5.3%
PUM 1% p.a. risk premium +2.2% −2.6% PUM 6% p.a. risk premium +9.0% −10.9%
Fixed 20% contributions −0.8% +0.5%
Fixed 15% contributions −0.8% 0.0%
6.7 The impact of investment strategy
6.7.1 Another key area where actuaries influence the financial management of pension schemes is the setting of investment strategy. We start by considering two situations:
— moving to a bond investment strategy (using market-consistent PUM funding methodology);
— the interaction between changing to a bond investment strategy and payment of discretionary benefits.
6.7.2 In each case we define a bond strategy to be 50% investment in fixed gilts and 50% in index-linked gilts.
Figure 6.6. Moving to a bond based strategy with PUM funding strategy. 6.7.4 The winners from the strategy are shareholders, who gain as a result of smaller surpluses having to be shared with employees. The size of this change is equivalent to a 6% appreciation in share price. The Government also gains as the lower funding level volatility means that surplus funds are not generated in the tax shelter of the pension scheme (although not all cash flows relevant for a comprehensive analysis have been modelled as noted in 5.6.3 above). The lower volatility of the funding level also feeds through into lower volatility of pension contributions, which benefits the debt holders. All the winners benefit from the reduced number of liquidations.
6.7.5 The stakeholders who lose from the move to the bond investment strategy are employees, consultants and externals.
6.7.6 The employees lose out as the bond investment strategy generates less surplus from which discretionary increases can be paid. The consultants lose from the lower fund management charges and fewer wind-ups. The share of externals decreases as in more scenarios they continue to provide the raw materials and services that the company uses to generate profits.
Figure 6.7. Impact on the different employee stakes of moving to a bond based strategy with PUM funding strategy.
6.7.8 Pensioners are the only group significantly affected. It is unclear from Figure 6.7 alone the extent to which the change in stakes from the new investment strategy is caused by the sharing of surplus. To investigate this, we repeat the comparison but with no surplus leakage to employees.
Figure 6.8. Moving to a bond based strategy with PUM funding strategy and no surplus distribution to employees.
6.7.10 If surplus in the pension scheme is used solely to reduce future contributions from the sponsor and not to enhance pensions in payment, then the employees stake is larger for a bond-based strategy. This effect is demonstrated by Figure 6.8. The employee’s stake in the combined economic entity of the pension scheme and the company is a function of the investment strategies adopted and whether the surplus in shared. Table 6.3 shows the size of the employees’ stake for the all combinations considered.
Table 6.3. Impact of Investment strategy on the employees’ stake.
Investment strategy Employees’ stake as a proportion of the total
Equities (with surplus distribution) 48.4% Bonds (with surplus distribution) 46.0% Equities (no surplus distribution) 43.4% Bonds (no surplus distribution) 44.3%
6.8 Summary – move to bond strategy
6.8.1 The impact on all the stakeholders is set out in Table 6.4 below. Table 6.4. Impact of a change to bond investment.
Shareholders (with
surplus distribution) Also fewer wind-ups benefit shareholders. Gain. Lower volatility in funding level leads to less benefit leakage. Employees (with
surplus distribution)
Lose. As discretionary increases are less valuable.
Shareholders (no surplus distribution)
Lose. Option to default on pension promises in the event of the company entering liquidation has decreased in value.
Employees (no surplus distribution)
Gain. Lower level of volatility reduces wind-ups, benefit from receiving pensions and pay.
Government Gain. Receive tax in more scenarios. Debtors Gain. Fewer defaults, lower volatility.
Consultants Lose. Lower investment fee income and fewer company liquidations.
Externals Lose. Reduced number of wind-ups results in externals contributing more to the entity.
6.9 Impact of deficit amortisation periods and surplus distribution
6.9.1 The analysis so far has assumed that deficits are amortised over a 10 year period and surpluses repaid as contribution reductions are spread over a 5 year period. We now investigate the impact of varying the deficit amortisation period.
Figure 6.9. Changing the deficit correction period to 5 years for a PUM strategy with equity investment.
6.9.3 Note that both shareholders and employees are winners as a result of this change. Although the percentage changes are small compared with some of the other strategies, this result is significant because it illustrates that the key stakeholders can benefit in aggregate.
6.9.4 Employees benefit because the shorter deficit correction period is equivalent to an increased pace of funding which, as seen earlier, increases their stake. This increase is sufficient to offset the loss they experience due to the increased number of liquidations. More surprising is the gain experienced by shareholders. Although they pay for the increased rate of funding implied by the shorter deficit correction period this is offset by the tax efficiency of this strategy. Consultants gain from higher funding in the pension scheme and more company liquidations. Externals also gain (i.e their stake is less negative) because of the increased number of liquidations. 6.9.5 The losers are the Government, which receives less tax as more money is sheltered in the pension scheme, and debtors who suffer a higher rate of default.
Although this is just one of a number of proposed changes in the MFR basis, the impact on the stakeholders is interesting. This is shown in Figure 6.10 below where a 1% p.a. loading on the discount rate for non-pensioners has been assumed. With a 10 year deficit correction period the percentage of scenarios where the company enters liquidation is 2.7% (as noted in section 6.3.2 above). With a 5 year period, liquidations are at the 4.5% level.
Figure 6.10. Extending deficit correction period from 5 to 10 years for PUM funding strategy with 1% p.a. loading on the discount rate. 6.9.7 Figure 6.10 is very different from Figure 6.9 with the shareholders now being winners from a longer deficit correction period. This is a result of the interaction of the deficit correction period and the 1% p.a. loading on the discount rate.
default remains ‘nearer the money’ for longer and so has greater value. Hence for a 1% p.a. loading on the discount rate the stake of shareholders increases significantly with the deficit correction period. However, when no loading on the discount rate is used the option is ‘out of the money’, has little value and the tax shelter effect of the pension scheme is more important.
6.9.9 The similarity between Figure 6.10 where the deficit correction period is extended to 10 years and Figure 6.2 where an additional 1% p.a. loading on the discount rate was introduced is striking. This suggests that the proposed increase in the deficit correction period for the amendment to the MFR produces a similar transfer of wealth between from employees to shareholders as increasing the loading on the discount rate used by 1% p.a.. However, the interaction between deficit correction periods and additions to the discount rate are non-linear. In Table 6.5 we summarise the effects of changing the deficit correction period and making additions to the discount rate for non-pensioners. Comparing the different strategies demonstrates that lengthening the deficit correction period from 5 to 10 years has a larger adverse impact on the employees’ stake than adding a further 1% p.a. to the discount rate (i.e. using a 2% p.a. addition). This shows that members’ interests would be better served by maintaining the current deficit correction period even at the expense of a higher addition to the discount rate. Interestingly, the sponsor’s stake does not change significantly.
6.9.10 The results of these different effects are summarised in Table 6.5 below.
Table 6.5. Summary of different strategies and their impact on shareholders and employees.
Strategy 1 2 3 4 5
Funding method PUM PUM PUM PUM PUM
Risk premium 0% p.a. 0% p.a. 1% p.a. 1% p.a. 2% p.a. Deficit correction period 10 years 5 years 10 years 5 years 5 years
Stakes
– shareholders 41.1% 41.4% 43.6% 41.6% 41.7%
6.10 Surplus sharing – benefit leakage
6.10.1 In this section we quantify the effect of surplus sharing with employees, i.e. the cost of benefit leakage. This is an area where actuaries agree that providing extra benefits represents a cost to the employer, but to date there has been little objective quantification of this particular cost.
[image:45.420.45.376.200.382.2]6.10.2 Figure 6.11 shows the change in the stakes from removing the rights of pensioners to share in surplus when a market consistent PUM valuation basis is used. For this approach, the percentage of scenarios resulting in the company entering liquidation reduces slightly to 3.8% from the base case of 4.0%.
Figure 6.11. Impact of removing discretionary increases for pensioners for a scheme investing in equities.
6.10.3 Unsurprisingly, removing discretionary benefits transfers wealth from employees to shareholders. However, the advantage of the approach adopted is that it allows this transfer to be quantified. The transfer of value from employees to shareholders is £32 million.
bonds. In this case, the percentage of scenarios resulting in the company entering liquidation falls from 2.1% to 1.7% (as in section 6.7.9).
Figure 6.12. Impact of removing discretionary increases for pensioners for scheme investing in bonds.
6.10.5 With a bond investment strategy, Figure 6.12 shows us that the discretionary increases have more than halved in value from the viewpoint of employees. This is reflected in the change in the stake for shareholders.
6.10.6 In terms of further developments and practical applications, the model’s ‘rule’ for surplus sharing can be tailored for particular cases. 6.11 Dividend policy
6.11.1 In this section, we briefly investigate the impact of dividend policy. The base case assumes a dividend policy of distributing 50% of reserves subject to the constraint that dividends can only be changed by a maximum of 10% in any one year.
Figure 6.13. Impact of paying zero dividend.
6.11.3 Clearly, retaining more funds reduces the likelihood of the company going into liquidation. Employees and debtors both benefit from this. Consultants also gain because investment fees earned outweigh the loss of income from liquidating the company. The Government also receives higher taxes as the company remains as an ongoing, tax-paying entity in more scenarios.
6.11.4 The losers are shareholders, who do not receive dividends, and externals, who provide their services to the company in more scenarios due to the lower number of liquidations.
6.11.5 This illustrates how areas traditionally outside the actuary’s consideration have a significant impact on the stakes of the different parties with financial interests in the pension scheme.
6.11.6 Another example is the level at which a company is forced to enter liquidation. Testing shows that the trigger level for liquidation also has a significant impact of the stakes.
6.12 Impact of scheme maturity
control can be exercised. They are, however, important characteristics of a scheme that will have an influence on the value of the different stakes.
6.12.2 In this section we look at a more mature scheme. We alter the membership profile of our base case by halving the number of non-pensioner members at all ages and increasing the numbers of non-pensioners to maintain the value of the ongoing liabilities and the pensioner profile. This results in the pensioner liabilities increasing from 45% to 72% of the total liabilities.
6.12.3 As the structure of the firm is now changed (including workforce and hence the profitability per employee) we cannot directly compare this to our base case. Instead we consider changes in strategy for the mature scheme and compare this with the effects noted for the original base case analysed to date.
[image:48.420.44.375.331.507.2]6.12.4 Figure 6.14 below shows the impact on the wealth stakes of the different shareholders from changing the investment strategy from 100% equities to 100% bonds for a mature scheme. For our mature scheme with an equity strategy the base level of liquidations is 6.8%. The new base level is higher than the original base of 4.0% because the scheme has a higher proportion of pensioners who share in the surplus. A bond strategy reduces this percentage to 5.2%.