www.biogeosciences.net/13/1733/2016/ doi:10.5194/bg-13-1733-2016
© Author(s) 2016. CC Attribution 3.0 License.
Comparing models of microbial–substrate interactions and their
response to warming
Debjani Sihi1,a, Stefan Gerber1, Patrick W. Inglett1, and Kanika Sharma Inglett1 1University of Florida, Soil and Water Science Department, Gainesville, Florida, USA
anow at: Appalachian Laboratory, University of Maryland Center for Environmental Science, Frostburg, Maryland, USA Correspondence to: Debjani Sihi ([email protected])
Received: 9 June 2015 – Published in Biogeosciences Discuss.: 10 July 2015 Revised: 22 February 2016 – Accepted: 2 March 2016 – Published: 21 March 2016
Abstract. Recent developments in modelling soil organic carbon decomposition include the explicit incorporation of enzyme and microbial dynamics. A characteristic of these models is a positive feedback between substrate and con-sumers, which is absent in traditional first-order decay mod-els. With sufficiently large substrate, this feedback allows an unconstrained growth of microbial biomass. We explore mechanisms that curb unrestricted microbial growth by in-cluding finite potential sites where enzymes can bind and by allowing microbial scavenging for enzymes. We further developed a model where enzyme synthesis is not scaled to microbial biomass but associated with a respiratory cost and microbial population adjusts enzyme production in order to optimise their growth. We then tested short- and long-term responses of these models to a step increase in temperature and find that these models differ in the long-term when short-term responses are harmonised. We show that several mech-anisms, including substrate limitation, variable production of microbial enzymes, and microbes feeding on extracellular enzymes eliminate oscillations arising from a positive feed-back between microbial biomass and depolymerisation. The model where enzyme production is optimised to yield maxi-mum microbial growth shows the strongest reduction in soil organic carbon in response to warming, and the trajectory of soil carbon largely follows that of a first-order decomposition model. Modifications to separate growth and maintenance respiration generally yield short-term differences, but results converge over time because microbial biomass approaches a quasi-equilibrium with the new conditions of carbon supply and temperature.
1 Introduction
Traditional soil organic matter decomposition models are based on first-order kinetics, where decomposition scales to the pool size. The scaling factor represents recalcitrance of a specific pool and is modified by soil temperature, mois-ture, and other soil properties (e.g. van Veen et al., 1984; Parton et al., 1987; Molina et al., 1990; Li, 1996; Chertov and Komarov, 1997). Recent modelling efforts have specifi-cally included catalysis of polymeric soil organic carbon to dissolved organic carbon (DOC) by extracellular enzymes. This depolymerisation step is thought to be a rate-limiting step in organic matter decomposition processes (Schimel and Weintraub, 2003; Fontaine and Barot, 2005).
organic matter to warming (Allison et al., 2010; Wieder et al., 2013).
Moreover, the response of soil organic matter to warming is very sensitive to microbial carbon use efficiency (CUE) because this parameter and its climate sensitivity define the fraction of carbon remaining in the soil as processed organic matter vs. carbon removed via respiratory CO2 (Allison et al., 2010; Frey et al., 2013; Kivlin et al., 2013; Tucker et al., 2013; Sinsabaugh et al., 2013; Wang et al., 2013; Li et al., 2014). Temperature dependence of CUE is typically not considered in traditional decomposition models (but see Frey et al., 2013), rather the ratios between respired CO2and the transfer to different quality pools are mostly constant param-eters or vary based on soil texture, soil recalcitrance, and organic or inorganic nutrient content (Parton et al., 1987; Gerber et al., 2010). Microbial respiration can be partitioned into a series of carbon expenditures that do not contribute to growth. These expenditures include growth respiration, maintenance respiration, respiratory cost for enzyme produc-tion, and overflow respiration (Manzoni et al., 2012; Moor-head et al., 2012). Each type of respiratory carbon expendi-ture may differ in its response to temperaexpendi-ture.
Respiration may be parameterised based on different mi-crobial properties. For example, maintenance respiration is assumed to scale with microbial biomass (Chapman and Gray, 1986; Fontaine and Barot, 2005) while growth res-piration may scale to the amount of new tissues built. On the other hand, overflow respiration occurs during stoichio-metric adjustment (Russell and Cook, 1995; Schimel and Weintraub, 2003; Frost et al., 2005; Franklin et al., 2003), whereas costs related to enzyme production may be governed by microbial demand and substrate availability and quality, resource diffusion, and microbial diversity (Allison, 2005). This differentiation can impact the dynamics of the microbial biomass: for example, maintenance respiration costs would be incurred even in the absence of carbon uptake, which can lead to a reduction in microbial biomass. In contrast, growth respiration is only due when substrate for growth is available. Because of the explicit and mechanistic link between micro-bial activity and soil organic matter degradation, inclusion of microbial models in Earth system models may have the potential to ultimately reduce uncertainty in climate–carbon feedback in the face of climate change because of the ex-plicit link between microbial activity and soil organic matter degradation (Todd-Brown et al., 2012, 2013; Wieder et al., 2015a).
As microbial models are considered for broader applica-tion in Earth system models, it is essential to analyse and un-derstand their structure and their dynamics. Here, we com-pare a series of microbial decomposition models with each other. Specifically, we analyse feedbacks between depoly-merisation and microbial growth, consider constraints on de-polymerisation and enzyme–substrate interactions, investi-gate the parameterisation of microbial enzyme productivity,
and address the representation of microbial respiration and CUE.
Our main questions are as follows:
a. How do different model implementations of depoly-merisation affect the feedback between microbial biomass and soil organic matter if subjected to warm-ing?
b. How does the consideration of functional respiration terms (growth, maintenance, and carbon acquisition ex-penditures) affect decomposition dynamics?
We organise the paper in the following way. In the next sec-tion, we introduce three simple models that differ in their rep-resentation of depolymerisation. Each model will be further modified for a different representation of microbial dynamics and respiration. To analyse model behaviour, we will evalu-ate the response of respiration, microbial biomass, CUE, and soil organic matter to a step increase in temperature. We will then discuss the models’ behaviour and compare their results with the dynamics of a traditional first-order model.
2 Materials and methods 2.1 Model descriptions
We first introduce three model families that differ in the way depolymerisation is handled.
In all models, the set-up consists of a single soil or-ganic matter pool and a single microbial pool (Fig. 1). All models also implicitly take into account interaction between enzymes and substrate that results in depolymerisation of substrate into a DOC pool on which microbes can feed. Enzyme–substrate reactions are based on Michaelis–Menten kinetics (see Appendix A, Michaelis–Menten kinetics with enzyme denaturation). We do not consider a specific enzyme pool, nor a specific DOC pool, but assume that the enzyme and DOC pools are in a quasi-steady state (see Appendix A, DOC and enzyme dynamics). Thus, the amount of enzyme produced equals the amount of enzyme decay at every time step. Similarly, the amount of DOC produced is the same as the amount of DOC consumed by microbes. In contrast to Al-lison et al. (2010) but congruent with German et al. (2012), there is no “free” DOC; both fresh litter and microbial necro-mass need to be depolymerised before they can be ingested by microbes. In all models depolymerisation and microbial respiration are temperature dependent, causing increased de-polymerisation and reduced microbial CUE with warming. 2.1.1 Base models
by dS
dt =I+λd·M−D, (1)
dM
dt =D·ε−λd·M, (2)
whereSandMare the soil organic matter and the microbial pool, respectively,Iis the input of fresh litter,λdis the death rate of microbes,Dis the rate of depolymerisation, andεis the microbial CUE.
Forward M–M model (FWD)
In the forward model (FWD), depolymerisation is repre-sented as a Michaelis–Menten process and stems from the simple microbial–enzyme decomposition model as proposed by Allison et al. (2010) and modified by German et al. (2012) (Fig. 1a).
D=Vmax,FWD·S·M
Km+S
, (3)
where D is the rate of depolymerisation, Vmax,FWD is the maximum depolymerisation rate, and Km is the half-saturation constant of enzymes. Appendix A shows the derivation of this function based on enzyme–substrate dy-namics.
Diminishing return (REV) model
In Appendix B, we derive two depolymerisation models which show a diminishing increase in depolymerisation as microbial mass increases. These models include (a) a case where microbes are scavenging for free enzymes and (b) where potential sites for enzyme–substrate reactions are fi-nite. The implementation of these factors leads to a reverse Michaelis–Menten type model (REV) as in Schimel and Weintraub (2003):
D=Vmax,REV·S·M
Ke+M
, (4)
[image:3.612.305.544.64.432.2]whereVmax,REVis the maximum depolymerisation rate for this model and Ke is a half-saturation constant that deter-mines the diminishing return function. In the cases devel-oped in the Appendix,Keincorporates factors indicating the finite sites for enzyme substrate interactions (Appendix B, model with limited available substrate) or the efficiency with which microbes scavenge for free extracellular enzymes (Ap-pendix B, microbial consumption of enzymes). A version of the reverse Michaelis–Menten model has also been derived for the case where an enzyme can adsorb to only a fraction of soil organic matter due to inaccessible binding sites due to surface limitation or physical protection (Wang and Post,
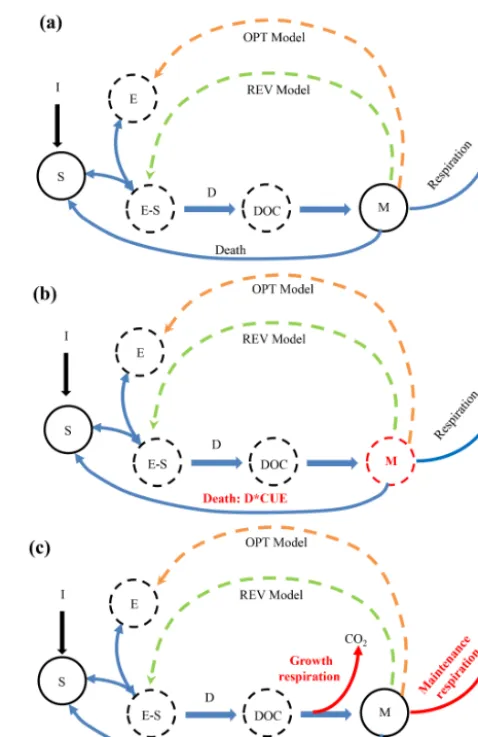
Figure 1. Conceptual diagrams of our microbial–enzyme models.
The difference across the models is in the formulation of depoly-merisation of soil organic matter (S), where the FWD model is based on German et al. (2012), the REV model considers dimin-ishing return, and the OPT model includes optimised enzyme pro-duction to maximise microbial growth.E,S,E−S,D, DOC, and Mrepresent enzyme, substrate, enzyme–substrate complex, depoly-merisation, dissolved organic carbon, and microbial biomass car-bon, respectively.Idenotes input from fresh litter andDrepresents depolymerisation. Solid lines represent material (carbon) flow and dashed lines represent information flow affecting enzyme conctration (in microbial enzyme predation in the REV model and en-zyme production rate in OPT models).E,E−S, and DOC pools were implicitly represented in the model but not explicitly simu-lated based on the assumption of quasi-steady state. We analyse the different models in three ways: (a) comparison among different pa-rameterisations of depolymerisation (FWD, REV, and OPT mod-els); (b) a second suite of simulations operate under the assump-tion that microbes are instantaneously in steady state with substrate delivery (similar to the treatment of enzymes and DOC, for REV and OPT models only, indicated by dashed outline of the pools);
(c) a third series of simulations considered partitioning between a
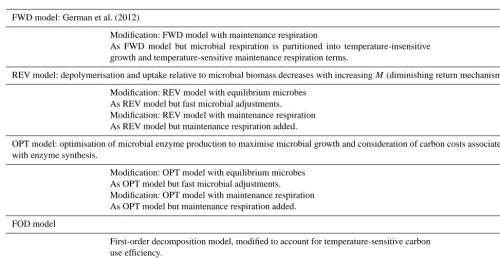
Table 1. Key features of the microbial decomposition models and subsequent modifications presented in this study.
FWD model: German et al. (2012)
Modification: FWD model with maintenance respiration
As FWD model but microbial respiration is partitioned into temperature-insensitive growth and temperature-sensitive maintenance respiration terms.
REV model: depolymerisation and uptake relative to microbial biomass decreases with increasingM(diminishing return mechanism)
Modification: REV model with equilibrium microbes As REV model but fast microbial adjustments. Modification: REV model with maintenance respiration As REV model but maintenance respiration added.
OPT model: optimisation of microbial enzyme production to maximise microbial growth and consideration of carbon costs associated with enzyme synthesis.
Modification: OPT model with equilibrium microbes As OPT model but fast microbial adjustments. Modification: OPT model with maintenance respiration As OPT model but maintenance respiration added.
FOD model
First-order decomposition model, modified to account for temperature-sensitive carbon use efficiency.
2013). A major difference from the FWD model is the inclu-sion of the amount of microbial biomass in the denominator in lieu of soil organic matter. Therefore, the depolymerisation per unit biomass decreases as biomass increases, plateauing atVmax,REV·S(diminishing return).
Optimised enzyme production (OPT) model
In our OPT model, we relax the condition that microbial en-zyme production scales to microbial biomass, an assumption that is present in many microbial models and which is also assumed in the FWD and the REV model above. Instead, we probe a model where microbial enzyme production is opti-mised for growth. Optimized enzyme production in the OPT model is motivated by microbial competition (Allison, 2005), which allows microbes to succeed if microbial enzyme pro-duction allows the highest possible return. Optimisation only has meaningful results for the case of limited substrate avail-ability (i.e. a diminishing return, possibly through constraints at potential sites for enzyme–substrate reaction) and if there is a cost associated with microbial enzyme production.
Depolymerisation as a function of enzyme production can be represented by
D (P )=P·Vmax,OPT·S
Kp+P
. (5)
Vmax,OPTis the maximum rate of depolymerisation,P is the enzyme production rate, and Kpcarries information on the affinity of the enzyme for the substrate and longevity of the enzyme (see Appendix C for full derivation of depolymeri-sation in the OPT model).
Microbial growth (G) is as in previous models but ac-counts for carbon expenditure of enzyme production:
G=ε·((D(P )−P c) , (6)
wherec is the respiratory cost per unit enzyme produced (Schimel and Weintraub, 2003).
Optimising growth by settingddGP =0 yields
D=Vmax,OPT·S− p
Kp·c·Vmax,OPT·S. (7) And the cost per unit carbon depolymerised is then
P c
D =
s
Kp·c
S·Vmax,OPT
. (8)
Quasi-steady-state (QSS) microbe models
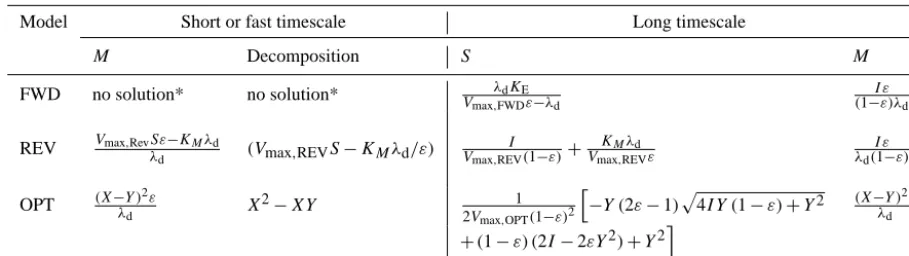
Table 2. Quasi-steady-state values for microbial biomass (M), and decomposition on the short or fast timescale (at any givenS) and “true” long-term equilibria forMandSacross the models. Note that, for simplicity, we did not substituteSin the long-term microbial equilibrium for the OPT model.
Model Short or fast timescale Long timescale
M Decomposition S M
FWD no solution* no solution* λdKE
Vmax,FWDε−λd
I ε (1−ε)λd
REV Vmax,RevSε−KMλd
λd (Vmax,REVS−KMλd/ε)
I Vmax,REV(1−ε)+
KMλd Vmax,REVε
I ε λd(1−ε)
OPT (X−λY )2ε
d X
2−XY 1
2Vmax,OPT(1−ε)2
h
−Y (2ε−1)p4I Y (1−ε)+Y2 (X−λY )2ε
d
+(1−ε) (2I−2εY2)+Y2i X=pSV
max,OPT,Y= √
KP·c requiresλd=
Vmax,FWDSε S+KE
of M compared to S allows microbial biomass to (quasi)-equilibrate with the current level of soil organic matter (see also Menge et al., 2009).
In our QSS microbe models, we solve ddMt =0, in order to obtain a quasi-steady-state microbial biomass,M¯.M¯ re-places the state variableMin the functions for depolymeri-sation and microbial death. We note that this is only possible for the REV and the OPT model as the FWD model yields no solution forMin ddMt =0. The QSS microbe models ef-fectively become a one-pool model, where depolymerisation is not a direct function of microbial biomass but an expres-sion of S and a series of parameters. Table 2 (see formula-tions for short or fast timescale) shows the quasi-steady state for M, and the resulting depolymerisation function for the QSS microbe models.M¯ can be diagnosed at each time step based onSand parameters that determine depolymerisation and microbial turnover (Table 2, second column). In the QSS microbe models, a fraction(1−ε)of depolymerisation is im-mediately recycled back into the soil organic matter pool; thus, the dynamics of the soil pool become
dS
dt =I−(1−ε)·D. (9)
In turn, depolymerisation is immediately partitioned into res-piration and a returning carbon flux, which mimics microbial death.
2.1.2 Partitioning between maintenance and growth respiration
While the dynamics of the soil organic matter pool remain the same as in the base model set-up, we alter all models (FWD, REV, OPT) to treat growth and maintenance respira-tion as separate processes (Fig. 1c). Partirespira-tioning of microbial respiration into growth and maintenance respiration
charac-terises the microbial pool as follows: dM
dt =(D−λr·M) (1−g)−λd·M, (10)
wheregis the growth respiration fraction andλris the main-tenance respiration rate. The separation of microbial respira-tion into growth and maintenance terms is motivated by simi-lar formulations in other microbial (Beefting et al., 1990; Van Bodegom, 2007), vegetation growth (Foley et al., 1996; Can-nell and Thornley, 2000; Arora, 2002; Thornley, 2011; Pret-zsch et al., 2014), and ecosystem-scale (Sistla et al., 2014) models. Growth respiration is applied after requirements for maintenance respirations are met and is proportional to newly built microbial tissues. Maintenance respiration (res-piration related to non-growth components) is typically pro-portional to microbial biomass (Van Bodegom, 2007). 2.1.3 First-order decomposition (FOD) model
The last model represents the structure of traditional decom-position models such as CENTURY (Parton et al., 1987) or Roth-C (Coleman and Jenkinson, 1996) and their derivatives, where decomposition is considered as a first-order reaction: dS
dt =I−S·k·(1−ε), (11)
wherek is the first-order decomposition constant. The two major differences between our first-order decomposition (FOD) model and traditional models are that we consider only a single carbon pool, whereas traditional models con-sider multiple pools with different turnover times that feed into each other. We also consider a temperature-dependent CUE on top of a temperature-dependent processing rate (k; see “Parameterisation and implementation” section). This in-creases the fraction of carbon processed with warming to be-come CO2. Respiration (R) is then
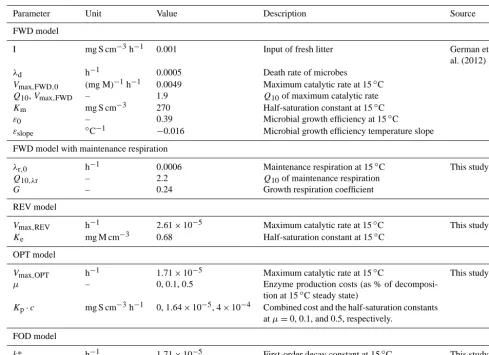
Table 3. Parameters used in microbial decomposition models. (In the model list, we provide only those parameters where modifications have
been made.)
Parameter Unit Value Description Source
FWD model
I mg S cm−3h−1 0.001 Input of fresh litter German et
al. (2012)
λd h−1 0.0005 Death rate of microbes
Vmax,FWD,0 (mg M)−1h−1 0.0049 Maximum catalytic rate at 15◦C
Q10,Vmax,FWD – 1.9 Q10of maximum catalytic rate
Km mg S cm−3 270 Half-saturation constant at 15◦C
ε0 – 0.39 Microbial growth efficiency at 15◦C
εslope ◦C−1 −0.016 Microbial growth efficiency temperature slope
FWD model with maintenance respiration
λr,0 h−1 0.0006 Maintenance respiration at 15◦C This study
Q10,λr – 2.2 Q10of maintenance respiration
G – 0.24 Growth respiration coefficient
REV model
Vmax,REV h−1 2.61×10⁻⁵ Maximum catalytic rate at 15◦C This study
Ke mg M cm−3 0.68 Half-saturation constant at 15◦C
OPT model
Vmax,OPT h−1 1.71×10⁻⁵ Maximum catalytic rate at 15◦C This study
µ – 0, 0.1, 0.5 Enzyme production costs (as % of
decomposi-tion at 15◦C steady state)
Kp·c mg S cm−3h−1 0, 1.64×10⁻⁵, 4×10⁻⁴ Combined cost and the half-saturation constants
atµ=0, 0.1, and 0.5, respectively. FOD model
k* h−1 1.71×10⁻⁵ First-order decay constant at 15◦C This study
*kin FOD model is identical toVmax,OPTin OPT model.
2.2 Temperature response
We implement the response of decomposition to warming by modifying the depolymerisation and the microbial respira-tion.
In the FWD, REV and OPT model,Vmaxis modified as
Vmax,i(1T )=Vmax,i·Q (1T10)
10 , (13)
where Vmax,i and Vmax,i(1T ) are the reference and
temperature-dependent maximum depolymerisation rate of the model i =(FWD, REV, OPT, see Table 3). Similarly, the decomposition ratekis modified by theQ10function in the FOD model.
Further, we also parameterise CUE as a linear function of the temperature change, following Allison et al. (2010) and German et al. (2012):
ε(1T )=ε0+1T·εslope, (14)
whereε0is the CUE at reference temperature andεslopeis the change in CUE per ◦C temperature (1T ) change. Finally,
in the models where we partition growth and maintenance respiration, we formulate maintenance respiration as aQ10 function of temperature:
λr(1T )=λr,0·Q
(1T10)
10 , (15)
In our simplified model we further neglect the weaker temperature dependence of the half-saturation constants (see Davidson et al., 2012; German et al., 2012; Stone et al., 2012) and also do not consider changes in the cost of en-zyme production as temperature increases in the case of the OPT model.
2.3 Parameterisation and implementation
All models are implemented in STELLA, version 10.0.3. To enable comparison among the models, we adjust parameters in the following way: the models have the same initial soil organic carbon and the same initial microbial biomass. Both CUE (ε)and its temperature dependence(εslope)are the same across models. Further, the temperature sensitivities ofVmax are identical across models so that we obtain the same in-crease in depolymerisation in the first time step after the tem-perature perturbation. This kind of parameterisation is moti-vated by the fact that many of these parameters are largely unknown, but it will provide us with the possibility of com-paring the functional response to long-term warming across these models.
We use parameters as reported in German et al. (2012), with a few modifications. Here, we reportVmax,FWDandKm by considering 15◦C as our reference temperature and by in-corporating German et al. (2012) tuning coefficients (aK,aV)
directly into these two parameters (Table 3). In other words,
Vmax,FWDandKmare the product of the reference values in German et al. (2012), their adjustment to our reference tem-perature, 15◦C, and the tuning parameters of German et al. (2012). Further, we have converted the exponential tempera-ture sensitivity ofVmax,FWDinto aQ10term.
To allow a diminishing return mechanism, we assumed that most of the enzyme decay or loss in a scavenging model is attributed to microbial consumption instead of denatu-ration. Alternatively, under conditions of limited enzyme– substrate reaction sites, we assumed that there is an excess of free enzymes, and therefore, enzyme concentrations are higher than their corresponding half-saturation concentra-tions. Overall, these assumptions would suggest a Ke that is smaller than M (Ke<M). Here, we chose Ke consid-erably but not diminishingly smaller than M equilibrated at reference temperature (Ke=0.37 times equilibratedM). Note that the half-saturation constant in the REV model has a different unit (mg M cm−3)than in the FWD model (mg S cm−3)(see Appendix A for the FWD model and Ap-pendix B for the REV model). This leaves the determination of Vmax,REV, which is tuned here such that the REV model yields equivalent equilibrium values of S at the reference temperature to the FWD model.
In the OPT model, we adjustVmax,OPT (in the same man-ner as in the REV model) such that the system again yields equilibrium values forSat the reference temperature (15◦C) and the same initial response to warming as in the other mod-els. In the OPT model, we have to work with two additional
parameters, namely the cost of enzyme production (c) and the term that contains the affinity of enzymes for the sub-strate (Kp). We chose to have the OPT models comparable to others if the cost (c) is zero. Higher costs (c>0), therefore, will yield different equilibrium results ofS and a different response to warming, depending on the cost of enzyme pro-duction.
Both the half-saturation constant (affinity parameter,Kp) and the cost per enzyme produced are parameters that are hard to come by. Instead, the relationship between enzyme production cost and overall depolymerisation allows us to quantify the product of Kp and c (see Eq. 8 in the main text). We define a fractional expenseµ that quantifies the enzyme expenditures relative to overall depolymerisation at the reference temperature steady state, and at zero cost (µ=
P c D
Eq.,1T=0). We choseµto be 0, 10, and 50 % of the de-polymerisation rate at the reference temperature and at steady state. Based on the relationship given in Eq. (8) we then ob-tain an expression for the combined cost (c) and the half-saturation constant (Kp)without having to specify the value of the individual parameters (see also the variableY in Ta-ble 2):
Kp·c=µ2·DEq.,1T=0, (16)
whereDEq.,1T=0is the rate of depolymerisation at zero en-zyme cost and reference temperature.
When separating growth and maintenance respiration, we sought to equalise steady-state CUE, M, and S by tuning
g and λr. We first parameterised maintenance respiration, where, the coefficient for maintenance respiration is scaled to microbial turnover (Van Bodegom, 2007). The partition-ing between growth and maintenance respiration is motivated by vegetation models. Lund–Potsdam–Jena (LPJ; Sitch et al., 2003) and the Ecosystem Demography Model (ED; Moor-croft et al., 2001) have a growth respiration factor of one-third of the carbon allocated to growth. We then constrain the overall respiration by the CUE in German et al. (2012) and obtain a maintenance respiration rate by difference. This yields a maintenance respiration rate that is close to the mi-crobial death rate such that
λr,0= 1.25·λd. (17)
The second parameter,g is adjusted such that the CUE at the steady state and reference temperature remains the same. This constrainsgto
g= λd−ε0·(λd+λr,0)
λd−ε0·λr,0
. (18)
To obtain the same equilibrium values of CUE at 20◦C as in the base models, we adjustQ10,λr such that models with
maintenance respiration have the same CUE as the base mod-els.
Sand CUE as in all other models at 15◦C, and we employ a
Q10,kvalue identical to theQ10values ofVmaxin the other models. We keep the decreasing CUE – a feature not typi-cally set up in traditional models.
All parameter values are given in Table 3.
3 Results
3.1 Base model simulations
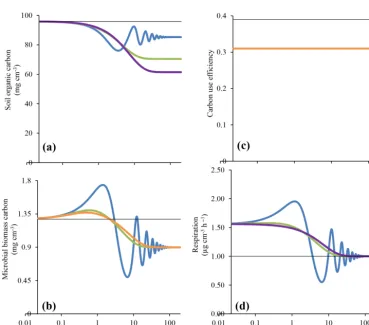
Figure 2 shows the transient response of the different models (FWD, REV, OPT, and FOD) to a temperature step from 15 to 20◦C. Recall that the perturbation occurs after all models were equilibrated at 15◦C and are forced through the same initial values ofM,S, and CUE by way of parameter adjust-ments. Also, by identical Q10 of Vmaxand CUE, the initial response to warming is equal across the models.
In all models, warming leads to a decline in soil organic matter and microbial biomass (Fig. 2). In this initial com-parison, we assume that there is no cost associated with mi-crobial enzyme production. Across all the models, mimi-crobial biomass first increases because of higher depolymerisation. Increased depolymerisation causes soil organic matter to de-crease. In the longer term,M decreases as rates of depoly-merisation decline due to a reduction inS and due to lower CUE. We note thatMbecomes identical across all models in the long term when soil organic carbon has equilibrated with microbial processing at higher temperature (see also Table 2). The FWD model shows the oscillations in M andS, as noted earlier (Wang et al., 2014). The warming triggers an increase in depolymerisation, which in turn feeds micro-bial biomass, causing an even higher rate of depolymerisa-tion. This positive feedback experiences a break only when the substrate (S) is sufficiently depleted, such that microbial biomass begins to decline. Thereafter, the positive feedback takes over again, the decreasing microbial biomass spirals down along with depolymerisation until microbial biomass is low enough for soil organic matter to recover. The amplitude of the oscillations dampens over time (Fig. 2). Rates of respi-ration oscillate along with microbial biomass, before settling at the initial rate in the long term (after ca. 200 years).
The transient dynamics in the REV model with a diminish-ing return as enzyme (or microbial) concentration increases are smoother compared to the FWD model (Fig. 2). The mechanism of allowing a finite site for enzyme–substrate re-action or microbial scavenging for enzymes curbs the growth of microbial biomass. Warming still leads to an initial in-crease in microbial biomass, owing to the fact that the gains of depolymerisation outweigh losses from increased respira-tion (i.e. decreased CUE). As soil organic matter depletes, microbial biomass is reduced, ultimately below the initial levels.
The OPT model considers the metabolic cost of enzyme production and allows optimisation of microbial growth. In
Fig. 2, the temporal evolution ofM,S, respiration, and CUE is shown for a set-up without any costs associated with en-zyme production. Among the three microbial models pre-sented here (FWD, REV, OPT), the OPT model shows the strongest soil organic matter decrease in response to warm-ing. The response in the OPT model is also almost identical with the traditional FOD model. The transient response also shows a smaller initial growth ofMin the OPT vs. the REV model.
3.2 Analytical steady-state solutions
The analysis of equilibria helps to understand the model be-haviour. We first address the “long timescale” in Table 2 where we solve for the steady state of the entire system (i.e. dM
dt =0 and
dS
dt =0). In the long term, the steady-state
mi-crobial biomass is identical in the FWD and the REV model and depends on the input of fresh organic matter, the micro-bial CUE, and micromicro-bial turnover (Table 2, rightmost col-umn). The same microbial biomass is also realised in the OPT model under zero cost (µ=0) (see Eq. 16 and Table 2, rightmost column). In contrast, the analytical steady-state so-lutions ofSare different among the models: for the REV and the OPT model, the input of fresh litter is a determining vari-able for the steady state but not for the FWD model. In the OPT model the resulting equilibria ofSandMend up being complex expressions, and we did not calculate the long-term equilibria ofMbut expressed them simply as a function of soil organic matter. Further, the steady states of S are the same in the traditional first-order model (FOD) and the OPT model with zero cost. As expected, the effect of enzyme pro-duction cost has a negative impact on microbial biomass.
The analysis of the short-term quasi-steady state of the mi-crobial biomass ddMt =0 is useful to understand the tra-jectory of the coupled S–M system. Typically, microbial turnover is much faster than the turnover of bulk soil organic matter (Stark and Hart, 1997; Schmidt et al., 2007). Thus, we would expect that microbial biomass is approaching a quasi-steady state given any level ofS.
In the FWD model, we find that the quasi-steady state for M requires a perfect balance of parameters that gov-ern growth and death rates (Table 2, second column). This has been referred to as knife-edge equilibrium (Schimel and Weintraub, 2003). The absence of such a balance leads to either an exponential growth (if positive balance) or decay (if balance is negative) of the microbial biomass in the short term, where changes inSare small. It becomes clear that the soil organic matter pool must respond on a similar timescale to microbes in order to maintain microbial biomass within realistic boundaries. In the REV and the OPT models, the short-term equilibria are a function of soil organic matter (Ta-ble 2, second column). In the REV and the OPT model,M¯
Figure 2. Responses of (a) soil organic carbon, (b) microbial biomass carbon, (c) CUE, and (d) respiration to a 5◦C warming in the base models (FWD vs. REV and OPT, Fig. 1a). The black line represents initial values, which are model equilibria at 15◦C. We chose logarithmic axes for time to better highlight the differences in short-term responses. We note that the differences in simulated soil organic carbon and respiration for the OPT and the FOD are almost equal and therefore not discernible. Also, values of CUE at warmed temperature are identical in all models, and therefore, the orange line is superimposed on blue and green lines. In the OPT model, simulations are carried out at zero enzyme production cost, i.e.µ2=Kp·c=0).
affinity for the substrate (larger half-saturation constant) and higher enzyme production cost act to reduceM¯ in these mod-els.
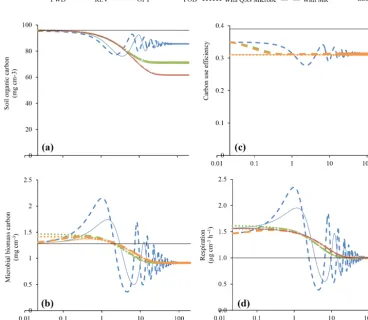
3.3 Quasi-steady state (QSS) of microbial biomass Given the quasi-equilibrium biomass and the resulting de-composition at quasi-steady state, we set up a second line of modelling experiments, where depolymerisation rates, as well as microbial respiration and death, are calculated based on microbial biomass at quasi-steady state (QSS microbe; Table 2, second and third columns; see also Sect. 2.1.2 in the “Materials and methods” section). Compared to the base models, the QSS microbe models yield very similar results for S and respiration, but they do not reproduce the early adjustment of the microbial biomass to the temperature step (Fig. 3). Instead of a slow adjustment to the sudden
Figure 3. Responses of (a) soil organic carbon, (b) microbial biomass carbon, (c) CUE, and (d) respiration to a 5◦C warming for all models if microbial biomass is assumed to be at quasi-steady state (QSS, dotted lines) and if separation of maintenance and growth respiration are considered (dashed lines). Coloured thin lines represent base models. The black thin line represents initial values, equilibrated at 15◦C. Dashed lines (growth and maintenance) and dotted lines (quasi-steady state) represent modifications for REV and OPT models, respectively. In the OPT model, simulations are carried out at zero enzyme production cost (i.e.µ2=kp·c=0).
3.4 Partitioning between maintenance and growth respiration
In the third modification of our base models, we partition respiration in our models into a temperature-independent growth respiration and a temperature- (and biomass)-dependent maintenance respiration. This affects the transient pattern of the FWD in that it increases the feedback between microbes and substrate (evidenced by higher amplitudes in
M,S, and respiration; Fig. 3). This is because part of respira-tion is now tied to microbial biomass, which lags behind de-polymerisation. CUE initially decreases less than in the base model, as maintenance respiration lags behind the growing microbial biomass. The maintenance term also introduces a mild oscillation into CUE, as microbial biomass waxes and wanes. Interestingly, the inclusion of maintenance respira-tion increases oscillarespira-tion frequency and amplitude ofSand
M. In the REV and the OPT model, microbial biomass is slightly higher and respiration is slightly below the values of the base models shortly after the step increase; however,
this difference diminishes over time (Fig. 3). The nuanced consideration of microbial respiration causes CUE to decline in two stages. The initial drop occurs via the immediate in-crease in maintenance respiration. This drop is followed by further changes in CUE asMoscillates (FWD model) or as
Mnet growth is diminishing (REV and OPT). Similar to mi-crobial biomass, differences disappear within < 1 year after the step warming. We note that in our modelling set-up, we adjusted the temperature sensitivity of the maintenance res-piration such that CUE is the same at the reference (15◦C) and the elevated (20◦C) temperature.
3.5 Enzyme production expenditures
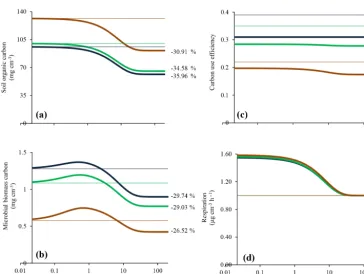
Figure 4. Long-term responses of optimised enzyme production (OPT) model to a 5◦C warming in (a) soil organic carbon, (b) microbial biomass carbon, (c) CUE, and (d) respiration operating at different relative enzyme production costs (µ, see Eq. 16). Thick lines represent warming response and thin lines represent corresponding equilibrium at the reference temperature.
16). We tested three levels of enzyme production cost: 0, 10, and 50 % of equilibrium depolymerisation at our reference condition (i.e. 15◦C). As expected, increasing enzyme pro-duction cost reduced the rate of depolymerisation, andS is therefore maintained at a higher level. The increasing costs also resulted in a smaller relative decline inSin response to warming, whereas the absolute loss is larger, as indicated by the consistently higher rates of respiration. Similarly, the re-sponse of CUE to warming is smaller and the decline inMis less pronounced if enzyme production costs are considered.
4 Discussion
Recently developed microbial decomposition models (Schimel and Weintraub, 2003; Allison et al., 2010; German et al., 2012) highlight the importance of microbial processes and microbial physiology during decomposition. Their application specifically highlights the role of extracellular enzymes during decomposition and how these constraints will further affect the release of soil organic matter as a consequence of warming. While microbial decomposition models are able to improve prediction of organic carbon stock globally and can successfully recreate litter decom-position dynamics, the long-term trajectory of a warming
response needs further evaluation (Wang et al., 2014; Hararuk et al., 2015). In particular, a positive feedback between depolymerisation and microbes can only be curbed via the longer-term adjustment of soil organic matter and therefore lead to oscillation in both microbial biomass and soil organic matter (Wang et al., 2014). The oscillation is the consequence of a positive feedback between depoly-merisation and microbial growth caused by a knife’s edge or unstable equilibrium in the short term (unstable QSS for microbes; Schimel and Weintraub, 2003). A break in this feedback and stabilisation only occurs via the slow changing soil organic matter pool. We note that some attenuation of the oscillation may occur via direct input into a DOC pool that does not require depolymerisation (Allison et al., 2010), a feature not considered here.
ac-tive extracellular enzymes and (2) limited sites for substrate– enzyme reactions (see Appendix B). We derived the forms of depolymerisation from the original Michaelis–Menten kinet-ics and the resulting formulations presented in the “Materi-als and methods” section are simplified and more illustrative versions of more complex functions. The simplified formu-lation of depolymerisation and microbial consumption we obtained has been dubbed a reverse Michaelis–Menten for-mulation (Schimel and Weintraub, 2003) because microbial biomass (or enzyme concentration) instead of the substrate concentration now occurs in the denominator of the depoly-merisation term, invoking the diminishing return. Wang and Post (2013) arrived at a reverse Michaelis–Menten depoly-merisation function if enzymes only adsorbed to a fraction of binding sites because of complex substrates. Transitions between FWD and REV model behaviour have also been de-tailed in the more complex Equilibrium Chemistry Approx-imation model that also included sorption of enzymes and substrates to mineral surfaces (Tang and Riley, 2015; Tang, 2015). Our analysis shows that the positive feedback between decomposition and microbial growth is removed, as our REV model now has a stable short-term QSS.
Limited sites may play a role if the substrate has a high volume-to-surface ratio, or if the substrate is associated with minerals (Davidson and Janssens, 2006; Gillabel et al., 2010; Conant et al., 2011; Davidson et al., 2012, 2014; Cotrufo et al., 2013; Wagai et al., 2013; Benbi et al., 2014; Wieder et al., 2014a; Tang and Riley, 2015). Our implementation of lim-ited substrate causes a surplus of free enzymes that compete for binding to substrates, similar to the Langmuir adsorption isotherm theory (Vetter et al., 1998; Schimel and Weintraub, 2003; Wang and Post, 2013; and see Appendix B, “Model with limited available substrate”), leading to diminishing de-polymerisation returns and a REV model formulation. Ef-fects of microbial scavenging for enzymes cause a dimin-ishing return because more microbial biomass will lead to an increased probability of enzymes being consumed before they interact with soil organic matter. Other mechanisms of diminishing return as enzymes increase may be the stabil-isation of enzymes into an organic-matter–humate complex (Allison, 2006) or sorption to minerals, soil organic matter, or microbes (Tang and Riley, 2015). Diminishing returns also occur with rate–yield trade-offs (Allison, 2014).
Many microbial decomposition models work under the assumption that enzyme production is proportional to crobial biomass; however, it is also conceivable that mi-crobes are adjusting production to maximise return or growth (Cooney, 2009; Merchant and Helmann, 2012; Tang and Ri-ley, 2015). In our OPT model, we relax the proportionality of microbial enzyme production and microbial biomass and instead allow a best possible return given the cost of enzyme synthesis. While the exact cost of enzyme production is not known, we fixed parameters (the product ofKpandc) that re-late to the fractional expense of carbon depolymerised upon initialisation (i.e. at steady state and reference temperature;
Eqs. 8 and 16). Importantly, enzyme production optimisation is not possible for some of the models presented here. Higher enzyme production would always lead to further microbial growth in the FWD model, and the highest yield would oc-cur with infinite enzyme production. Similarly, in the case of microbial scavenging for enzymes, additional investments into enzymes always increase depolymerisation.
The response to temperature in our OPT model closely re-sembles the traditional first-order decay model (FOD). In the limit of enzyme production cost approaching zero, depoly-merisation occurs at the maximum rate (Vmax·S), essentially turning the OPT model into a first-order model (Fig. 2). In the OPT model, reductions in depolymerisation viaKp are alleviated when enzyme synthesis is inexpensive, where the reduction in the maximum depolymerisation rate becomes a function of the product ofKp·c(Eq. 7 and Table 2). The results of the OPT model also show the effects on assump-tions regarding microbial enzyme production rates. In many microbial models, enzyme production is scaled to micro-bial biomass. Lifting the tight coupling between micromicro-bial biomass and enzyme production leads to a more dynamic enzyme concentration and ultimately affects the temperature sensitivity of decomposition. Thus, the cost and trade-offs associated with microbial enzyme production are potential important areas to better quantify the long-term response of soil carbon storage to climate change.
The response of decomposition to warming can be viewed as a response occurring on multiple timescales. For exam-ple, while enzyme activity likely produces an immediate re-sponse, microbial respiration responses may also be trig-gered quickly, although longer-term acclimation may occur (Frey et al., 2013). It may take longer for microbial biomass to respond to temperature changes (weeks to months). Fi-nally, because the rate of decomposition is slow compared to the overall abundance of soil organic matter, discernible changes in this pool occur on timescales of months to years. Based on the distinct rates of adjustments, timescales can – in principle – be separated by assuming a quasi-steady state of pools that turn over fast.
micro-bial biomass, even after a sharp perturbation in the form of a step change. In the QSS assumption, depolymerisation be-comes independent of the microbial biomass (but is still de-pendent on a combination of microbial parameters; see Ta-ble 2).
The introduction of QSS microbial biomass allows ad-dressing and comparing the long-term responses of the dif-ferent models to warming. In particular, the comparison of the QSS-derived depolymerisation of the FOD with the REV and the OPT directly show the effect of how enzyme– substrate affinity and enzyme production costs dampen the rate of depolymerisation and its response to temperature. In other words, the long-term response of the FOD is equiva-lent to the long-term response of our OPT or REV model, when (1)Keis low (high enzyme production, high enzyme– substrate affinity, and low enzyme turnover) and/or (2) costs of enzyme production are low, and (3) and CUE (the frac-tion of the organic matter pool that is depolymerised but not respired and instead cycled back into soil) is also tempera-ture dependent in the FOD, a featempera-ture typically not included in traditional decomposition models.
CUE ultimately is the result of different microbial respi-ration terms. Here, we consider three processes that may af-fect microbial respiration under a warming scenario. We first consider a partitioning into growth and maintenance respi-ration across our three models. Growth respirespi-ration is simply assumed to be a proportion of carbon allocated to microbial growth. In contrast, maintenance respiration scales to micro-bial biomass in our models, where the proportionality fac-tor increases with temperature. This partitioning is motivated by formulations of plant respiration in terrestrial biosphere models. We find that this separation affects the short-term re-sponses of respiration because microbial biomass lags behind the increase in depolymerisation. The temperature response of CUE is thus delayed. The partitioning of the respiration terms also has a particular impact on the transient dynamics of the FWD model, in that the lag in maintenance respira-tion amplifies the oscillarespira-tion (Fig. 3). However, in the REV and the OPT model, effects of separation are only discernible on the microbial timescale, before microbial biomass is ap-proaching quasi-steady-state values.
In the OPT model, we introduce an additional respiration term, namely the cost of enzyme production. In this model, we allow microbes to adjust enzyme production in order to optimise growth. It is interesting that increasing costs lead to a smaller immediate response in respiration and more re-silient soil organic matter pool in the long term, when sub-ject to warming (Fig. 4). The early respiration response in the OPT model is a product both of higher rates of depolymeri-sation (increasedVmax)and of a higher rate of enzyme pro-duction. However, the enhancement relative to the rates at the reference temperature becomes smaller with higher enzyme production cost. In the long term, the decrease in soil organic matter is reduced when enzyme production costs are consid-ered. This reduction is accompanied by a smaller reduction
in CUE under higher enzyme production, even though there is a subsequent CUE reduction occurring asSdeclines. The changing yield trade-off overall acts to buffer respiration in-creases that could be expected from physiological responses alone (Vmax), although the effects are smaller and may be well within the uncertainty of the temperature response of any parameters considered here. We note that enzyme expen-diture relative to depolymerisation is a function of the prod-uct ofKpandc.
We acknowledge that we used a simplified set-up of our model suite. For example, we assumed that depolymerised carbon in soil solution (DOC) is always in steady state with the microbial biomass (see also German et al., 2012, and Moorhead et al., 2012). This simplification can be justified with fast and efficient scavenging of microbes and, thus, fast turnover of the DOC pool. Further sensitivity analysis may shed light on the dynamics across the full parameter space, while using the simplified linear terms (Appendices B and C; Tang, 2015), particularly also because many of the pa-rameters are difficult to estimate. Furthermore, we did not include nutrient requirements of microbes where considering the stoichiometric requirements can change the allocation of resources to optimise enzyme synthesis. Finally, our model does not include interaction that may occur with adsorption to mineral surfaces, which may occur with the substrate, the enzymes and microbial biomass, and which has important short- and long-term consequences for to temperature fluc-tuations and changes (Wieder et al., 2014a; Tang and Riley, 2015). Nevertheless, our suite of models shows the impor-tance of formulating the depolymerisation step in mathemat-ical models when evaluating the response of decomposition under warming.
5 Conclusions
Appendix A: Michaelis–Menten kinetics with enzyme denaturation
The dynamics of the enzyme–substrate complex are d[E]
dt =P−KS[S] [E]−λE1·[E]+Kr+K([ES], (A1)
d[ES]
dt = −(Kcat+Kr+λE2)[ES]+KS[S] [E], (A2)
where P is the microbial production of new enzymes, [S] is the concentration of the substrate, [E] is the concentra-tion of enzymes, [ES] is the substrate–enzyme complex, and
KS,Kcat, andKrare reaction constants that denote substrate– enzyme binding, actual depolymerisation rate, and the re-versibility of the enzyme–binding process.λE1andλE2are enzyme decay parameters that lead to enzyme denaturation or render enzymes inactive in the free enzyme pool or in the enzyme–substrate complex, respectively. In the FWD and REV model, P is proportional to microbial biomass. The Michaelis–Menten approximation for depolymerisation as-sumes that the system is in quasi-steady state in which the tendency d[dESt] and d[dEt] is zero. This also implies that the tendency of the total enzyme concentration d[Et]
dt (with [Et]
=[ES]+[E]) becomes zero.
Setting Eq. (A2) to zero, and substituting [Et]=[ES]+ [E], it follows that
[E]= [Et]Km
([S]+Km)
, (A3)
[ES]= [Et] [S]
([S]+Km)
. (A4)
And the rate of depolymerisation is
D=[Et]·Vmax·[S]
([S]+Km)
, (A5)
where D is the familiar Michaelis–Menten equation with
Km=Kcat+KKr+λE2
S andVmaxis equivalent toKcat. DOC and enzyme dynamics
We assumed that DOC concentrations are in equilibrium with substrate and microbial uptake. In microbial decomposition models, the only DOC sink is microbial consumption, which by way of mass conservation, leads to microbial consumption being equivalent to the rate of depolymerisation.
Previous models (Allison et al., 2010; German et al., 2012) assumed a general decay of the total enzyme pool, where
d[Et]
dt =P −λE· [Et]. (A6)
Because enzymes turn over fast, we can assume a quasi-steady state of the total enzyme pool by setting Eq. (A6) to zero. We obtain
[Et] =
P λE
, (A7)
and depolymerisation is
D=
P
λE ·Kcat·[S] [S]+Km
. (A8)
Finally, microbial decomposition models assume that en-zyme production is proportional to the microbial biomass
(M):P =b·M; hence,
D=Vmax·M·[S] [S]+Km
, (A9)
withVmax=b·λKEcat
However, it is conceivable that the enzyme–substrate com-plex and free enzymes decay at different rates (see also Eqs. A1 and A2).
d[Et]
dt =P−λE2[ES]−λE1[E] (A10)
Substituting Eqs. (A3) and (A4) for [E] and [ES] and apply-ing a quasi-steady state as before yields
[Et] =
P ([S]+KE)
λE1Km+λE2[S]
. (A11)
And the overall depolymerisation is thus
D= P·Kcat·[S]
λE1Km+λE2[S]
, (A12)
which can be converted into a Michaelis–Menten form
D=Vmax·M·[S]
[S]+KS , (A13)
whereVmax=b·λKcat
E2 andKS=Km λE1 λE2.
Appendix B: Microbial consumption of enzymes Microbes feeding on free enzymes can be represented as
F =λE,M· [E] ·M, (B1)
whereF is microbial enzyme consumption and λE,M the feeding rate. We can then represent the decay of the free en-zymes with
[E] ·λE1= [E](λE1,0+λE,M·M), (B2) where the totalλE,0is the spontaneous enzyme decay rate.
Substituting the new enzyme decay formulation into the depolymerisation (Eq. A12) yields
D= P ·Kcat· [S]
λE2·[S]+λE1,0·Km+λE,M·M·Km
. (B3)
For the REV model, we simplify Eq. (B3) and assume that enzymes associated with substrate do not undergo denatura-tion (λE2=0), which yields
D= P ·Kcat· [S]
λE1,0·Km+λE,M·M·Km
And, in the case where enzyme production scales to micro-bial biomass (P =b·M),
D=M·Vmax· [S]
Ke+M
, (B5)
which is again the familiar Michaelis–Menten function with
Vmax=λb·Kcat
E,M·KE andKe=
λE1,0 λE,M. Model with limited available substrate
Access to substrate might be finite, for example, if organic matter is associated with mineral soil or if the rate of depoly-merisation is constrained by the surface area. In this case, the relationship between the total available substrate and the free sites can be calculated as
[S] =θ·([Sf] + [ES]), (B6) whereSfis the available sites for enzyme reaction,θa scalar relating the total amount of substrate to the total potentially free sites (e.g. a surface-to-mass conversion), and [ES] rep-resents the sites with enzyme–substrate complexes. We note that [S] in this case is not the available substrate anymore but is reduced by a fractionθ.
Substituting [ES] from Eq. (A4) but knowing that [S] has now become [Sf], we obtain
[Sf] = [S]
θ −
[Sf] [Et]
Km+[Sf]
. (B7)
[Sf] is thus the solution of a quadratic polynomial:
[Sf] = 1 2
−
[Et]+Km− [S]
θ (B8) ± s
[Et] +Km− [S]
θ 2
+4·[S]
θ ·Km
.
The scenario of a limited reaction site is relevant if [Sθ] is small (i.e. [Sθ] [Et]). Under this scenario, we simplify Eq. (B8) using a Taylor expansion around[Sθ]=0:
[Sf] = [S]
θ ·
K
E
[Et] +Km
+O "
[S] θ
2#
. (B9)
Plugging this into the depolymerisation,
D= Kcat· [Et] ·
[S]
θ
[Et] +Km+[Sθ] ∼ =Kcat
· [Et] ·[Sθ] [Et] +Km
, (B10)
which has a Michaelis–Menten form with a saturating en-zyme concentration. This particular solution is for a small amount of binding sites, and enzymes compete for free sites.
Thus, [Et] [Sθ], and it can be dropped from within the de-nominator. On a side note: we obtain the same expression if we approximate from Eq. (B7):
[Sf] = [S]
θ − [Sf]
[Et] [Sf] +Km
, (B11)
[Sf] ∼= [S]
θ −
[Sf][Et]
Km
, (B12)
which assumes very few free sites ([Sf] Km). Therefore, [Sf] =
[S]
θ
Km [Et] +Km
. (B13)
We can also include equations for enzyme turnover (Eq. A7) to calculate [Et]: however, we need to substitute [S] in this equation with [Sf], and thus
d[Et] dt =P−
λE2·[Et]·[Sθ] [Et] +Km+[Sθ]
−λE1·[Et]·([Et]+Km) [Et] +Km+[Sθ]
.
(B14) Maintaining[Sθ]([Et]+Km), we obtain
d[Et] dt
∼
=P−λE2·[Et]·
S θ
[Et] +Km
−λE1· [Et]. (B15)
The quasi-equilibrium solution d[Et]
dt =0
yields a quadratic expression for[Et]; however, we can evaluate the following scenarios:
a. Suppose λE2·[Et]· S θ
[Et]+Km λE1· [Et]; this assumes that
en-zyme decay occurs mainly when bound to the substrate. Settingd[Et]
dt =0, we obtain
[Et] =
Km·P
λE2·Sθ −P
, (B16)
and withP proportional to microbial biomass (M)
D=Kcat·P
λE2
=Vmax·M, (B17)
whereVmax=Kλcat·b E2 .
In this case, depolymerisation and microbial consump-tion is independent of the substrate but is determined by the relative rate of catalysis and irreversible destruction of the enzyme–substrate complex.
b. Suppose λE2·[Et]· S θ
[Et]+Km λE1· [Et].
amount of free enzymes compared to enzyme substrate complexes.
We then obtain[Et] =λP E1 and D= Kcat·P·
S θ P+λE1·Km
. (B18)
WithP =b·M, we have
D=M·Vmax·S
Ke+M
, (B19)
whereVmax=Kθcat andKe=λE1b·Km.
Appendix C: Optimising depolymerisation
Microbes may be able to optimise their growth, and thus, depolymerisation becomes a function of the metabolic costs of enzyme production. Depolymerisation based on enzyme production, assuming fixed turnover of free enzymes, yields
D(P )=P·Vmax· [S]
Kp+P
, (C1)
where P is the amount of new enzyme produced, Vmax is
Kcat
θ , and Kp=λE1Km, based on the model with limited
available substrate.
Microbial growth (G) will be
G=(1−g)·(D−P c−λr·M), (C2)
wheregis the growth respiration factor,cthe respiratory cost per unit enzyme production, andλrthe maintenance respira-tion factor.
Enzyme production (P) can be optimised by substituting Eq. (C1) into Eq. (C2) and settingddGP =0. This yields
P c= −Kpc+pVmax· [S] ·Kpc. (C3) The proportion of carbon expended for enzyme production relative to depolymerisation is
P c
D =
s Kpc [S]Vmax
. (C4)
Instead of specifyingc, we used Eq. (C4) to express over-all microbial carbon expenditure for enzyme production. Af-ter assigning a value toµ, we calculate c based on equilib-riumSat reference temperature.
In contrast, the microbial scavenging scenario does not provide an optimum enzyme production. In this case, depoly-merisation is
D= P·Vmax· [S]
(Ke+M)·λE
. (C5)
Acknowledgements. The authors would like to thank the Inglett
and Gerber lab groups in the Soil and Water Science Department, University of Florida, for their scientific and critical discussion of model development and analysis. We also thank Will Wieder, Katerina Georgiou, and an anonymous reviewer for their insights and their constructive questions and comments. The project was partially supported by National Science Foundation (NSF) grant DEB 0841596.
Edited by: S. Zaehle
References
Allison, S. D.: Cheaters, diffusion and nutrients constrain decompo-sition by microbial enzymes in spatially structured environments, Ecol. Lett., 8, 626–635, doi:10.1111/j.1461-0248.2005.00756.x, 2005.
Allison, S. D.: Soil minerals and humic acids alter enzyme stabil-ity: implications for ecosystem processes, Biogeochemistry, 81, 361–373, doi:10.1007/s10533-006-9046-2, 2006.
Allison, S. D.: Modeling adaptation of carbon use efficiency in microbial communities, Frontiers in Microbiology, 5, 571, doi:10.3389/fmicb.2014.00571, 2014.
Allison, S. D., Wallenstein, M. D., and Bradford, M. A.: Soil-carbon response to warming dependent on microbial physiology, Nature Geosci., 3, 336–340, doi:10.1038/ngeo846, 2010.
Arora, V.: Modeling vegetation as a dynamic component in soil-vegetation-atmosphere transfer schemes and hydrological mod-els, Rev. Geophys., 40, 3-1–3-26, doi:10.1029/2001RG000103, 2002.
Beeftink, H. H., van der Heijden, R. T. J. M., and Heij-nen, J. J.: Maintenance requirements: energy supply from si-multaneous endogenous respiration and substrate consump-tion, FEMS Microbiol. Ecol., 6, 203–209, doi:10.1111/j.1574-6968.1990.tb03942.x, 1990.
Benbi, D. K., Boparai, A. K., and Brar, K.: Decomposition of par-ticulate organic matter is more sensitive to temperature than the mineral associated organic matter, Soil Biol. Biochem., 70, 183– 192, doi:10.1016/j.soilbio.2013.12.032, 2014.
Cannell, M. G. R. and Thornley, J. H. M.: Modelling the compo-nents of plant respiration: some guiding principles, Ann. Bot.-London, 85, 45–54, doi:10.1006/anbo.1999.0996, 2000. Chapman, S. J. and Gray, T. R. G.: Importance of cryptic growth,
yield factors and maintenance energy in models of microbial growth in soil, Soil Boil. Biochem., 18, 1–4, doi:10.1016/0038-0717(86)90095-7, 1986.
Chertov, O. and Komarov, A.: SOMM: A model of soil organic mat-ter dynamics, Ecol. Model., 94, 177–189, doi:10.1016/S0304-3800(96)00017-8, 1997.
Conant, R. T., Ryan, M. G., Ågren, G. I., Birge, H. E., Davidson, E. A., Eliasson, P. E., Evans, S. E., Frey, S. D., Giardina, C. P., and Hopkins, F. M.: Temperature and soil organic matter de-composition rates–synthesis of current knowledge and a way for-ward, Glob. Change Biol., 17, 3392–3404, doi:10.1111/j.1365-2486.2011.02496.x, 2011.
Coleman, K. and Jenkinson, D. S.: RothC-26.3 – A model for the turnover of carbon in soil, in: Evaluation of Soil Organic Matter Models Using Existing Long-Term Datasets, edited by: Powlson,
D. S., Smith, P., and Smith, J. U., Springer-Verlag, Heidelberg, 237–246, 1996.
Cooney, C. L.: Strategies for optimizing microbial growth and prod-uct formation, Foundations of biochemical engineering, Founda-tions of Biochemical Engineering, 207, 179–198, 2009. Cotrufo, M. F., Wallenstein, M. D., Boot, C. M., Denef, K.,
and Paul, E.: The Microbial Efficiency-Matrix Stabilization (MEMS) framework integrates plant litter decomposition with soil organic matter stabilization: do labile plant inputs form stable soil organic matter?, Glob. Change Biol., 19, 988–995, doi:10.1111/gcb.12113, 2013.
Davidson, E. A. and Janssens, I. A.: Temperature sensitivity of soil carbon decomposition and feedbacks to climate change, Nature, 440, 165–173, doi:10.1038/nature04514, 2006.
Davidson, E. A., Samanta, S., Caramori, S. S., and Savage, K. E.: The Dual Arrhenius and Michaelis–Menten kinetics model for decomposition of soil organic matter at hourly to seasonal time scales, Glob. Change Biol., 18, 371–384, doi:10.1111/j.1365-2486.2011.02546.x, 2012.
Davidson, E. A., Savage, K. E., and Finzi, A. C.: A big-microsite framework for soil carbon modeling, Glob. Change Biol., 20, 3610–3620, doi:10.1111/gcb.12718, 2014.
Foley, J. A., Prentice, I. C., Ramankutty, N., Levis, S., Pol-lard, D., Sitch, S., and Haxeltine, A.: An integrated biosphere model of land surface processes, terrestrial carbon balance, and vegetation dynamics, Global Biogeochem. Cy., 10, 603–628, doi:10.1029/96GB02692, 1996.
Fontaine, S. and Barot, S.: Size and functional diversity of microbe populations control plant persistence and long-term soil carbon accumulation, Ecol. Lett., 8, 1075–1087, doi:10.1111/j.1461-0248.2005.00813.x, 2005.
Franklin, O., Högberg, P., Ekblad, A., and Ågren, G. I.: Pine for-est floor carbon accumulation in response to N and PK addi-tions: bomb14C modelling and respiration studies, Ecosystems, 6, 644–658, doi:10.1007/s10021-002-0149-x, 2003.
Frantz, J. M., Cometti, N. N., and Bugbee, B.: Night tem-perature has a minimal effect on respiration and growth in rapidly growing plants, Ann. Bot.-London, 94, 155–166, doi:10.1093/aob/mch122, 2004.
Frey, S. D., Lee, J., Melillo, J. M., and Six, J.: The temperature re-sponse of soil microbial efficiency and its feedback to climate, Nature Clim. Change, 3, 395–398, doi:10.1038/nclimate1796, 2013.
Frost, P. C., Evans-White, M. A., Finkel, Z. V., Jensen, T. C., and Matzek, V.: Are you what you eat? Physiologi-cal constraints on organismal stoichiometry in an elemen-tally imbalanced world, Oikos, 109, 18–28, doi:10.1111/j.0030-1299.2005.14049.x, 2005.
Gerber, S., Hedin, L. O., Oppenheimer, M., Pacala, S. W., and Shevliakova, E.: Nitrogen cycling and feedbacks in a global dynamic land model, Global Biogeochem. Cy., 24, GB1001, doi:10.1029/2008GB003336, 2010.
German, D. P., Marcelo, K. R. B., Stone, M. M., and Allison, S. D.: The Michaelis-Menton kinetics of soil extracellular enzyme in response to temperature: a cross-latitudinal study, Glob. Change Biol., 18, 1468–1479, doi:10.1111/j.1365-2486.2011.02615.x, 2012.
tem-perature sensitivity of SOM decomposition, Glob. Change Biol., 16, 2789–2798, doi:10.1111/j.1365-2486.2009.02132.x, 2010. Hararuk, O., Smith, M. J., and Luo, Y.: Microbial models
with data-driven parameters predict stronger soil carbon re-sponses to climate change, Glob. Change Biol., 21, 2439–2453, doi:10.1111/gcb.12827, 2015.
Kivlin, S. N., Waring, B. G., Averill, C., and Hawkes, C. V.: Tradeoffs in microbial carbon allocation may mediate soil carbon storage in future climates, Front. Microbiol., 4, 261, doi:10.3389/fmicb.2013.00261, 2013.
Lawrence, C. R., Neff, J. C., and Schimel, J. P.: Does adding mi-crobial mechanisms of decomposition improve soil organic mat-ter models? A comparison of four models using data from a pulsed rewetting experiment, Soil Biol. Biochem., 41, 1923– 1934, doi:10.1016/j.soilbio.2009.06.016, 2009.
Li, C.: The DNDC model, in: Evaluation of Soil Organic Matter Models, edited by: Powlson, D. S., Smith, P., and Smith, J. U., Springer, Berlin, 263–268, 1996.
Li, J., Wang, G., Allison, S. D., Mayes, M. A., and Luo, Y.: Soil carbon sensitivity to temperature and carbon use efficiency com-pared across microbial-ecosystem models of varying complexity, Biogeochemistry, 119, 67–84, 2014.
Manzoni, S., Taylor, P., Richter, A., Porporato, A., and Ågren, G. I.: Environmental and stoichiometric controls on micro-bial carbon-use efficiency in soils, New Phytol., 196, 79–91, doi:10.1111/j.1469-8137.2012.04225.x, 2012.
Merchant, S. S. and Helmann, J. D.: Elemental economy: micro-bial strategies for optimizing growth in the face of nutrient limi-tation, Adv. Microb. Physiol., 60, 91–210, doi:10.1016/B978-0-12-398264-3.00002-4, 2012.
Menge, D. N. L., Pacala, S. W., and Hedin, L. O.: Emergence and maintenance of nutrient Limitation over multiple timescales in terrestrial ecosystems, The American Naturalist, 173, 164–175, 2009.
Molina, J. A. E., Hadas, A., and Clapp, C. E.: Computer sim-ulation of nitrogen turnover in soil and priming effect, Soil Biol. Biochem., 22, 349–353, doi:10.1016/0038-0717(90)90112-D, 1990.
Moorhead, D. L., Lashermes, G., and Sinsabaugh, R. L.: A theoretical model of C-and N-acquiring exoenzyme activities, which balances microbial demands during decomposition, Soil Biol. Biochem., 53, 133–141, doi:10.1016/j.soilbio.2012.05.011, 2012.
Moorcroft, P. R., Hurtt, G. C., and Pacala, S. W.: A method for scal-ing vegetation dynamics: The Ecosystem Demography Model (ED), Ecological Monographs, 71, 557–586, 2001.
Parton, W. J., Schimel, D. S., Cole, C. V., and Ojima, D. S.: Analysis of factors controlling soil organic matter levels in Great Plains grasslands, Soil Sci. Soc. Am. J., 51, 1173–1179, doi:10.2136/sssaj1987.03615995005100050015x, 1987. Pretzsch, H., Biber, P., Schütze, G., Uhl, E., and Rötzer, T.: Forest
stand growth dynamics in Central Europe have accelerated since 1870, Nat. Commun., 5, 1–10, doi:10.1038/ncomms5967, 2014. Russell, J. B. and Cook, G. M.: Energetics of bacterial growth: bal-ance of anabolic and catabolic reactions, Microbiol. Rev., 59, 48– 62, 1995.
Schmidt, M. W. I., Torn, M. S., Abiven, S., Dittmar, T., Guggen-berger, G., Janssens, I. A., Kleber, M., Kögel-Knabner, I., Lehmann, J., Manning, D. A. C., Nannipieri, P., Rasse, D.
P., Weiner, S., and Trumbore, S. E.: Persistence of soil or-ganic matter as an ecosystem property, Nature, 478, 49–56, doi:10.1038/nature10386, 2011.
Schmidt, S. K., Costello, E. K., Nemergut, D. R., Cleveland, C. C., Reed, S. C., Weintraub, M. N., Meyer, A. F., and Mar-tin, A. M.: Biogeochemical consequences of rapid microbial turnover and seasonal succession in soil, Ecology, 88, 1379– 1385, doi:10.1890/06-0164, 2007.
Schimel, J. P. and Weintraub, M. N.: The implications of exoen-zyme activity on microbial carbon and nitrogen limitation in soil: a theoretical model, Soil Biol. Biochem., 35, 549–563, doi:10.1016/S0038-0717(03)00015-4, 2003.
Sinsabaugh, R. L., Manzoni, S., Moorhead, D. L., and Richter, A.: Carbon use efficiency of microbial communities: stoichiom-etry, methodology and modelling, Ecol. Lett., 16, 930–939, doi:10.1111/ele.12113, 2013.
Sistla, S. A., Rastetter, E. B., and Schimel, J. P.: Responses of a tundra system to warming using SCAMPS: a stoichiometrically coupled, acclimating microbe-plant-soil model, Ecol. Monogr., 84, 151–170, doi:10.1890/12-2119.1, 2014.
Sitch, S., Smith, B., Prentice, I. C., Arneth, A., Bondeau, A., Cramer, W., Kaplan, J. O., Levis, S., Lucht, W., Sykes, M. T., Thonicke, K., and Venevsky, S.: Evaluation of ecosystem dynam-ics, plant geography, and terrestrial carbon cycling in the LPJ dy-namic global vegetation model, Glob. Change Biol., 9, 161–185, doi:10.1046/j.1365-2486.2003.00569.x, 2003.
Stark, J. M. and Hart, S. C.: High rates of nitrification and nitrate turnover in undisturbed coniferous forests, Nature, 385, 61–64, doi:10.1038/385061a0, 1997.
Stone, M. M., Weiss, M. S., Goodale, C. L., Adams, M. B., Fernan-dez, I. J., German, D. P., and Allison, S. D.: Temperature sensitiv-ity of soil enzyme kinetics under N-fertilization in two temperate forests, Glob. Change Biol., 18, 1173–1184, 2012.
Tang, J. Y.: On the relationships between the Michaelis-Menten ki-netics, reverse Michaelis-Menten kiki-netics, equilibrium chemistry approximation kinetics, and quadratic kinetics, Geosci. Model Dev., 8, 3823–3835, doi:10.5194/gmd-8-3823-2015, 2015. Tang, J. Y. and Riley, W. J.: Weaker soil carbon-climate feedbacks
resulting from microbial and abiotic interactions, Nature Clim. Change, 5, 56–60, doi:10.1038/nclimate2438, 2015.
Thornley, J. H. M.: Plant growth and respiration re-visited: mainte-nance respiration defined–it is an emergent property of, not a sep-arate process within, the system–and why the respiration: photo-synthesis ratio is conservative, Ann. Bot.-London, 108, 1365– 1380, doi:10.1093/aob/mcr238, 2011.
Todd-Brown, K. E. O., Hopkins, F. M., Kivlin, S. N., Talbot, J. M., and Allison, S. D.: A framework for representing microbial de-composition in coupled climate models, Biogeochemistry, 109, 19–33, doi:10.1007/s10533-011-9635-6, 2012.
Todd-Brown, K. E. O., Randerson, J. T., Post, W. M., Hoffman, F. M., Tarnocai, C., Schuur, E. A. G., and Allison, S. D.: Causes of variation in soil carbon simulations from CMIP5 Earth system models and comparison with observations, Biogeosciences, 10, 1717–1736, doi:10.5194/bg-10-1717-2013, 2013.
Van Bodegom, P.: Microbial maintenance: a critical re-view on its quantification, Microbial. Ecol., 53, 513–523, doi:10.1007/s00248-006-9049-5, 2007.
Van Veen, J., Ladd, J., and Frissel, M.: Modelling C and N turnover through the microbial biomass in soil, Plant Soil, 76, 257–274, 1984.
Vetter, Y. A., Deming, J. W., Jumars, P. A., and Krieger-Brockett, B. B.: A predictive model of bacterial foraging by means of freely released extracellular enzymes, Microbial Ecol., 36, 75– 92, 1998.
Wagai, R., Kishimoto-Mo, A. W., Yonemura, S., Shirato, Y., Hira-date, S., and Yagasaki, Y.: Linking temperature sensitivity of soil organic matter decomposition to its molecular structure, accessi-bility, and microbial physiology, Glob. Change Biol., 19, 1114– 1125, doi:10.1111/gcb.12112, 2013.
Wang, G. and Post, W. M..: A note on the reverse Michaelis-Menten kinetics, Soil Biol. Biochem., 57, 946–949, doi:10.1016/j.soilbio.2012.08.028, 2013.
Wang, G., Post, W. M., and Mayes, M. A.: Development of microbial-enzyme-mediated decomposition model parameters through steady-state and dynamic analyses, Ecol. Appl., 23, 255– 272, doi:10.1890/12-0681.1, 2013.
Wang, Y. P., Chen, B. C., Wieder, W. R., Leite, M., Medlyn, B. E., Rasmussen, M., Smith, M. J., Agusto, F. B., Hoffman, F., and Luo, Y. Q.: Oscillatory behavior of two nonlinear microbial models of soil carbon decomposition, Biogeosciences, 11, 1817– 1831, doi:10.5194/bg-11-1817-2014, 2014.
Wieder, W. R., Bonan, G. B., and Allison, S. D.: Global soil car-bon projections are improved by modelling microbial processes, Nature Clim. Change, 3, 909–912, doi:10.1038/nclimate1951, 2013.
Wieder, W. R., Grandy, A. S., Kallenbach, C. M., and Bonan, G. B.: Integrating microbial physiology and physio-chemical principles in soils with the MIcrobial-MIneral Carbon Stabilization (MIM-ICS) model, Biogeosciences, 11, 3899–3917, doi:10.5194/bg-11-3899-2014, 2014a.
Wieder, W. R., Boehnert, J., and Bonan, G. B.: Evaluating soil biogeochemistry parameterizations in Earth system mod-els with observations, Global Biogeochem. Cy., 28, 211–222, doi:10.1002/2013GB004665, 2014b.
Wieder, W. R., Allison, S. D., Davidson, E. A., Georgiou, K., Hararuk, O., He, Y., Hopkins, F., Luo, Y., Smith, M. J., Sul-man, B., Todd-Brown, K., Wang, Y., Xia, J., and Xu, X.: Explic-itly representing soil microbial processes in Earth system mod-els, Global Biogeochem. Cy., 29, 1782–1800, 2015a.