A b s t r a c t. The effects of climate change on land capability are compared for two cultivation methods (irrigated and rainfed) in a semi-arid region – Ahar (East Azarbaijan, IRAN). Two models: Terraza and Cervatana, included in the land evaluation decision sup-port system called MicroLEIS DSS, were used. While Terraza gives a quantitative prediction of the bioclimatic deficiency of a site, Cervatana forecasts the general land use capability or suitability for a broad series of possible agricultural uses. A future scenario of clima-te change was calculaclima-ted according to the Inclima-tergovernmental Panel on Climate Change (IPCC) on regions of Asia under scenario A1 (highest future emission) for 2080s. The results showed that clima-te change is likely to cause severe waclima-ter stress in irrigaclima-ted culti-vation of alfalfa, sugar beet, potato, and maize, being the use of irri-gation methods essential to maintain the agricultural productivity. However, the land capability classification for wheat crop in the future scenario will remain constant. Although irrigation is indi-cated as very important in this semi-arid agriculture, cultivation of rainfed wheat can be possible instead of the irrigated cultivation. In summary, this modelling application approach predicts that yield reduction of the selected crops, in rainfed and irrigated conditions, will increase by 18 and 13%, respectively.
K e y w o r d s: climate change scenario, land capability evaluation, MicroLEIS DSS, semi-arid climate, yield reduction
INTRODUCTION
The general scientific consensus is that a significant cli-mate change will occur during the next 100 years, although there remain quantitative uncertainties in the climate mo-dels. This climate change will not occur without marked im-pacts upon various sectors of our environment, and conse-quently of our society (Chavaset al., 2009). Climate chan-ges in the semi-arid regions will appear which will have an important impact on soil capability. Crop simulation
model-ling studies based on future climate change scenarios indicate that substantial losses are likely in rainfed wheat in South and South-East Asia (Fischeret al., 2002). For example, a 0.5°C rise in winter temperature would reduce wheat yield by 0.45 t ha-1in India (Kalraet al., 2003). Climate change can affect other parameters, such as land degradation risks in agricul-tural areas, soil erosion, and contamination. Increased land degradation is one possible, and important, consequence of global climate change. Therefore, the prediction of global environmental change impacts on these degradation risks is a priority (De la Rosa, 2008; De la Rosaet al., 1996).
It is estimated that a minimum cropland area of 0.5 ha/ person is required to provide an adequate diet (Lal, 1989). Of course, this makes certain assumptions about the climate and soil conditions, and about the level of technology used. Agricultural management systems located on the most-sui-table lands, depending on their agroecological potentiali-ties and limitations, constitute the first step to achieving soil sustainability which has resulted in Ahar region as a land use planning without attention to the climate change impact (Shahbaziet al., 2008). Contrarily, any kind of agricultural management system will have a negative environmental impact when applied on land with very low suitability for agricultural uses.
MicroLEIS DSS application and climate change impact in two semi-arid and Mediterranean regions showed that alfalfa has 40 and 50% of yield reduction respectively in Ahar and Sevilla area, and this coefficient will increase 10% by cli-mate change. Also, maize has 70 and 35% of yield reduction, respectively in Ahar and Seville area, and this coefficient will increase 20% by climate change.
Climate change impact on land capability using MicroLEIS DSS
F. Shahbazi
1*, A.A. Jafarzadeh
1, F. Sarmadian
2, M.R. Neyshaboury
1, S. Oustan
1, M. Anaya-Romero
3,
M. Lojo
3, and D. de la Rosa
31
Department of Soil Science, Faculty of Agriculture, University of Tabriz, 51664-16471, Tabriz, Iran 2
Department of Soil Science, Faculty of Agriculture, University of Tehran, Karaj, Iran 3
Institute for Natural Resources and Agrobiology (IRNAS), Centre of the Science Research Council (CSIC), Avda. Reina Mercedes 10, 41012 Sevilla, Spain
Received June 30, 2008; accepted August 5, 2008
© 2009 Institute of Agrophysics, Polish Academy of Sciences
*Corresponding author’s e-mail: [email protected]
A A
Agggrrroooppphhyhyysssiiicccsss
To date, in Iran, high technology in information and knowledge was not a common tool for evaluating land capability and suitability except the last investigations by using MicroLEIS DSS in Ahar (Shahbaziet al., 2009a) and Souma area with attention to some natural phenomenon such as climate change (Shahbaziet al., 2009b). However, land evaluation results from a complex interaction of phy-sical, chemical, and bioclimatic processes and evaluation mo-dels are reliable enough to predict accurately the behaviour of land (Ball and De la Rosa, 2006; CEC, 2004; Heldet al., 2003). As land evaluation focuses on global change, this me-thodology could be used to investigate the impact of climate change on potentialities and vulnerabilities of the land. The fundamental purpose of land evaluation is to predict the po-sitive or negative consequences of change. Land evaluation can be a formal, structured method to assess land degra-dation risks caused, for example, by long-term changes in climatic conditions and/or agricultural systems.
On the other hand, decision support systems (DSS) are informatics systems that combine information from diffe-rent sources; they help in the organization and analysis of information, and also facilitate the evaluation (Eomet al., 1998; Sauter, 1997). In this conceptual framework was de-veloped the land evaluation decision support system MicroLEIS DSS (De la Rosaet al., 2004; 2009). The MicroLEIS DSS system, through its 12 land evaluation models, ana-lyzes the influence of selected soil indicators on critical soil functions referred to: 1) land productivity (agricultural and forest soil suitability, crop growth, and natural fertility), and 2) land degradation (runoff and leaching potential, erosion resistance, subsoil compaction, workability, and pollutant absorption and mobility). These knowledge-based models were basically developed as sophisticated tools based on arti-ficial intelligence techniques. Input variables are physical/ chemical soil parameterseguseful depth, stoniness, texture, water retention, reaction, carbonate content, salinity, or cation exchange capacity collected in standard soil surveys, monthly agroclimatic parameters for long-term period, and agricultural crop and management.
The main objective of this work is to distinguish the best agricultural lands from the marginal ones, and to predict the impacts of climate change on the lands in Ahar area. By using MicroLEIS DSS (De la Rosaet al., 2004; 2009), a land evaluation analysis was developed to calculate bioclimatic deficiency and land capability of these soils, and for two hypothetical climate scenarios: current and future. This work also focuses on agricultural management changes, in rainfed and irrigated conditions, to mitigate the negative climate impact and achieve sustainable agriculture in the long term.
MATERIALS AND METHODS
This study was performed in the Ahar province of East Azarbaijan, Iran, which has different kinds of land use associated with soils of different parent material, such as limestone, old alluvium, and volcano-sedimentary rocks. It
covers about 9000 ha, between 47°00'00'' to 47°07'30'' East and 38°24'00'' to 38°28'30'' North. Its slopes range from <2 to 30%, and the elevation is from 1 300 to 1 600 m above sea level. Flat, alluvial plain, hillside, and mountain are the main physiographical units in the study area. A detailed soil sur-vey under soil family category was followed in the Ahar study area, of about 9 000 ha of extension, which is summa-rised in the soil map shown in Fig. 1. A total of 44 soil profiles were characterized in the field and the lab, deter-mining standard morphological, physical and chemical variables. According to the USDA Soil Taxonomy (2006), the dominant soils are classified as Inceptisols, Entisols, and Alfisols. Additionally, 10 soil subgroups and 23 soil fami-lies were obtained. Typic Calcixerepts is the major subgroup (> 53% area). The location of the study area accompanied with soil family covered is shown in Fig. 1.
The multilingual soil database SDBm Plus (De la Rosa et al., 2002) was used to store and manipulate this large amount of soil data. The input data were the following: field site descriptions and soil profile characteristics; standard soil analytical data and soluble salts data; and soil physical analytical data, especially with reference to infiltration and water retention. Major facilities of SDBm plus include input, edit, print, selection, and file generation. The ‘soil layer generator’ option provides a useful interface between SDBm plus and the land evaluation and geographic infor-mation systems. The control section for applying the Cervatana model was between 0 and 50 cm. Physical and chemical analysis report is summarised in Table 1.
Climate data, such as mean average maximum and minimum temperatures for each month and total annual precipitation for last 20 consecutive years (1986-2006), were collected from Ahar meteorological station (Shahbazi et al., 2008). These data were integrated in the CDBm data-base (De la Rosaet al., 1986). Climate observation at a parti-cular meteorological or weather station is the essence of the Monthly Climate Database CDBm, a major component of MicroLEIS DSS (De la Rosaet al., 2004). The mean values of such records for more than 10 days (20 consecutive years) are considered climatic magnitudes. It is precisely by a period of time that meteorology is distinguished from weather. The basic data of CDBm are the mean values of the daily dataset for a particular month. Climate data, such as mean maximum and minimum temperatures, and total annual precipitation, are input variables in CDBm to calculate potential evapotrans-piration using two methods: Thorenthwaite (1948) and Hargrea-veset al. (1985). Results of CDBm program calculations for two hypothetical scenarios are shown in Table 2.
and is greater at higher northern latitudes. All of Asia is very likely to warm up during this century; the warming will pro-bably be well above the global mean in west Asia (Christen-senet al., 2007). In order to apply the land evaluation ap-proach, two climate change scenarios were constructed. The first was defined by the climate over the last 20 years (1986-2006) (Table 2). The second scenario is based on pro-jected changes in surface air temperature and precipitation for west Asia under the highest future emission trajectory (A1FI) for the 2080s (IPCC, 2007). Following the IPCC report, the mean temperature (ºC) will increaseby 5.1, 5.6, 6.3 and 5.7 in winter, spring, summer and autumn,
respec-tively, in the future scenario at the study area. On the other hand, total precipitation will decrease by 11 and 25% in winter and spring, while it will increase by 32 and 52% in summer and autumn. It is estimated that the agricultural irrigation demand in arid and semi-arid regions of Asia will increase by at least 10% for an increase in temperature of 1°C (Fischer et al., 2002; Liu, 2002). In the study area, climate change is likely to cause severe water stress in the 21st century because of the decreasing of precipitation in the growing season, and water management will be increasingly important. Results of CDBm program calculations for the two hypothetical scenarios are shown in Table 2.
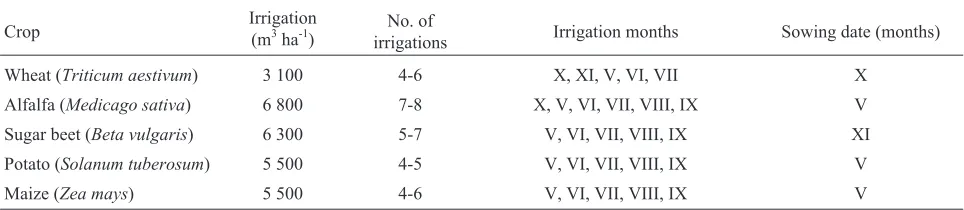
The semi-arid region is characterized by seasonal distri-bution of precipitation, with summers more or less dry; this situation is not very suitable for crop growth. Therefore, most agricultural production systems depend basically on irrigation water as an available water resource. The amount of water for irrigation of the selected crops in Ahar province ranges between 3 100 and 6 800 m3ha-1, with 35% water use efficiency (Farshiet al., 1997). The number of irrigations in the growing period is 4-8. Table 3 summarises the present water management conditions for the study area.
MicroLEIS DSS (De la Rosa 2004; 2009) is a decision support system for scaling-up process knowledge from micro-scale to a landscape micro-scale, such as regional micro-scale. Currently, socio-economic attributes are not considered. MicroLEIS DSS has evolved significantly towards a user-friendly agro-ecological decision support system for environmentally sus-tainable soil use and management. The design philosophy is a toolkit approach, integrating many software instruments:
databases, statistics, expert systems, neural networks, Web and GIS applications, and other information technologies. Through its 2 land evaluation models, Terraza and Cervatana, it analyzes the influence of selected soils on land potentia-lities attention to climate perturbations.
The Terraza model, as a component of MicroLEIS DSS (De la Rosaet al., 2004; 2009), predicts the bioclimatic defi-ciency of a site mainly from climatic factors and certain others of the plant and soil, so that the evaluation of a single land unit (climate and soil) may differ depending on the current use (crop). In general terms, the criteria followed are those established by the FAO (1976), with some adaptations.
This bioclimatic classification begins by determining the monthly potential evapotranspiration (ETo), using the method of Thorenthwaite (1948), from the monthly mean tempe-rature (Tm), and the monthly coefficient of light correction (Nm) depending on the site latitude. The monthly evapotrans-piration of the crop (ETc) is calculated fromEToas follows: USDA
soil subgroups
Useful depth
(cm)
Soil physical properties Soil chemical properties Texture Coarse
fragment (%)
Bulk density (g cm-3)
Water capacity
(cm)
Carbonate content
(%)
Organic carbon
(%)
ESP (%)
EC (dS m-1)
pH
Aquic Haploxerepts 130 Clay loam 1.30 1.10 14.09 11.36 1.01 4.21 2.47 8.14
Calcic Haploxerepts 147 Clay 7.16 1.42 13.55 19.65 0.91 2.54 1.52 8.26
Fluventic Haploxerepts 119 Sandy clay loam
22.76 1.37 17.91 10.26 0.30 6.00 0.77 8.71
Typic Calcixerepts 151 Clay loam 10.92 1.33 12.99 18.31 0.61 2.14 1.49 8.23
Typic Haploxerepts 128 Clay loam 6.40 1.26 13.46 14.80 0.84 1.82 0.95 8.27
Vertic Calcixerepts 140 Clay 4.00 1.25 14.58 17.87 0.50 3.10 1.25 8.42
Vertic Haploxeralfs 185 Clay 0.80 1.23 11.50 13.80 0.97 5.36 2.10 8.48
Vertic Haploxerepts 135 Clay loam 12.78 1.54 11.35 14.58 0.76 3.72 2.00 8.32
Vitrandic Calcixerepts 150 Clay 12.26 1.34 9.72 14.91 0.33 1.32 0.70 8.46
Typic Xerorthents 62 Sandy clay loam
10.80 1.50 10.50 6.82 0.74 1.07 1.00 7.90
*Mean value of selected parameters measured in the topsoil (0-50 cm), ESP – exchangeable sodium (%), EC – electrical conductivity.
T a b l e 1.Summary of major soil variables* of the soil types characterized in Ahar study area
Variables
Mean temperature
(°C)
Precipitation (mm)
ETo (mm)
Humidity index
Aridity index
Growing season
Arkley index
Current scenario 10.8 299.4 660.3 0.45 6 8 76.1
Future scenario 16.5 307.4 846.9 0.36 7 11 52.6
ETo– potential evapotranspiration.
ETc = ETo Kc, (1) where:Kc– monthly coefficient of the crop; the monthly real evapotranspiration (ETa) is given by:
ETa = ETc – D, (2)
where:D– monthly water deficit of the site.
The difference between monthly evapotranspiration and precipitation at a site can be positive or negative. If positive, there is a surplus or excess (S) of water; if negative, there is a deficit or lack (D). During the seasonal period of a crop, this difference is calculated between the precipitation and evapotranspiration of the crop (ETc).
Then, the monthly reduction in crop production (Ry) is calculated using the following formula:
1- Ya/Ym = Ky(1- ETa/ETc), (3) substituting
1- Ya/Ym = Ry, (4)
we have:
Ry = Ky(1- ETa/ETc) x 100 (expressed as %) (5) where:Ya– real crop production,Ym– potential crop pro-duction,Ky– coefficient of efficiency of the crop.
The coefficientsKcandKyare determined using works of the Doorenbos and Pruitt (1977) which establish the diffe-rent phenological periods of various crops with diffediffe-rent management levels (extensive, intensive or moderate).
Finally, the annual reduction in crop production (Rys) is calculated as follows:
Rys = Kys(1-SETa/SETc) 100 (6) where:Kys– coefficient of seasonal reduction,SETa– sum of the monthly real evapotranspiration during the phenolo-gical period of the crop,SETc– sum of the monthly evapo-transpiration of the crop during its phenological period.
In this research, the variable parameters were climate data for current scenario (1986-2006) and for the 2080s. Calculation of the bioclimatic classification and percentage of yield reduction begins by determining the monthly poten-tial evapotranspiration (ETo), using the method of Thorenth-waite. Soil water retention capacity for all soil types was va-riable from 7.3 to 17 cm; the mean value was applied to run the Terraza model. Crop coefficient and yield response factor of the crops were as given by FAO (1976). Within the model it is possible to define any arbitrary set of climate perturba-tions as the hypothetical climate change. For example, maxi-mum and minimaxi-mum temperature (°C) and precipitation (%) are climate-related factors that could be applied as climate change by increment (+ or -). The water irrigation amount (cm) can be considered a precipitation factor. Yield reduction of wheat, alfalfa, sugar beet, potato, and maize – in either rainfed or irrigated cultivation for two comparable scenarios – was calculated.
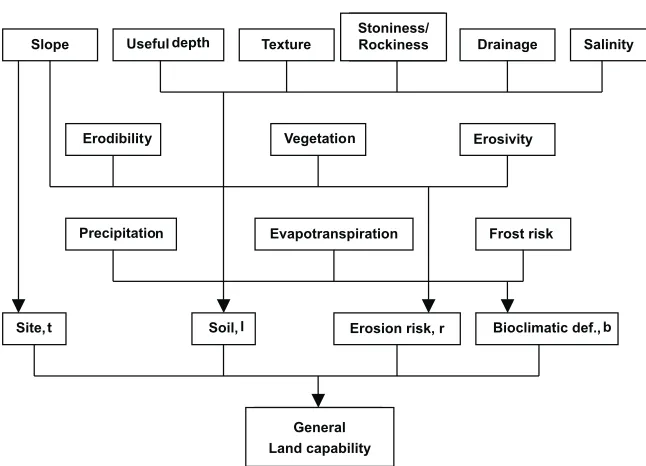
The Cervatana model, as a component of MicroLEIS DSS (De la Rosaet al., 2004; 2009), predicts the general land use capability for a broad series of possible agricultural uses. As shown in Fig. 2, the data requirements can be grouped in the following biophysical factors: relief, soil, climate, and current use or vegetation. This qualitative model works interactively, through different gradation matrixes, comparing the values of the input characteristics of the land unit to be evaluated with the generalization levels established for each capability class. The first three classes – S1, S2, and S3 – include land considered able to support continuing, intensive agricultural use, while land of Class N is more appropriate for natural or forestry use.
Through the integration of MicroLEIS DSS with GIS techniques, it is possible to expand land evaluation results from point to geographic areas, using soil survey and other related maps. Arc View GIS was used in this research work to show Cervatana model results by long-term changes in climatic conditions and/or agricultural systems. To this geo-graphic level of assessment is where policy decision is usually made (De la Rosa et al., 2009; Martinez, 2009; Willemen et al., 2008). The potential capability classifi-cation was made for both rainfed and irrigated cultivations.
Crop Irrigation(m3
ha-1)
No. of
irrigations Irrigation months Sowing date (months)
Wheat (Triticum aestivum) 3 100 4-6 X, XI, V, VI, VII X
Alfalfa (Medicago sativa) 6 800 7-8 X, V, VI, VII, VIII, IX V
Sugar beet (Beta vulgaris) 6 300 5-7 V, VI, VII, VIII, IX XI
Potato (Solanum tuberosum) 5 500 4-5 V, VI, VII, VIII, IX V
Maize (Zea mays) 5 500 4-6 V, VI, VII, VIII, IX V
RESULTS AND DISCUSSION
Graphical representation under climate change impact for hypothetical future scenario using CDBm database system is shown in Fig. 3. Comparing with the current sce-nario (Shahbaziet al., 2008), in the long term, annual ave-rage of temperature, precipitation and evapotranspiration will be increased by 5.7°C, 12 and 28%, respectively, by climate change. This means that in the far future, erosivity can decrease, despite rainfall, and the main problem for agricultural land use will be drought.
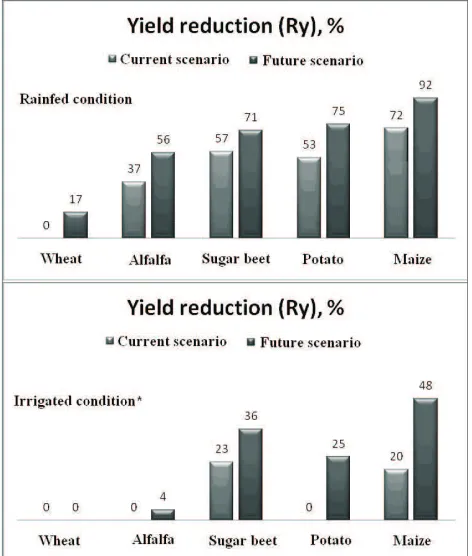
The bioclimatic deficiency was calculated applying the Terraza model, for the major crops in Ahar area: wheat, alfalfa, sugar beet, potato and maize.
In the current scenario, the Terraza modelling approach predicts that wheat has 0% (H1 class) of yield reduction in both rainfed and irrigated cultivations. The usual irrigation in the study area (Table 3) for potato and alfalfa is sufficient, increasing their bioclimatic classes from H3 and H2 to H1. Sugar beet and maize currently have 57 and 72% yield re-duction of prore-duction, while this rere-duction will decrease to 23 and 20%, respectively, for the selected crops.
In rainfed cultivation, yield reduction of production for wheat, alfalfa, sugar beet, potato, and maize is increased 17, 19, 14, 22, and 20%, respectively, as a result of climate change, while for the irrigated condition, these parameters were calcu-lated as 0, 4, 13, 25, and 28%, respectively. Applying the usual irrigation, the amount of water is sufficient for wheat, alfalfa and sugar beet, but for potato – and especially for maize – it is inadequate. Using new and classic irrigation methods can be recommended to increase the water use efficiency and decrease the yield reduction of production (Fig. 4).
The Terraza model approach predicts that the currently high water deficit in the study area will be increased as a re-sult of climate change by the 2080s for all the crops except wheat. Although irrigation is indicated as very important in this semi-arid agriculture, results show that cultivation of rainfed wheat is possible in order to reduce the tillage operation costs.
The land capability was evaluated, soil by soil, applying the Cervatana model in the 9 000 ha of Ahar area. This land evaluation analysis was developed for the current and future climate scenarios, and for rainfed and irrigation conditions.
For the two hypothetical scenarios (the current situation and the 2080s) it was showed that wheat crop in all the simu-lated conditions has the same land capability classification. As shown in Table 4, 41.7, 45.6, and 11.7% of the total area presents excellent (S1), good (S2), and moderate (S3) capability classes, respectively. Soil limitation was the main factor for converting the capability class from excellent to good. The bioclimatic limitation factor (b) was not determi-ned in the cultivation of wheat. Therefore, the capability classes will not be changed in the long-term scenario.
With climate change, 45.6% of the total area for alfalfa has been changed from good- to moderate-capability land. The same area for potato and sugar beet has been changed from good- to moderate-capability land. The whole area was not suitable in either the current situation or the 2080s for maize. Bioclimatic deficiency was the most-limiting factor.
Finally, concerning soil evaluation, eight application soil subgroups are classified as arable or best agricultural lands, and other two as moderate lands under rainfed condition. Typic Calcixerepts, Typic Haploxerepts, Vertic
Slope Useful depth
Stoniness/ Rockiness
Drainage
Texture Salinity
Erosivity Vegetation
Erodibility
Evapotranspiration Frost risk
Site, t Soil, l Erosion risk, r Bioclimatic def., b
General Land Capability Precipitation
Stoniness/ Rockiness
General Land capability
Calcixerepts, Vertic Haploxeralfs, Calcic Haploxerepts, and Vertic Haploxerepts present an extension of 22.8, 7, 5.6, 3.1, 1.83, and 1.43%, respectively, of S1 class for most of the crops. Soil and topography limitations are the two basic factors in classifying the Fluventic Haploxerept and Vitran-dic Calcixerept subgroups as moderate lands that are cur-rently dedicated to agricultural use. The change in these last two soil subgroups from natural habitat to intensively tilled agricultural cultivation is one of the primary reasons for soil degradation. Land use will be taken as optimum when consi-dering the moderate arable lands as a natural habitat culti-vation area. However, 45% of the study area is classified by the soil limitation factor as good-capability land. The gene-ral land capability classification integrated with GIS and soil subgroups is summarised in Table 4.
The land capability classification for irrigated cultiva-tion using the normal water amount associated with 35% water use efficiency is divided in two sets: Dense cover (wheat and alfalfa) and moderate cover (sugar beet, potato, and maize). The first group presents similar capability classes to that for rainfed cultivation of wheat.
Sugar beet cultivation showed no response to climate change concerning the constant bioclimatic deficiency class (H2), so 87.3% was good agricultural land and the rest was moderate agricultural land. The major limitation factors in classifying the capability of the area were bioclimatic and erosion risks which were constant with climate change. The results showed that bioclimatic deficiency is the main agent in decreasing the capability classes in irrigated cultivation of potato and maize.
Fig. 3.Graphical representation of climate information by climate change.Tm– mean temperature,P– precipitation,Gs– growing period,Eto– potential evapotranspiration, Ari – aridity index.
CLIMATECHANGEIMPACTONLANDCAPABILITY,USINGMICROLEISDSS
USDAsoil family*
Approx. exten- sion (ha)
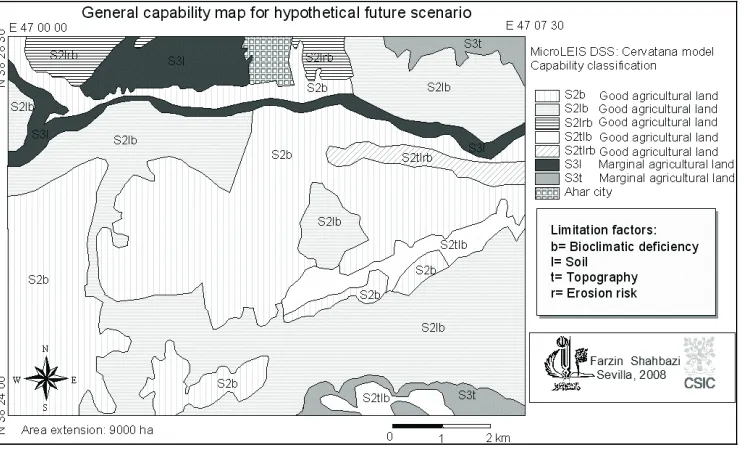
Spatialization or regionalization analysis includes the use of spatial techniques to expand land evaluation results from point to geographic areas, using soil survey and other related maps. The use of geographic information system (GIS) technology leads to the rapid generation of thematic maps and area estimates, and enables many of the analytical and visualization operations to be carried out in a spatial for-mat, by combining different sets of information in various ways to produce overlays and interpreted maps. This tech-nology is already a prerequisite for managing the massive data-sets required for spatial land evaluation application – a sim-ple map subsystemegArcView being all that is required to show basic data and model results on a map, or to extract infor-mation from maps to be used in the land evaluation models. In the present work, results from the Cervatana model were combined with GIS (ArcView 3.2) in order to develop a com-puterized spatial database with the aim of suggesting sui-table land management strategies for environment conserva-tion; as a result the general capability map of study area for hypothetical future scenario that is shown in Fig. 5 was obtained.
Testing analysis involves comparison of outputs of MicroLEIS DSS models with real information and determi-nation of the DSS suitability for the intended purpose. Real information represents field data on the aspects for which the models are being tested. During the modelling develop-ment phase, each model was already validated, including generally calculation of standard errors, root mean square error, slope and intercept of regression, and correlation of observed vs. predicted results (De la Rosaet al., 2004; 2009). Also, other scientists have tested the models over diverse regions exposing models to new and different environments and testing model robustness (Machin and Navas, 2007).
Therefore, comparing the results of model application with the real condition of arable areas showed that MicroLEIS DSS can be used in this semi arid region with special referen-ce to its high accuracy in the current situation. The predicted land capability values were simulated by extrapolation from benchmark site results applying the Cervatana model to the cor-responding natural region. The relationship between predicted land capability and present land use from statistical records is clearly unbalanced. About 250 000 ha of rainfed agricul-tural lands must be changed to forestry, grazing or naagricul-tural lands in order to get a better equilibrium in comparison with the moderately or clearly marginal lands. Similar situations are very frequent in the Mediterranean region, and it is, for example, the major reason for the reforestation program launched by the European Commission.
CONCLUSIONS
1. Land evaluation appears to be a useful way to develop the potential and/or general capability to distinguish the best agricultural land resulting from interactive changes in land use and climate. In Ahar, 45% of the total area was classified as good-capability land for agricultural uses, for the current climate. However, almost 12% of the total area (including Fluventic Haploxerepts, Vitrandic Calcixerepts, and some parts of Typic Calcixerepts and Typic Xerorthents) is classi-fied within Class N, what is more appropriate for natural of forestry use.
2. Bioclimatic deficiency is the most-sensitive factor affected by climate change. For rainfed conditions, the yield reduction increases with climate change for all the studied crops, as follows: wheat < alfalfa < sugar beet < potato < maize, however, for irrigation conditions, the yield re-duction is alfalfa < potato < sugar beet < maize.
3. Nevertheless, irrigation is indicated as very important in this semi-arid agriculture; the cultivation of rainfed wheat can be recommended instead of the cultivation of irrigated wheat to reduce the tillage operation costs.
4. Climate perturbation effects on rainfed conditions are higher than on irrigated conditions. Irrigated maize and potato will be affected more than the other studied crops in the future scenario. The general capability classification, with special reference to the wheat crop, is constant in the two comparable scenarios. The slope and the soil depth are the major limi-tation factors in this agroecological zoning classification.
5. As climate change is likely to cause severe water stress in the 21st century, water management will be in-creasingly important. The use of modern irrigation methods can be recommended for the Ahar area in the future.
6. The climate change will cause the conversion of the best agricultural lands into the marginal ones in all soil units of the study area due to bioclimatic deficiency for the future scenario (A1). Therefore, a total of 3 860 ha has converted from excellent to good capable agricultural lands.
REFERENCES
Ball A. and De la Rosa D., 2006.Modelling possibilities for the assessment of soil systems. In: Biological Approaches to Sustainable Soil Systems (Eds N. Uphoff, A. Ball, E. Fernan-des, H. Herren, O. Husson, M. Laing, Ch. Palm, J. Pretty, P. Sanchez,N.Sanginga,J.Thies).CRCPress,BocaRaton, FL, USA. CEC,2004. Thematic Strategy for Soil Protection. Report EUR
21319EN. EC Press, Luxembourg.
Chavas D.R., Izaurralde R.C., Thomson A.M., and Gao X., 2009.Long-term climate change impacts on agricultural pro-ductivity in eastern China. Agric. Forest Met., 149(6-7), 1118-1128.
Christensen J., Hewitson B.C., Busuioc A., Chen A., Gao. X., Jones R., Kwon W.T., Laprise R., Magana V., Mearns L., Menenedez C., Raisaenen J., Rinke A., Kolli R. K., and Sarr A., 2007.Climate Change 2007: The Scientific Basis. Report, Cambridge Univ. Press, Cambridge, UK.
De la Rosa D., 2008.Agro-ecological land evaluation for sustai-nable rural development (in Spanish). CSIC/Mundi- Prensa, Madrid, Spain.
De la Rosa D., Anaya-Romero M., Diaz-Pereira M., Heredia N., and Shahbazi F., 2009.Soil-specific agro-ecological strategies for sustainable land use – A case study by using MicroLEIS DSS in Sevilla Province (Spain). Land Use Policy, 26(4), 1055-1065.
De la Rosa D., Crompvoets J., Mayol F., and Moreno J.A., 1996. Land vulnerability evaluation and climate change impacts in Andalucia, Spain: soil erosion and contami-nation. Int. Agrophysics, 10, 225-238.
De la Rosa D., Mayol F., Diaz-Pereira E., and Fernandez M., 2004.A land evaluation decision support system (MicroLEIS DSS) for agricultural soil protection. Environ. Modeling Software, 19, 929-942.
De la Rosa D., Mayol F., Moreno F., Cabrera F., Diaz-Pereira E., and Antoine J., 2002.A multilingual soil profile database (SDBm plus) as an essential part of land resources infor-mation systems. Environ. Modeling Software, 17, 721-731.
De la Rosa D., Mayol F., Moreno J.A., and Rosales A., 1986.
CDBm, Monthly Climate Database. MicroLEIS 4.1., Explo-ring the Agro-ecological Limits of Sustainability. IRNAS Press, Sevilla, Spain.
Doorenbos J. and Pruitt W.O., 1977.Crop Water Requirements. Irrigation and Drainage Paper, 24. FAO Press, Rome, Italy.
Eom S.B., Lee S.M., Kim E.B., and Somarajan C., 1998.A survey of decision support system applications. J. Oper. Res., 49, 109-120. FAO,1976.A framework for Land Evaluation. Soils Bulletin, 32.
FAO Press, Rome, Italy.
Farshi A.A., Shariati M.R., Jarollahi R., Ghasemi M.R., Shahabifar M., and Tolayi M., 1997.Water Requirement Estimating of Main Crops. Karaj Univ. Press, Karaj, Iran.
Fischer G., Shah M., and van Velthuizen H., 2002. Climate Change and Agricultural Vulnerability. Report, 1113. IIASA WSSD Press, Laxenburg, Austria.
Hargreaves D.A., Hargreaves G.H., and Riley J.P., 1985. Irriga-tion water requirements for Senegal river basin. J. Irrig. Drain., 3, 265-275.
Held M., Imeson A., and Montanarella L. (Eds.), 2003. Econo-mic Interests and Benefits of Sustainable Use of Soils and Land Management. Joint Res. Centre Press, Ispra, Italy.
Kalra N., Aggarwal P.K., Chander S., Pathak H., Choudhary R., Choudhary A., Mukesh S., Rai H.K., Soni U.A., Anil S., Jolly M., Singh U.K., Owrs A., and Hussain M.Z., 2003.
Impacts of climate change on agriculture. Climate change and India. In: Vulnerability Assessment and Adaptation (Eds P.R. Shukla, S.K. Sharma, A. Ravindranath, A. Garg, S. Bhattacharya). Orient Longman Press, Hayderabad, India.
Lal R., 1989.Land degradation and its impact on food and other resources. In: Food and Natural Resources (Eds D. Pimentel, C.W. Hall). Academic Press, San Diego, CA, USA.
Liu C.Z., 2002.Suggestion on water resources in China correspon-ding with global climate change. China Water Res., 2, 36-37.
Machin J. and Navas A., 2007.Land evaluation and conservation of semi arid agro-systems in Zaragoza (Spain) using an expert evaluation system and GIS. Land Degr. Develop., 6(4), 203-214.
Martinez J., 2009. The use of GIS and indicators to monitor intra-urban inequalities. A case study in Rosario, Argentina. Habitat Int., 33(4), 387-396.
Sauter V.L., 1997.Decision Support System: An Applied Mana-gerial Approach. Wiley Press, New York, USA.
Shahbazi F., De la Rosa D., Anaya-Romero M., Jafarzadeh A.A., Sarmadian F., Neyshaboury M.R., and Oustan S., 2008.
Land use planning in Ahar area (Iran) using MicroLEIS DSS. Int. Agrophysics, 22, 277-286.
Shahbazi F., Jafarzadeh A.A., Sarmadian F., Neyshaboury M.R., Oustan S., Anaya-Romero M., and De la Rosa D., 2009a.
Suitability of wheat, maize, sugar beet and potato using MicroLEIS DSS software in Ahar area, North-West of Iran. American-Eurasian J. Agric. Environ. Sci., 5, 45-52.
Shahbazi F., Jafarzadeh A.A., and Shahbazi M.R., 2009b. Agro-ecological field vulnerability evaluation and climate change impacts in Souma area (Iran), using MicroLEIS DSS. Biologia, 64, 555-559.
Thorenthwaite C.W., 1948.An approach toward a rational classi-fication of climate. The Geographic Review, 38, 55-94. USDA,2006.Keys to Soil Taxonomy. IUSS Press, Philadelphia,
PA, USA.