Please cite this article as: F. Ahmad, Q. Khan, A. Alam, Analysis of Flashover Voltages of Disc Type Insulator under Artificial Pollution
International Journal of Engineering
J o u r n a l H o m e p a g e : w w w . i j e . i r
Analysis of Flashover Voltages of Disc Type Insulator under Artificial Pollution
Condition
F. Ahmad*, Q. Khan, A. Alam
Department of Electrical Engineering, AMU Aligarh, India
P A P E R I N F O
Paper history:
Received 10 July 2015
Received in revised form 21 March 2016 Accepted 02 June 2016
Keywords: Surface Conductivity Contaminants
Equivalent Salt Deposit Density Flashover Voltage
Non-soluble Deposit Density pH
A B S T R A C T
Tripping of overhead transmission lines in winter season/fog due to insulation failure has been foremost issue. Huge quantity of overhead insulator in distribution and transmission network make pollution based flashover a vital risk to the uninterrupted and steady power supply. Surface resistivity due to deposition of various environmental contaminants on insulator surface gets low, which initiates flow of high leakage current and leads to flashover around the insulator surface. In this paper, flashover voltage (FOV) analysis of artificially polluted disc insulator carried out. Numerous kind of soluble and non-soluble and their mixture contaminants exist in industrial, marine and desert regions are modeled and analyse insulator characteristics i.e. Equivalent Salt Deposit Density (ESDD), Non-soluble Deposit Density (NSDD), pH, Surface conductivity and ESDD/NSDD. By using FOV and ESDD characteristic an empirical model is proposed to determine the flashover voltage. Comparative study of experimental and calculated values of FOV also carried out.
doi: 10.5829/idosi.ije.2016.29.06c.00
1. INTRODUCTION1
As we all knows the modernization as well as industrialization era is totally depends on the electricity in the view of that, in the last decade electric power’s demand has been rapidly grown in the India, for the example, in the last 10 year during the 2001-2011, the consumption of average energy has increased by 10 times [1]. In forthcoming days the demand for power will upsurge tremendously due to urbanization, and the exponentially growth of industrialization projects. This challenge requires very high voltage transmission lines consist of well design insulators [2]. Insulators are very important components of electrical systems they are the prime reason behind the fault of electrical devices like machine, transmission lines etc. The reliability of the insulations are very much responsible for uninterrupted safe and reliable operation of electrical system [3]. Insulators on High voltage overhead transmission lines fails generally due to: (a) Rise of over voltage due lightning strokes. (b) Switching surges or(c) Abnormal voltage gradients caused by contaminations which deposits on the surface of insulators [2, 4]. The outdoor
1*Corresponding Author’s Email:*[email protected](F. Ahmad)
insulators which are being used in overhead transmission line comes under the influence of contamination and induces flashover, When various type of polymeric insulators installed near to coastal areas, the contaminated salt and airborne particles blow up in air and deposit on the surface of insulator and a thick polluted layer formed [5]. For a better design of the outdoor insulator, it is very important to study and analyze the behavior under naturally polluted wet condition. It is very difficult to obtain satisfactory result by natural way so artificial pollution condition has been created [6, 7]. The outdoor insulator comes under the influence of several types of contaminants depends on locations like coastal area where chloride salts are highly dominant as NaCl, insulators near cement industry where the salt of CaO are more dominant same like near coal plant and many more industries where insulators goes under the influence of different type of salt contaminants. The basic contaminants are Salts, Cement/lime, Dust, Defecation, Chemical, Smog (vehicular emissions), cooling tower effluent, Smoke. CaSO4, 2H20, CaCO3, MgSO4, NaCl, NaNO3, MgCl2, Ca(NO3) and CaCl2, as industrial salts, NaCl, CaCl2, NaNO3, KCl and MgCl2 as marine salts, CaCO3, Fe2O3, Na2SO4, KNO3, MgCO3, CaSO4, KCl & NaCl as dessert
pollutants [8]. The salts as contaminants deposits on the surface of outdoor insulators, such as de-icing streets salt and sidewalks, which increase the chances of flashover [9]. Dry contaminants doesn’t lead the flashover easily, contaminants are highly effective under the wet conditions. When the voltage applied across the insulator whose surface covered with layer of contaminant under wet condition, leakage current of varying magnitude and duration start flowing, which results in heat dissipation. Depending on insulator shape, pollution distribution and the degree of wetness the voltage distribution is differently affected. The highest heating cacti is generally found in the highest stressed region, forming a dry band [10-12]. As the dry band form on the surface of insulators, a spark will generate on further increasing the voltage which break the dry band and will lead to flashover, if Espark is greater than the voltage gradient across the dry band [9]. There are several techniques by which analysis of flashover mechanism under contaminated wet condition by correlating the degree of contamination using POLLUTION SEVERITY INDICATORS can be performed. they are follows:
•Equivalent Salt Deposit Density (ESDD) Method •Non Soluble Salt Deposit Density (NSDD) Method •Leakage Current Method (LCM)
•pH value measurement •conductivity' measurement
•Directional Dust Deposit Gauge (DDG) Method Equivalent salt deposit density (ESDD) define as an equal amount of sodium chloride which, solved in water, will change water's conductivity to the level equal to that resulting from the solution of polluted deposits gathered from insulator surface divided by the insulator's surface area [13], The non-soluble particle of the pollution is denoted as NSDD a term as non-soluble deposit density. Because the Non- soluble particles also cause the influence of the flashover voltage, it would be desirable to take in account during design and selection insulator. ESDD and NSDD both are expressed in terms of mg/cm2 of the insulator surface area [14].
2. EXPERIMENTAL SET-UP AND PROCEDURE
2. 1. Selection of Specimen and Salts Numerous types of insulator which are being used in the industry and electrical utilities and comes under the influence of different pollutants which in presence of wet condition lead to flashover quickly [15]. Disc type insulator is used to analysis the flashover voltages under artificial pollution condition with following specifications:
Height (h) = 146 mm
Diameter (d) = 254 mm
Leakage distance = 280 mm
Upper surface area = 691 cm2
Bottom surface area = 908 cm2
Total surface area (A) =1599 cm2
and following salts as contaminant chosen.
K2SO4 + NaNO3 (Soluble + soluble) K2SO4 + Na2CO3 (Soluble + soluble) K2SO4 + MgCl2 (Soluble + soluble) K2SO4 + CaCO3 (Soluble + non-soluble) K2SO4 + Na2CO3 + MgCl2 + Ca(NO3)2
2. 2. Preparation of Specimen The surface of the specimen insulators surface washed and dried naturally(in sunlight). Each specimen dipped in particular salt solution of different concentration and kept for few hours so as to deposit contaminant all over the surface of insulator.
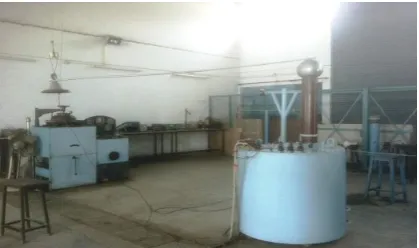
2. 3 Experimental Set-up Experiments setup includes power transformer as in the Figure 1. The supply given through a power transformer by using a conducting rod with one joint at bushing and other connected to the upper portion of insulator, and the lower part of insulator grounded through a ground wire.
3. MEASUREMENT
3. 1. Supply and High Voltage Measurement The results of artificial pollution test are influenced by testing transformer and power source as well as testing method. This has been reported that short circuit current of at least 15A is required for pollution test equipment: our testing equipment has 15 Amp of short Circuit current at maximum excitation. During an artificial contamination test, large leakage current flow frequently. If the drop in the test voltage due to the leakage current is high it is anticipated that the resultant apparent withstand voltage becomes high, thus the testing equipment should be as stiff as possible. To measure the high voltage a testing transformer of 391V/150 KV, I- phase 30KVA was used, which is shown in Figure 2.
We measure the low voltage for which we connect a voltmeter at primary side from where we operate the transformer using a voltage regulator, as shown in Figure 3. In the corresponding of low voltage we obtained high voltage by calibrating with sphere- sphere electrode system whose diameter 25cm (IS:1876-1963)
3. 2. Pressure and Temperature The pressure was measured with the help of a barometer, wet and dry bulb thermometers were used to record temperature in the laboratory, with an accuracy of 0.5 degrees centigrade.
3. 3. Measurement of pH Value To measure the pH value of contaminant we used IQ200 portable pH/mV/Thermometer with the range 0-14.
The contaminant samples were taken by removing the insulator surface deposits with paint fur brush or small sponges.
Then make 100 ml solution and measure pH
3. 4. Conductivity Measurement The conductivity of polluted surface of disc type insulators was measured using HQ30d Portable conductivity meter,
Figure 2. Transformer of 391V/150 KV, I-phase 30 KVA
Figure 3. Voltage regulator at primary side of transformer
which have following specification, Conductivity Accuracy:± 0.5 % from (1µS/cm - 200 mS/cm), Conductivity Measurement Range: 0.01 µS/cm to 200 mS/cm, Conductivity resolution:0.01 µS/cm with 2 digits.
The deposited salt was removed using paint brush/dry scraping.
100m1 of sample solution was prepared using distilled water, and measure conductivity.
3. 5. Flashover Voltage Steps for measurement of Flashover voltage: the suspension insulator string. Complete with its metal parts and accessories in service, was hung vertically from an earthed metal cross-arm whose length is at least 1.5 times that of the insulator string, no other earthed object was nearer to the insulator string axis than 1 meter or 1.5 times the length of the insulator string, whichever is greater.
A length of conductor was secured in the suspension clamp to lie as nearly as possible in a horizontal plane with its axis at 90 degrees to that of the cross arm .The conductor diameter was near to that or the line conductor (10mm). The conductorlength was at least 1.5 times that of the insulator string. (As per IS 731-1963)
To measure the dry power frequency flashover voltage of the specimen insulator, the high voltage from A.C. testing transformer was applied across the insulator and raised till the flashover occurred . Voltage was read from the low voltage side voltmeter and converted to its high voltage side value with the help of calibration curve
Temperature pressure and humidity in the atmosphere, at the time of testing were recorded to take into account the influence of weather condition
To see the variation of the flashover voltage with the concentration of contaminants, flashover test is carried out for one unit of insulator
3. 6. Wet Flashover Test On the above insulator water was sprayed with the help of spray to create artificial fog condition (artificial wetting). The measurement of flashover voltage was carried out in the early morning hours as described in the preceding sections.
3. 7. Pollution Severity on an Insulator Surface
brush with distilled water in the beaker. The conductivity of this sample solution was measured with Conductivity meter.
Equivalent salt quantity in the solution was obtained by the formula. Shown in Equation (1).
)) (1)
Where:
V: volume of distilled water with which the insulator surface was washed (ml), σ :conductivity of the solution prepared after washing the insulator (mS/cm) and Tw: environment temperature (wet) during flashover test of insulator (0C )
The concentration of the above contaminant was varied to have a different salt deposit density. The flashover test for this new value of ESDD was done while following the above procedure.
The insulators were contaminated with a different contaminant and all the steps described above were repeated. The NSDD can be calculated using the Formula shown in Equation (2).
) (2)
where, Wf, is the wt. of pollutant with filter paper Under dry conditions in milligrams
Wi, is the Initial wt. of filter paper under dry condition in milligrams FOV (KV).
A is the surface area of the insulator in cm2 [13, 16].
4. EMPIRICAL MODEL
The effect of various salts contaminants on the behaviour of flashover has been summariesed in Figure 4.
Figure 4. Summariesedcharacteristic of FOV with ESDD for
various contaminants deposited on surface of insulator.
On the basis of combined result in the terms of ESDD a empirical model is proposed to find out the behaviour of various contaminants, as shown in Equation (3). Where A is constant coefficients depends upon material of insulator while B is exponential coefficients depends upon shape and profile of insulating materials. By using graph theory the value of A and B has been determined.
) (3)
A = 35.398, B = 0.183
The Flashover voltages calculated by empirical model has been shown in Table 1. The comparative study of calculated and experimental results also carried out and the % change in flashover has been tabulated in Table 1.
TABLE 1. Error
ESDD
(mg/cm2)
FOV (kV) Experiment
FOV (kV) Calculated
% Change in FOV
0.057 60 59.121 1.464
0.078 57 55.823 2.064
0.094 55 53.949 1.910
0.109 54 52.507 2.764
0.050 64 60.555 5.381
0.062 61 58.218 4.559
0.072 59 56.646 3.988
0.084 58 55.071 5.049
0.050 61 60.555 0.728
0.060 59 58.568 0.730
0.069 57 57.089 -0.157
0.077 56 55.955 0.080
0.051 62 60.336 2.682
0.062 58 58.218 -0.376
0.068 56 57.242 -2.218
0.077 55 55.955 -1.736
0.042 64 62.512 2.313
0.052 60 60.122 -0.204
0.061 56 58.391 -4.271
0.07 55 56.939 -3.526
0.057 60 59.121 1.464
0.078 57 55.823 2.064
0.094 55 53.949 1.910
0.109 54 52.507 2.764
0.050 64 60.555 5.381
0.062 61 58.218 4.559
0.068 56 57.242 -2.218
0.077 55 55.955 -1.736
0.042 64 62.519 2.313
0.052 60 60.122 -0.204
0.061 56 58.391 -4.271
0.070 55 56.939 -3.526
50 52 54 56 58 60 62 64 66
0.04 0.06 0.08 0.1
FO
Vca
l (
(kV
)
5. RESULTS AND DISCUSSION
Results of the artificial pollution testing are shown in the observation table, ESDD values are also shown in the Tables 2 to 6. To analyze the performance of porcelain disc type insulators under artificially polluted conditions, the graphs between various parameters such as ESDD Vs FOV, NSDD Vs FOV, ESDD/NSDD Vs FOV and pH Vs FOV are drawn. Shown in Figures 5,6 and 7. It is noted from the experimental result that ESDD increases with salt concentration. It is also clear from the observations that to increase in conductivity of the contaminants by increasing its concentration, the ESDD will also increase.
TABLE 2.K2SO4 + NaNO3 as Contaminant at Temperature
23 0C and Pressure 74.5 mm of hg
Conc Fov Dry
(kV)
Fov Wet (kV)
Conductivity (ms/cm)
ESDD
(mg/cm2) pH
20 100 60 1.77 0.057 7.61
40 98 57 2.41 0.078 7.58
30 98 55 2.91 0.094 7.54
50 96 54 3.38 0.109 7.51
TABLE 3. K2SO4+ Na2CO3 as Contaminant at Temperature
23 0C and Pressure 74.5 mm of hg
Conc Fov Dry
(kV)
Fov Wet (kV)
Conductivity (ms/cm)
ESDD
(mg/cm2) pH
20 100 64 1.59 0.05 8.41
40 99 61 1.94 0.062 8.49
30 98 59 2.25 0.072 8.54
50 98 58 2.63 0.084 8.59
TABLE 4.K2SO4 +MgCl2 as Contaminant at Temperature 26
0
C and Pressure 74.3 mm of hg
Conc Fov Dry
(kV)
Fov Wet (kV)
Conductivity (ms/cm)
ESDD
(mg/cm2) pH
20 97 61 1.65 0.05 7.33
40 95 59 1.96 0.06 7.3
30 96 57 2.28 0.069 7.27
50 95 56 2.52 0.077 7.25
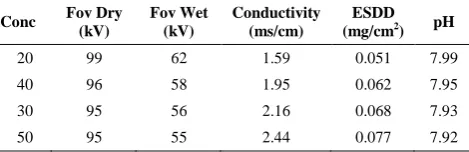
TABLE 5. K2SO4 +Na2CO3 +MgCl2 + Ca(NO3)2 as
Contaminant at Temperature 24 0C and Pressure 74.4 mm of hg
Conc Fov Dry
(kV)
Fov Wet (kV)
Conductivity (ms/cm)
ESDD
(mg/cm2) pH
20 99 62 1.59 0.051 7.99
40 96 58 1.95 0.062 7.95
30 95 56 2.16 0.068 7.93
50 95 55 2.44 0.077 7.92
TABLE 6. K2SO4+CaCO3 as Contaminant at 22 0C and
Pressure 74.6 mm of hg
Conc Fov Dry
(kV)
Fov Wet (kV)
Conducti vity (mS/cm)
NSDD (mg/ cm2)
ESDD
(mg/cm2) pH
20 98 64 1.29 0.08 0.042 7.85
40 100 60 1.61 0.13 0.052 7.93
30 94 56 1.9 0.24 0.061 8
50 92 55 2.21 0.3 5 0.07 8.05
When the concentration of the soluble salts in the contamination solution is increased, the mobility of charged particle or ions in the solution increases due to which the conductivity of the solution increases and hence the ESDD will increase which will cause decrease in flashover voltage, shown in Figure 5.
The flashover voltage, under wet condition will reduce from that of the dry flashover voltage. Decrease in flashover voltage is remarkably high for higher ESDD values.
The decrease in flashover voltage under wet condition is due to fact that a large leakage current flows through the surface of the insulator which ultimately leads to flashover voltage at much lower voltage.
In case of non-soluble substance also, the flashover voltage under wet condition is considerably reduced from that of the dry flashover voltage. This is due to moisture retaining capacity of the non-soluble substance. The flashover voltage also varies with the type of inert material due to different particle size.
ESDD/NSDD versus FOV curve for various composition of salts shown that FOV decreases with increases in the value of ESDD/NSDD shown in Figure 6. This is because the effect of NSDD on the flashover voltages is less in comparison to ESDD because the number of charge particles available for migration are less in case of NSDD due to which the conductivity of NSDD is less than ESDD and therefore the flashover is less affected by NSDD than that of ESDD for the same quantity of salt.
From the pH versus FOV curve it clear that slightly change in pH cause change in FOV shown in Figure 7. Variation with pH may be used as a Diagnostic test for condition monitoring to develop a maintenance schedule as soon as pH of salts contaminant exceeds predetermined value.
Figure 4. Characteristic of FOV with ESDD of various soluble contaminants, 1,2,3 and 4 referred for Tables 2,3 4 and 5.
Figure 5. Characteristic of FOV with ESDD, NSDD and
ESDD/NSDD for K2SO4 + CaCO3 as contaminant.
Figure 6. Characteristic of FOV with pH of contaminants
deposited on surface of insulator. 1,2,3,4 and 5 referred for Tables 2,3 4,5 and 6.
5. CONCLUSION
Various types of indicator pollution severity have been identified such ESDD, NSDD, conductivity and pH. In addition to this indicator, proper chemical analysis needs to be done to reline the electrical characteristics of insulator to chemical parameters identified.
From the foregoing discussion and study of polluted insulator, it may be concluded that the insulator flashover under contaminated condition occurs when the contaminants on the insulator surface resistivity gets low, flashover voltage of polluted insulators depend on the kind and quantity of contaminants. Accordingly, both chemical analysis of contaminants and measurement of contaminant quantity are necessary from the view point of design and maintenance of insulator under contaminated condition.
There are different chemical factors which includes (Size of atom mobility of the hydrated ions, Weight of the ions. Solubility, pH of the salt, Hydration and Lattice energy of the salt, structure of crystal) influences the flashover voltage. Out of these various factors solubility, mobility, size and weight of ions are the main factors which play an important role in deciding flashover voltage of contaminated insulators.
After going through the chemical effects of various salts of alkaline earth metals and observing their flashover voltage for dry and wet condition. We conclude that chloride and nitrates which are soluble in water affects the flashover voltage drastically. Thus continuous monitoring of ESDD may be used as condition monitoring and preventive maintenance schedule.
Variation with pH may be used as a Diagnostic test for condition monitoring to develop a maintenance schedule
Empirical models for prediction of FOV are very useful it reduces the time of experimental process and also it can used as Protection parameter by providing the signal for maintenances.
6. REFERENCES
1. Nailwal, B. and Singh, S., "Reliability measures and sensitivity analysis of a complex matrix system including power failure",
International Journal of Engineering-Transactions A: Basics,
Vol. 25, No. 2, (2012), 115-130.
2. Zedan, F. and Akabar, M., "Performance of hv transmission line insulators in desert conditions. Iv. Study of insulators at a semicoastal site in the eastern region of saudi arabia", Power Delivery, IEEE Transactions on, Vol. 6, No. 1, (1991), 439-447.
3. Jain, M., Maheshwari, R. and Maheshwari, S., "Reliability analysis of redundant repairable system with degraded failure", 52
54 56 58 60 62 64 66
0.04 0.05 0.06 0.07 0.08 0.09 0.1 0.11 0.12
FO
V
(
kV
)
ESDD (mg/cm2)
1 2 3 4
54 55 56 57 58 59 60 61 62 63 64 65
0.04 0.14 0.24 0.34 0.44 0.54
FO
V
(
kV
)
ESDD (mg/cm2)
ESDD
NSDD
ESDD/NSDD
52 54 56 58 60 62 64 66
7 7.25 7.5 7.75 8 8.25 8.5 8.75
FO
V
(
kV
)
pH scale
International Journal of Engineering-Transactions B:
Applications, Vol. 17, No. 2, (2004), 171-182.
4. Mcelroy, A.J., Lyon, W.J., Phelps, J.D. and Woodson, H.H., "Insulators with contaminated surfaces, part i: Field conditions and their laboratory simulation", Power Apparatus and Systems,
IEEE Transactions on, Vol., No. 8, (1970), 1848-1858.
5. Narayanan, V.J., Chandrasekar, S. and Vanitha, A., "Analysis of surface condition of polymeric insulators for high voltage power transmission line applications using partial discharge analysis", Vol.4, No. 7, (2014), 31-40.
6. Geneoglu, M. and Cebeei, M., "Investigation of pollution flashover on high voltage insulators using artificial neural network", Expert Systems with Applications, Vol. 36, No. 4, (2009), 7338- 7345.
7. An, L., Jiang, X. and Han, Z., "Measurements of equivalent salt deposit density (esdd) on a suspension insulator", Dielectrics
and Electrical Insulation, IEEE Transactions on, Vol. 9, No.
4, (2002), 562-568.
8. Farzaneh, M. and Kiernicki, J., "Flashover performance of ieee standard insulators under ice conditions", Power Delivery, IEEE
Transactions on, Vol. 12, No. 4, (1997), 1602-1613.
9. Gorur, R.S. and Olsen, R., "Prediction of flashover voltage of insulators using low voltage surface resistance measurement",
Power System Engineering Research Center, Final Project
Report, Arizona State University, (2006), 154-163.
10. Karady, G.G., Amarh, F. and Sundararajan, R., "Dynamic modeling of ac insulator flashover characteristics", in High Voltage Engineering, 1999. Eleventh International Symposium on (Conf. Publ. No. 467), IET. Vol. 4, No. Issue, (1999), 107-110.
11. Karady, G.G. and Amarh, F., "Signature analysis for leakage current waveforms of polluted insulators", in Transmission and Distribution Conference, 1999 IEEE, IEEE. Vol. 2, (1999), 806-811.
12. Karady, G., Amarh, F. and Reta, M., "Enhanced methods for transformer failure investigation", in 3rd International Association Of Science and Technology for Development Conference, Las Vegas. (1999), 370-374.
13. Mohammad, S., Nabavi, H., Gholami, A., Kazemi, A., Ali, M. and Masoum, S., "Evaluation of leakage current measurement for site pollution severity assessment", (2004).
14. Sundararajan, R. and Gorur, S., "Role of non-soluble contaminants on the flashover voltage of porcelain insulators",
Dielectrics and Electrical Insulation, IEEE Transactions on, Vol. 3, No. 1, (1996), 113-118.
15. Oloomi Buygi, M. and Modir Shanehchi, M.H., "Transmission planning in deregulated environments", International Journal
of Engineering, Vol. 15, (2002).
16. R., S., "Annex a: Measurement of esdd and nsdd, Published as 36-WG11/Milan/102, (2001).
Analysis of Flashover Voltages of Disc Type Insulator under Artificial
Pollution Condition
TECHNICAL NOTE
F. Ahmad*, Q. Khan, A. Alam
Department of Electrical Engineering, AMU Aligarh, India
P A P E R I N F O
Paper history:
Received 10 July 2015
Received in revised form 21 March 2016 Accepted 02 June 2016
Keywords: Surface Conductivity Contaminants
Equivalent Salt Deposit Density Flashover Voltage
Non-soluble Deposit Density pH
ديكچ ه