A Monthly Double-Blind Peer Reviewed (Refereed/Juried) Open Access International e-Journal - Included in the International Serial Directories Indexed & Listed at:
Ulrich's Periodicals Directory ©, ProQuest, U.S.A., EBSCO Publishing, U.S.A., Cabell’s Directories of Publishing Opportunities, U.S.A., Open J-Gage, India [link of the same is duly available at Inflibnet of University Grants Commission (U.G.C.)],
VOLUME NO.2(2012),ISSUE NO.11(NOVEMBER) ISSN2231-5756
CONTENTS
CONTENTS
CONTENTS
CONTENTS
Sr.No.
TITLE & NAME OF THE AUTHOR (S)
Page No. 1. SIGNIFICANCE OF COST MANAGEMENT TECHNIQUES IN DECISION MAKING: AN EMPIRICAL STUDY ON ETHIOPIAN MANUFACTURING
PRIVATE LIMITED COMPANIES (PLCs) DR. FISSEHA GIRMAY TESSEMA
1
2. TECHNICAL EFFICIENCY ANALYSIS AND INFLUENCE OF SUBSIDIES ON THE TECHNICAL EFFICIENCY OF FARMS IN THE SLOVAK REPUBLIC DR. ING. ANDREJ JAHNÁTEK, DR. ING. JANA MIKLOVIČOVÁ & ING. SILVIA MIKLOVIČOVÁ
10
3. A COMPARISON OF DATA MINING TECHNIQUES FOR GOING CONCERN PREDICTION FEZEH ZAHEDI FARD & MAHDI SALEHI
14
4. DETERMINANTS OF CONSTRAINTS TO LOW PROVISION OF LIVESTOCK INSURANCE IN KENYA: A CASE STUDY OF NAKURU COUNTY THOMAS MOCHOGE MOTINDI, NEBAT GALO MUGENDA & HENRY KIMATHI MUKARIA
20
5. PERCEPTIONS OF ACCOUNTANTS ON FACTORS AFFECTING AUDITOR’S INDEPENDENCE IN NIGERIA AKINYOMI OLADELE JOHN & TASIE, CHUKWUMERIJE
25
6. AN ASSESSMENT OF MARKET SUSTAINABILITY OF PRIVATE SECTOR HOUSING PROJECT FINANCING OPTIONS IN NIGERIA I.S. YESUFU, O.I. BEJIDE, F.E. UWADIA & S.I. YESUFU
30
7. AN EXPLORATORY STUDY ON THE PERCEPTION OF CUSTOMERS TOWARDS THE ROLE OF MOBILE BANKING, AND ITS EFFECT ON QUALITY OF SERVICE DELIVERY, IN THE RWANDAN BANKING INDUSTRY
MACHOGU MORONGE ABIUD, LYNET OKIKO & VICTORIA KADONDI
35
8. BUSINESS PROCESS REENGINEERING AND ORGANIZATIONAL PERFORMANCE C. S. RAMANIGOPAL, G. PALANIAPPAN, N.HEMALATHA & M. MANICKAM
41
9. CUSTOMER PERCEPTION OF REAL ESTATE SECTOR IN INDIA: A CASE STUDY OF UNORGANISED PROPERTY ADVISORS IN PUNJAB-INDIA DR. JASKARAN SINGH DHILLON & B. J. S. LUBANA
46
10. INNOVATIVE TECHNOLOGY AND PRIVATE SECTOR BANKS: A STUDY OF SELECTED PRIVATE SECTOR BANKS OF ANAND DISTRICT POOJARA J.G. & CHRISTIAN S.R.
51
11. THE PROBLEMS AND PERFORMANCE OF HANDLOOM COOPERATIVE SOCIETIES WITH REFERENCE TO ANDHRA PRADESH INDIA DR. R. EMMANIEL
54
12. IMPACT OF GENDER AND TASK CONDITIONS ON TEAMS: A STUDY OF INDIAN PROFESSIONALS DEEPIKA TIWARI & AJEYA JHA
58
13. MOTIVATIONAL PREFERENCES OF TEACHERS WORKING IN PRIVATE ENGINEERING INSTITUTIONS IN WESTERN INDIA REGION: AN EXPLORATORY STUDY
DD MUNDHRA & WALLACE JACOB
68
14. CHANNEL MANAGEMENT IN INSURANCE BUSINESS DR. C BHANU KIRAN & DR. M. MUTYALU NAIDU
74
15. MANAGEMENT INFORMATION SYSTEM APPLIED TO MECHANICAL DEPARTMENT OF AN ENGINEERING COLLEGE C.G. RAMACHANDRA & DR. T. R. SRINIVAS
78
16. A STUDY ON THE PERCEPTIONS OF EMPLOYEES ON LEADERSHIP CONCEPTS AND CONSTRUCTS IN LIC H. HEMA LAKSHMI, P. R. SIVASANKAR & DASARI.PANDURANGARAO
83
17. TEXTURE FEATURE EXTRACTION
GANESH S. RAGHTATE & DR. S. S. SALANKAR
87
18. INDIAN BANKS: AN IMMENSE DEVELOPING SECTOR PRASHANT VIJAYSING PATIL & DR. DEVENDRASING V. THAKOR
91
19. DEVALUATION OF INDIAN RUPEE & ITS IMPACT ON INDIAN ECONOMY DR. NARENDRA KUMAR BATRA, DHEERAJ GANDHI & BHARAT KUMAR
95
20. SERVICE PRODUCTIVITY: CONCERNS, CHALLENGES, AND RESEARCH DIRECTIONS DR. SUNIL C. D’SOUZA
99
21. A STUDY OF THE MANAGERIAL STYLES OF EXECUTIVES IN THE MANUFACTURING COMPANIES OF PUNJAB DR. NAVPREET SINGH SIDHU
105
22. FINANCIAL LEVERAGE AND IT’S IMPACT ON COST OF CAPITAL AND CAPITAL STRUCTURE SHASHANK JAIN, SHIVANGI GUPTA & HAMENDRA KUMAR PORWAL
112
23. REACH OF INTERNET BANKING DR. A. JAYAKUMAR & G.ANBALAGAN.
118
24. THE PROPOSED GOODS AND SERVICE TAX REGIME: AN ANALYSIS OF THE DIFFERENT MODELS TO SELECT A SUITABLE MODEL FOR INDIA ASHISH TIWARI & VINAYAK GUPTA
122
25. ESTIMATION OF STOCK OPTION PRICES USING BLACK-SCHOLES MODEL DR. S. SARAVANAN & G. PRADEEP KUMAR
130
26. MIS AND MANAGEMENT
DR.PULI.SUBRMANYAM & S.ISMAIL BASHA
137
27. REFORMS IN INDIAN FINANCIAL SYSTEM: A CONCEPTUAL APPROACH PRAVEEN KUMAR SINHA
147
28. NATURAL RUBBER PRODUCTION IN INDIA DR. P. CHENNAKRISHNAN
151
29. QUALITY IMPROVEMENT IN FREE AND OPEN SOURCE SOFTWARE PROJECTS DR. SHAIK MAHABOOB BASHA
157
30. ICT & PRODUCTIVITY AND GROWTH BUSINESS: NEW RESULTS BASED ON INTERNATIONAL MICRODATA VAHID RANGRIZ
160
CHIEF PATRON
CHIEF PATRON
CHIEF PATRON
CHIEF PATRON
PROF. K. K. AGGARWAL
Chancellor, Lingaya’s University, Delhi
Founder Vice-Chancellor, Guru Gobind Singh Indraprastha University, Delhi
Ex. Pro Vice-Chancellor, Guru Jambheshwar University, Hisar
FOUNDER
FOUNDER
FOUNDER
FOUNDER PATRON
PATRON
PATRON
PATRON
LATE SH. RAM BHAJAN AGGARWAL
Former State Minister for Home & Tourism, Government of Haryana
Former Vice-President, Dadri Education Society, Charkhi Dadri
Former President, Chinar Syntex Ltd. (Textile Mills), Bhiwani
CO
CO
CO
CO----ORDINATOR
ORDINATOR
ORDINATOR
ORDINATOR
AMITA
Faculty, Government M. S., Mohali
ADVISORS
ADVISORS
ADVISORS
ADVISORS
DR. PRIYA RANJAN TRIVEDI
Chancellor, The Global Open University, Nagaland
PROF. M. S. SENAM RAJU
Director A. C. D., School of Management Studies, I.G.N.O.U., New Delhi
PROF. M. N. SHARMA
Chairman, M.B.A., Haryana College of Technology & Management, Kaithal
PROF. S. L. MAHANDRU
Principal (Retd.), Maharaja Agrasen College, Jagadhri
EDITOR
EDITOR
EDITOR
EDITOR
PROF. R. K. SHARMA
Professor, Bharti Vidyapeeth University Institute of Management & Research, New Delhi
CO
CO
CO
CO----EDITOR
EDITOR
EDITOR
EDITOR
DR. BHAVET
Faculty, M. M. Institute of Management, Maharishi Markandeshwar University, Mullana, Ambala, Haryana
EDITORIAL
EDITORIAL
EDITORIAL
EDITORIAL ADVISORY BOARD
ADVISORY BOARD
ADVISORY BOARD
ADVISORY BOARD
DR. RAJESH MODI
Faculty, Yanbu Industrial College, Kingdom of Saudi Arabia
PROF. SANJIV MITTAL
University School of Management Studies, Guru Gobind Singh I. P. University, Delhi
PROF. ANIL K. SAINI
Chairperson (CRC), Guru Gobind Singh I. P. University, Delhi
DR. SAMBHAVNA
Faculty, I.I.T.M., Delhi
DR. MOHENDER KUMAR GUPTA
VOLUME NO.2(2012),ISSUE NO.11(NOVEMBER) ISSN2231-5756
DR. SHIVAKUMAR DEENE
Asst. Professor, Dept. of Commerce, School of Business Studies, Central University of Karnataka, Gulbarga
DR. MOHITA
Faculty, Yamuna Institute of Engineering & Technology, Village Gadholi, P. O. Gadhola, Yamunanagar
ASSOCIATE EDITORS
ASSOCIATE EDITORS
ASSOCIATE EDITORS
ASSOCIATE EDITORS
PROF. NAWAB ALI KHAN
Department of Commerce, Aligarh Muslim University, Aligarh, U.P.
PROF. ABHAY BANSAL
Head, Department of Information Technology, Amity School of Engineering & Technology, Amity University, Noida
PROF. A. SURYANARAYANA
Department of Business Management, Osmania University, Hyderabad
DR. SAMBHAV GARG
Faculty, M. M. Institute of Management, Maharishi Markandeshwar University, Mullana, Ambala, Haryana
PROF. V. SELVAM
SSL, VIT University, Vellore
DR. PARDEEP AHLAWAT
Associate Professor, Institute of Management Studies & Research, Maharshi Dayanand University, Rohtak
DR. S. TABASSUM SULTANA
Associate Professor, Department of Business Management, Matrusri Institute of P.G. Studies, Hyderabad
SURJEET SINGH
Asst. Professor, Department of Computer Science, G. M. N. (P.G.) College, Ambala Cantt.
TECHNICAL ADVISOR
TECHNICAL ADVISOR
TECHNICAL ADVISOR
TECHNICAL ADVISOR
AMITA
Faculty, Government H. S., Mohali
DR. MOHITA
Faculty, Yamuna Institute of Engineering & Technology, Village Gadholi, P. O. Gadhola, Yamunanagar
FINANCIAL ADVISORS
FINANCIAL ADVISORS
FINANCIAL ADVISORS
FINANCIAL ADVISORS
DICKIN GOYAL
Advocate & Tax Adviser, Panchkula
NEENA
Investment Consultant, Chambaghat, Solan, Himachal Pradesh
LEGAL
LEGAL
LEGAL
LEGAL ADVISORS
ADVISORS
ADVISORS
ADVISORS
JITENDER S. CHAHAL
Advocate, Punjab & Haryana High Court, Chandigarh U.T.
CHANDER BHUSHAN SHARMA
Advocate & Consultant, District Courts, Yamunanagar at Jagadhri
SUPERINTENDENT
SUPERINTENDENT
SUPERINTENDENT
SUPERINTENDENT
SURENDER KUMAR POONIA
CALL FOR MANUSCRIPTS
CALL FOR MANUSCRIPTS
CALL FOR MANUSCRIPTS
CALL FOR MANUSCRIPTS
Weinvite unpublished novel, original, empirical and high quality research work pertaining to recent developments & practices in the area of Computer, Business, Finance, Marketing, Human Resource Management, General Management, Banking, Insurance, Corporate Governance and emerging paradigms in allied subjects like Accounting Education; Accounting Information Systems; Accounting Theory & Practice; Auditing; Behavioral Accounting; Behavioral Economics; Corporate Finance; Cost Accounting; Econometrics; Economic Development; Economic History; Financial Institutions & Markets; Financial Services; Fiscal Policy; Government & Non Profit Accounting; Industrial Organization; International Economics & Trade; International Finance; Macro Economics; Micro Economics; Monetary Policy; Portfolio & Security Analysis; Public Policy Economics; Real Estate; Regional Economics; Tax Accounting; Advertising & Promotion Management; Business Education; Management Information Systems (MIS); Business Law, Public Responsibility & Ethics; Communication; Direct Marketing; E-Commerce; Global Business; Health Care Administration; Labor Relations & Human Resource Management; Marketing Research; Marketing Theory & Applications; Non-Profit Organizations; Office Administration/Management; Operations Research/Statistics; Organizational Behavior & Theory; Organizational Development; Production/Operations; Public Administration; Purchasing/Materials Management; Retailing; Sales/Selling; Services; Small Business Entrepreneurship; Strategic Management Policy; Technology/Innovation; Tourism, Hospitality & Leisure; Transportation/Physical Distribution; Algorithms; Artificial Intelligence; Compilers & Translation; Computer Aided Design (CAD); Computer Aided Manufacturing; Computer Graphics; Computer Organization & Architecture; Database Structures & Systems; Digital Logic; Discrete Structures; Internet; Management Information Systems; Modeling & Simulation; Multimedia; Neural Systems/Neural Networks; Numerical Analysis/Scientific Computing; Object Oriented Programming; Operating Systems; Programming Languages; Robotics; Symbolic & Formal Logic and Web Design. The above mentioned tracks are only indicative, and not exhaustive.
Anybody can submit the soft copy of his/her manuscript anytime in M.S. Word format after preparing the same as per our submission guidelines duly available on our website under the heading guidelines for submission, at the email address: [email protected].
GUIDELINES FOR SUBM
GUIDELINES FOR SUBM
GUIDELINES FOR SUBM
GUIDELINES FOR SUBMISSION OF MANUSCRIPT
ISSION OF MANUSCRIPT
ISSION OF MANUSCRIPT
ISSION OF MANUSCRIPT
1. COVERING LETTER FOR SUBMISSION:
DATED: _____________ THE EDITOR
IJRCM
Subject: SUBMISSION OF MANUSCRIPT IN THE AREA OF .
(e.g. Finance/Marketing/HRM/General Management/Economics/Psychology/Law/Computer/IT/Engineering/Mathematics/other, please specify)
DEAR SIR/MADAM
Please find my submission of manuscript entitled ‘___________________________________________’ for possible publication in your journals.
I hereby affirm that the contents of this manuscript are original. Furthermore, it has neither been published elsewhere in any language fully or partly, nor is it under review for publication elsewhere.
I affirm that all the author (s) have seen and agreed to the submitted version of the manuscript and their inclusion of name (s) as co-author (s).
Also, if my/our manuscript is accepted, I/We agree to comply with the formalities as given on the website of the journal & you are free to publish our contribution in any of your journals.
NAME OF CORRESPONDING AUTHOR: Designation:
Affiliation with full address, contact numbers & Pin Code: Residential address with Pin Code:
Mobile Number (s): Landline Number (s): E-mail Address: Alternate E-mail Address:
NOTES:
a) The whole manuscript is required to be in ONE MS WORD FILE only (pdf. version is liable to be rejected without any consideration), which will start from
the covering letter, inside the manuscript.
b) The sender is required to mention the following in the SUBJECT COLUMN of the mail:
New Manuscript for Review in the area of (Finance/Marketing/HRM/General Management/Economics/Psychology/Law/Computer/IT/ Engineering/Mathematics/other, please specify)
c) There is no need to give any text in the body of mail, except the cases where the author wishes to give any specific message w.r.t. to the manuscript. d) The total size of the file containing the manuscript is required to be below 500 KB.
e) Abstract alone will not be considered for review, and the author is required to submit the complete manuscript in the first instance.
f) The journal gives acknowledgement w.r.t. the receipt of every email and in case of non-receipt of acknowledgment from the journal, w.r.t. the submission
of manuscript, within two days of submission, the corresponding author is required to demand for the same by sending separate mail to the journal.
2. MANUSCRIPT TITLE: The title of the paper should be in a 12 point Calibri Font. It should be bold typed, centered and fully capitalised.
3. AUTHOR NAME (S) & AFFILIATIONS: The author (s) full name, designation, affiliation (s), address, mobile/landline numbers, and email/alternate email address should be in italic & 11-point Calibri Font. It must be centered underneath the title.
VOLUME NO.2(2012),ISSUE NO.11(NOVEMBER) ISSN2231-5756
5. KEYWORDS: Abstract must be followed by a list of keywords, subject to the maximum of five. These should be arranged in alphabetic order separated by commas and full stops at the end.
6. MANUSCRIPT: Manuscript must be in BRITISH ENGLISH prepared on a standard A4 size PORTRAIT SETTING PAPER. It must be prepared on a single space and single column with 1” margin set for top, bottom, left and right. It should be typed in 8 point Calibri Font with page numbers at the bottom and centre of every page. It should be free from grammatical, spelling and punctuation errors and must be thoroughly edited.
7. HEADINGS: All the headings should be in a 10 point Calibri Font. These must be bold-faced, aligned left and fully capitalised. Leave a blank line before each heading.
8. SUB-HEADINGS: All the sub-headings should be in a 8 point Calibri Font. These must be bold-faced, aligned left and fully capitalised.
9. MAIN TEXT: The main text should follow the following sequence:
INTRODUCTION
REVIEW OF LITERATURE
NEED/IMPORTANCE OF THE STUDY
STATEMENT OF THE PROBLEM
OBJECTIVES
HYPOTHESES
RESEARCH METHODOLOGY
RESULTS & DISCUSSION
FINDINGS
RECOMMENDATIONS/SUGGESTIONS
CONCLUSIONS
SCOPE FOR FURTHER RESEARCH
ACKNOWLEDGMENTS
REFERENCES
APPENDIX/ANNEXURE
It should be in a 8 point Calibri Font, single spaced and justified. The manuscript should preferably not exceed 5000 WORDS.
10. FIGURES & TABLES: These should be simple, crystal clear, centered, separately numbered & self explained, and titles must be above the table/figure. Sources of data should be mentioned below the table/figure. It should be ensured that the tables/figures are referred to from the main text.
11. EQUATIONS: These should be consecutively numbered in parentheses, horizontally centered with equation number placed at the right.
12. REFERENCES: The list of all references should be alphabetically arranged. The author (s) should mention only the actually utilised references in the preparation of manuscript and they are supposed to follow Harvard Style of Referencing. The author (s) are supposed to follow the references as per the following:
•
All works cited in the text (including sources for tables and figures) should be listed alphabetically.•
Use (ed.) for one editor, and (ed.s) for multiple editors.•
When listing two or more works by one author, use --- (20xx), such as after Kohl (1997), use --- (2001), etc, in chronologically ascending order.•
Indicate (opening and closing) page numbers for articles in journals and for chapters in books.•
The title of books and journals should be in italics. Double quotation marks are used for titles of journal articles, book chapters, dissertations, reports, workingpapers, unpublished material, etc.
•
For titles in a language other than English, provide an English translation in parentheses.•
The location of endnotes within the text should be indicated by superscript numbers.PLEASE USE THE FOLLOWING FOR STYLE AND PUNCTUATION IN REFERENCES: BOOKS
•
Bowersox, Donald J., Closs, David J., (1996), "Logistical Management." Tata McGraw, Hill, New Delhi.•
Hunker, H.L. and A.J. Wright (1963), "Factors of Industrial Location in Ohio" Ohio State University, Nigeria. CONTRIBUTIONS TO BOOKS•
Sharma T., Kwatra, G. (2008) Effectiveness of Social Advertising: A Study of Selected Campaigns, Corporate Social Responsibility, Edited by David Crowther &Nicholas Capaldi, Ashgate Research Companion to Corporate Social Responsibility, Chapter 15, pp 287-303. JOURNAL AND OTHER ARTICLES
•
Schemenner, R.W., Huber, J.C. and Cook, R.L. (1987), "Geographic Differences and the Location of New Manufacturing Facilities," Journal of Urban Economics,Vol. 21, No. 1, pp. 83-104. CONFERENCE PAPERS
•
Garg, Sambhav (2011): "Business Ethics" Paper presented at the Annual International Conference for the All India Management Association, New Delhi, India,19–22 June.
UNPUBLISHED DISSERTATIONS AND THESES
•
Kumar S. (2011): "Customer Value: A Comparative Study of Rural and Urban Customers," Thesis, Kurukshetra University, Kurukshetra.ONLINE RESOURCES
•
Always indicate the date that the source was accessed, as online resources are frequently updated or removed.WEBSITES
TECHNICAL EFFICIENCY ANALYSIS AND INFLUENCE OF SUBSIDIES ON THE TECHNICAL EFFICIENCY OF
FARMS IN THE SLOVAK REPUBLIC
DR. ING. ANDREJ JAHNÁTEK
EXTERNAL WORKER OF SUA
DEPARTMENT OF ECONOMICS
FACULTY OF ECONOMICS & MANAGEMENT
SLOVAK UNIVERSITY OF AGRICULTURE
SLOVAKIA
DR. ING. JANA MIKLOVIČOVÁ
ASST. PROFESSOR
DEPARTMENT OF ECONOMICS
FACULTY OF ECONOMICS & MANAGEMENT
SLOVAK UNIVERSITY OF AGRICULTURE
SLOVAKIA
ING. SILVIA MIKLOVIČOVÁ
STUDENT
DEPARTMENT OF ECONOMICS
FACULTY OF ECONOMICS & MANAGEMENT
SLOVAK UNIVERSITY OF AGRICULTURE
SLOVAKIA
ABSTRACT
Economic efficiency deals with effective evaluation of alteration of company’s inputs on its outputs. Measurement of economic efficiency and its value is considerable background for competitiveness estimation of a company. In the paper we aimed at the technical efficiency analysis of farms in the Slovak Republic. For an evaluation of economic efficiency were used model of linear programming - DEA (Data Envelopment Analysis). With applied methods we found out a productivity growth of farms. The results show us that subsidies have a considerable influence on productivity and efficiency of farms. In the followed ten year period was shown high variability of followed input efficiency parameters in the agriculture. The growth of productivity was noticed during this period. The most expressive increase of productivity was after the entrance of Slovakia to the European Union when the subsidies increased and the foreign markets were opened without macroeconomic barriers.
KEYWORDS
Economic efficiency, Farms, DEA model, BCC model, CCR model.
JEL CLASSIFICATION
Q12, Q14, D24
INTRODUCTION
n present conditions of increasing globalisation of world economy and by stronger fight for higher share on markets, the companies should keep the most productive agriculture. The agricultural efficiency is influenced by the different natural conditions. The main factors which have impact on the productive process of companies are soil, granularity of land, steep land, depth of land and climate conditions. Other factors which influence the company are political, economic, social, technical and technological conditions and skills and quality of management of company. The ability of companies to be successful is showed in their results of earnings. For objective development evaluation of efficiency is good to know information from environment in which the companies are operating. It is information about financial situation of competitors, requests of financial and credit institutions and economic measures of government and their impact on company activity.
LITERATURE REVIEW
In connection with appraisal of competitiveness and capital resources of Slovak agriculture after the entrance to the European Union was facility of agriculture deficient and stagnated till 2004. Structural changes were not so marked in agricultural primary production to evocate pressure for changes in the structure of fixed capital. (Grznár, Szabo, 2005).
On the basis of the preliminary analysis were changes in the group of commercial companies, which was in 2004 the most widespread legal form of operating in agricultural primary production. Agricultural cooperatives remained dominancy of area and operate on around 50% of agricultural land use. In the group of physical persons continues the increase of subjects and trend of increasing average farm area (Gubová, 2005).
The accession of the Slovak Republic to the European Union influenced operating of the agricultural companies. For the most important thing is considered the change of agrarian policy of Slovakia. In 2004 agriculture reached positive income, which was the highest after 1990. Economy measures, mainly subsidies contributed to this positive result. The value of subsidies was higher as in the years before accession to the European Union (Chrastinová, 2005).
Subsidies for the agriculture are very important and help to reach better income not just for companies but profitability of the commodities branch too. Without subsidies would be the majority of the agricultural producers in loss so in productive areas as in less favoured areas (Kubanková, 2005).
The effect on good results of earning in the branch of agriculture of the Czech Republic had the increasing growth of subsidies. After the first year of the entrance the Czech Republic to the European Union came to the changes in economic and social life. The obvious impact of the entrance Czech Republic to EU was shown in agrarian market and companies earning (Vaňek et col, 2005).
Mathijs (2002) in his studies compared the farm efficiency of different organisation forms of chosen companies from 1998 in Hungary and Bulgaria. The results of Hungarian companies specialized to the crop production showed that the highest average measure of efficiency reached the family farms (58%) then followed
VOLUME NO.2(2012),ISSUE NO.11(NOVEMBER) ISSN2231-5756
commercial companies (50%) and co-operatives (44%). Analogical analyse in Bulgaria presents that the most effective were commercial companies (51%) after followed the family farms (44%) and co-operatives (43%). In the case of milk farms, in Hungary are the most effective family farms (43%), the same percentage of efficiency as family farms reached commercial companies and the lowest level of efficiency reached co-operatives.
Basic efficiency expression of company is presented by many authors as the relation of inputs which companies produce and outputs which are required to be used on transformation in the productive process.
Efficiency is maximizing output per unit from input, agricultural efficiency reflects a complex relationship among factors of production and the exogenous influence of nature (Macauley, 2007)
Total efficiency of company is created from two components: technical efficiency (TE) – it is called as managerial efficiency and allocation efficiency (AE) which is called as efficiency of input usage to their prices. Allocation efficiency or efficiency of input usage shows the company ability to use the inputs in optimal relation to their prices (Farrell, 1957). The company operates on production possibility frontier. From the point of quantitative analyses is needed this argument to correct.
Lissitsa and Balmann (2003) dealt with analyse of technical efficiency in Germany. They compared the efficiency during 1992 – 1995 and found out that big farms with the goal to be effective were restructured on smaller producing units and smaller farms reached better results as big co-operative and companies which during the transformation process were not restructured. From the point of productive program the companies specialized on animal production did not reach very high efficiency with comparing with companies specialized on crop production. The reason of higher efficiency of crop production was because of higher labour productivity and higher investment subsidies as by companies specialized on animal production.
In Slovakia Fandel (2002) compared the efficiency of companies on the base of agricultural land. According to his results found out that in the chosen size groups were quite the same average values of technical efficiency. The efficiency of companies depends on inputs usage to produce outputs and the regulation of inputs is in the competence of company management. The higher technical efficiency reached private farms in comparison with co-operatives. The co-operatives reached higher measure of efficiency of scale but after testing were not detected statistical proved differences between organisation forms of companies. The average efficiency were different but we can`t say expressly which organisation form is the most effective.
Swinnen and Vranken (2005) compared technical efficiency between countries. They compared the efficiency of five countries by aggregate data. On the base of their analyses found out the differences in measures of technical efficiency of companies in country and so differences between countries. Reforms in followed countries have influence on the amount of technical efficiency. Higher measure of technical efficiency was reached by companies in countries with higher level of reforms. In the countries with lower level of reforms were just few effective companies. To the most effective countries belong Slovakia, Czech Republic and Hungary. Albania reached the technical efficiency on the level of 25 %.
Most of literature related to the measurement of economic efficiency has based its analysis either on parametric or on non-parametric frontier methods. The choice of estimation method has been an issue of debate, with some researches prefferint the parametric and other the non-parametric approach (Murillo-Zamorano, 2004).
For following of the economic efficiency development is used non-parametric method DEA (data envelopment analysis). This method was used successfully many times by analysis of similar character. The analysis of efficiency by using of this method appears from the theory of efficiency and productivity (Fandel,
2002).The principle of this methodology is determining of linear convex envelopment which characterize the technology of product producing in the sence of
production economy. The technology is presented as the reference set for estimation of relative efficiency of all products. Technological relation between inputs and outputs can be expressed as linear input transformation set (Debreu, 1951, Koopmans, 1951).
RESEARCH METHODOLOGY
Quantification of technical efficiency is very demanding on company data. The data which are needed for analyse have to be exact and completely for each year and each company. Panel data has to go out from real data. If there is by input or output not standard value e.g. negative or equal to zero this company can`t be analysed. The data we used in this paper we utilised from Research Institute of Agricultural and Food Economics in Slovakia. Total amount of companies was 721 – co-operatives, farmers and commercial companies but after data correction we worked with collection of 490 agricultural companies in Slovakia.
By DEA analysis we used input model which is oriented of inputs by the set point of production. Inputs are: material, number of employers, stocks and not controllable input – tangible fixed assets. Output is revenue. We quantified the technical efficiency (TE) for every company before and after given subsidies with help of Kruskal – Wallis test. We verified if there is statistical arguable change between technical efficiency before and after given subsidies.
RESULTS
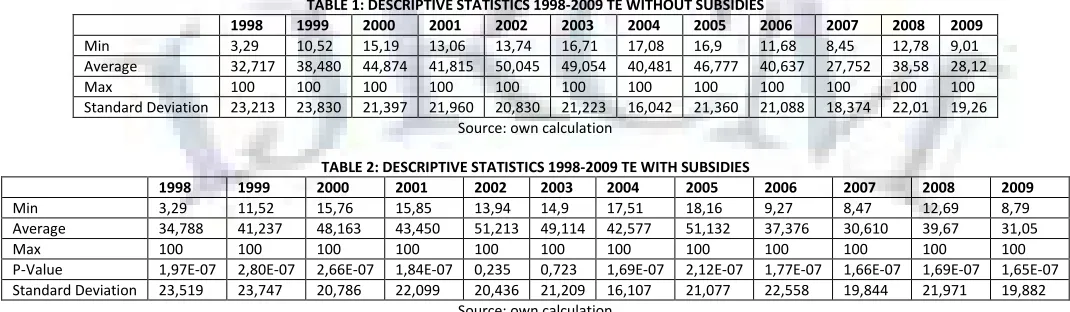
On the base of the results in table 1 and 2 the minimum value of total efficiency did not change either after subsidies in the collection of agricultural companies. The influence of the subsidies increased and the average efficiency was around 2 % what was statistical affirmed from the P-value. In next years of followed period the minimal efficiency increased after subsidies except of 2003 and 2006, when its value decreased about 1.81 % and 2.41 %. These changes are not statistical affirmed on the base of Kruskal-Wallis test. In 2003 farmers was not sure what will bring the entrance of Slovakia to the European Union. In this year the farmers had access to the bank loans because of not favourable natural conditions which followed into the low yield of crop commodities. The average efficiency increased after the subsidies in each year of followed except 2006. In this year the average efficiency decreased about 3,26 %. In 2005 average efficiency of companies was higher because of subsidies and it was about 4,36 %. In this year the farmers received more subsidies which had impact on the average value of efficiency.
TABLE 1: DESCRIPTIVE STATISTICS 1998-2009 TE WITHOUT SUBSIDIES
1998 1999 2000 2001 2002 2003 2004 2005 2006 2007 2008 2009
Min 3,29 10,52 15,19 13,06 13,74 16,71 17,08 16,9 11,68 8,45 12,78 9,01
Average 32,717 38,480 44,874 41,815 50,045 49,054 40,481 46,777 40,637 27,752 38,58 28,12
Max 100 100 100 100 100 100 100 100 100 100 100 100
Standard Deviation 23,213 23,830 21,397 21,960 20,830 21,223 16,042 21,360 21,088 18,374 22,01 19,26
Source: own calculation
TABLE 2: DESCRIPTIVE STATISTICS 1998-2009 TE WITH SUBSIDIES
1998 1999 2000 2001 2002 2003 2004 2005 2006 2007 2008 2009
Min 3,29 11,52 15,76 15,85 13,94 14,9 17,51 18,16 9,27 8,47 12,69 8,79
Average 34,788 41,237 48,163 43,450 51,213 49,114 42,577 51,132 37,376 30,610 39,67 31,05
Max 100 100 100 100 100 100 100 100 100 100 100 100
P-Value 1,97E-07 2,80E-07 2,66E-07 1,84E-07 0,235 0,723 1,69E-07 2,12E-07 1,77E-07 1,66E-07 1,69E-07 1,65E-07
Standard Deviation 23,519 23,747 20,786 22,099 20,436 21,209 16,107 21,077 22,558 19,844 21,971 19,882
Source: own calculation
In 1984 authors Banker, Charnes and Cooper evolved modified model CCR which was marked as BCC model. This model works with variable returns of scale – decreased, increased and constant. By BCC models the canonical form of data is changing on convex what means that models mark higher amount of unit as effective.
By analyse of agricultural companies’ collection we used models CCR and quantified the measure of technical efficiency by the constant returns of scale. If this collection of agricultural companies would be evaluated by BCC model on the level of variable returns of scale we detected that all companies which are effective by constant returns of scale are effective too by variable returns of scale. Other way around it is not valid. On the level of variable returns of scale are effective that companies too which transform the inputs on outputs but their size is not optimal.
To quantify if the company is effective according to the size we have to count the efficiency of scale on the base of relation of technical efficiency by the conditions of constant returns of scale and technical efficiency by the conditions of variable returns of scale. If this relation is equal to one then the size of company is optimal.
TABLE 3: CONSTANT REVENUES, DECREASING REVENUES AND INCREASING REVENUES IN AGRICULTURAL COMPANIES
Indicator/ Year 1998 1999 2000 2001 2002 2003 2004 2005 2006 2007 2008 2009
Constant revenues 26 39 29 34 35 32 13 39 23 24 28 15
Increasing revenues 359 217 358 176 281 327 352 363 304 161 341 302
Decreasing revenues 105 234 103 280 174 131 125 88 163 305 121 173
Source: own calculation
From total amount of 490 companies in 1998 were on the level of constant return of scale 26 companies and other companies were insufficient. 105 companies were in the area of decreased returns of scale what mean that they should decrease their production to increase the efficiency of scale. 359 companies operated with increased returns of scale what means that unit of input brings higher marginal income and from this reason they should increase their production by rational input usage. To the next year the amount of companies with optimal size increased on 39 companies. In this year the amount of companies in the area of decreased returns of scale grew up and 234 companies should cut down the scale. In 2000 the number of companies in area of increased returns of scale grew up on 141 companies what means that the companies should enlarge their operating activities to be closer with productivity to the most effective companies. In 2001 in the branch were 456 companies which not have the optimal scale of their production. From these companies 280 companies were too big and their efficiency should be increasing if they decreased the scale of their production. 176 companies were in the area of the increasing returns of scale so from rational point of view it means that they should increase the production. In that case the total productivity of branch would be higher about 0.03% above maximum if they would reduce amount of inputs on optimal level. In 2003 from the point of view of scale the optimal structure had just few producers. Constant returns of scale reached just 32 companies so it is at least as was total amount of producers operated on the production possibilities frontier. 131 companies should decrease their production and 327 companies (66.7%) are in the area of increased returns of scale so for more effective production they should the scale of production increase. Companies with growing returns of scale was predominating the companies with decreased returns of scale before 2007. In the last followed ten year period in the area of increased returns of scale were just 161 companies and the decreased returns of scale reached 305 companies. From these results we can say that companies wanted to produce lot of products without to pay attention on efficiency. Majority of companies should reduce their production scale.
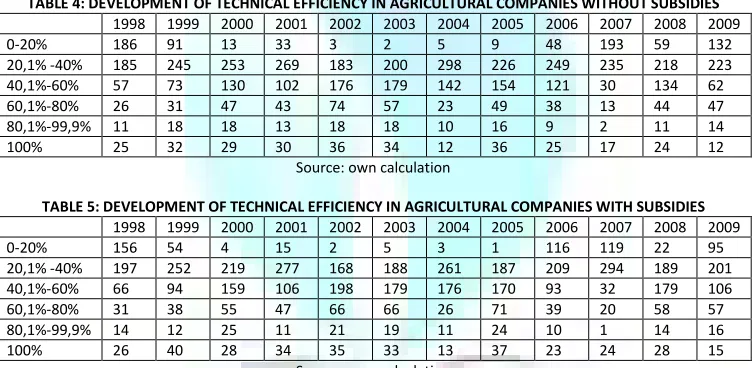
TABLE 4: DEVELOPMENT OF TECHNICAL EFFICIENCY IN AGRICULTURAL COMPANIES WITHOUT SUBSIDIES
1998 1999 2000 2001 2002 2003 2004 2005 2006 2007 2008 2009
0-20% 186 91 13 33 3 2 5 9 48 193 59 132
20,1% -40% 185 245 253 269 183 200 298 226 249 235 218 223
40,1%-60% 57 73 130 102 176 179 142 154 121 30 134 62
60,1%-80% 26 31 47 43 74 57 23 49 38 13 44 47
80,1%-99,9% 11 18 18 13 18 18 10 16 9 2 11 14
100% 25 32 29 30 36 34 12 36 25 17 24 12
Source: own calculation
TABLE 5: DEVELOPMENT OF TECHNICAL EFFICIENCY IN AGRICULTURAL COMPANIES WITH SUBSIDIES
1998 1999 2000 2001 2002 2003 2004 2005 2006 2007 2008 2009
0-20% 156 54 4 15 2 5 3 1 116 119 22 95
20,1% -40% 197 252 219 277 168 188 261 187 209 294 189 201
40,1%-60% 66 94 159 106 198 179 176 170 93 32 179 106
60,1%-80% 31 38 55 47 66 66 26 71 39 20 58 57
80,1%-99,9% 14 12 25 11 21 19 11 24 10 1 14 16
100% 26 40 28 34 35 33 13 37 23 24 28 15
Source: own calculation
In 1998 before reallocation of subsidies the most farms (76%) operated in the interval of technical efficiency 0 – 40%. After reallocation of subsidies grew up the amount of agricultural companies in interval of 20,1 – 40 % about 12 companies. On the production possibilities frontier 25 companies were operating (it is about 5%) before subsidies and this amount increased about 1 company after reallocation of subsidies. In 1999 the most of companies reached the efficiency up to 60%. The efficiency without subsidies reached 91 companies lower than 20 % from total amount of companies’ collection. The allocation of subsidies this number decreased on 54 producers. According to this decrease after allocation of subsidies came to increase of companies on the level of efficiency between 20,1 – 40% about 7 companies. In the interval of efficiency from 40,1% up to 60% came to increasing of companies about 21. On the production possibilities frontier begun to produce after subsidies 40 companies what is increase about 14 companies in comparison with year before.
Significant efficiency increase is conspicuously in 2000, where were in the branch only 13 companies on level till 20% and after given subsidies, this share decreased on 4 companies. It was change opposite 1999 about 50 companies. The share of companies with efficiency between 20,1% till 40% decreased. In this interval were around 50% of all production units. Abrupt increase of efficiency was in range 40,1% till 60%, where reached their results of operating about 159 companies. By the subsidies influence one of the company diverted from production possibility frontier to interval till 99,9%.
In 2001 the amount of producers in range up to 20% scaled up after subsidies allocation about 11 producers. The highest number of producers operated in the interval of efficiency from 20,1% up to 40%. Before subsidies it was 54,9% of producers and after subsidies increased this amount about 1,64%. In comparison with 2000 the count of companies increased on the branch level of production frontier on 34 companies. After this came to decreasing of producer`s count with efficiency from 80,1 to 99,9 % from current amount 25 companies after subsidies on 11.
Continually increasing of input usage efficiency has impact on the companies which operate in not effective intervals. In the interval up to 20 % (the less effective level) were 3 % of companies without supports and just 2 companies after supports in 2002. The lower count of companies reached the efficiency in the range 20,1 – 40% in comparison with the most effective companies of the last year. We can see the increase of companies in the range from 60,1 to 80% on 74 companies (without subsidies) and 66 companies (after subsidies). Medium increase we can follow by companies which produce on the production possibilities frontier, where the count of companies after subsidies increased on 35 companies.
VOLUME NO.2(2012),ISSUE NO.11(NOVEMBER) ISSN2231-5756
after year 2003. Technical efficiency was in these conditions on the lower level as in the last period. The state support had positive effect but just by few companies because not all companies received subsidies from the state and the subsidies was not in the same amount for each company. Partially the count of companies after subsidies decreased in the range of efficiency from 20,1% to 40 % about 12 companies. Constant count of companies (179) was in the interval from 40,1 to 60%. The efficiency level from 60,1% up to 80% were able to increase just 9 producers after the allocation of subsidies.
Year 2004 was important because of entrance to the European Union and from first May was applied Common Agricultural Policy of EU. CAP adapted approach of subsidies payment. The new rules of agrarian policy had impact on reached efficiency in this branch. In agricultural operated before given subsidies 60,81% companies with efficiency from 20,1% till 40% against 12 companies which operated on the production possibility frontier. After given subsidies this number of companies decreased from 298 on 261 companies and so the number of companies with efficiency from 40,1% till 60% increased from 142 on 176 companies. The number of companies on the level from 60% - 80% increased from 23 on 26 companies because of subsidies. One company reached efficiency till 100% and so the group of producers on production possibility frontier increased about 1 company on final count 13 companies.
In 2005 the amount of companies with technical efficiency from 20,1% to 40% decreased and it came to increasing of companies in the range of technical efficiency from 60,1% to 80% (increase about 45 companies after subsidies in comparison with year before). 37 companies operated on the production possibilities frontier after subsidies what means the growth about 24 producers in comparison with 2004.
According to our results we can say that the share of companies with efficiency 0 – 40% scaled up in 2006. The efficiency in the branch should get worst after allocation of subsidies. This situation is caused by higher amount of subsidies to 23 companies which produced on the production possibilities frontier and to these companies amain increased the efficiency and the production possibilities frontier. The companies were not competitive without subsidies what caused the decrease of companies’ efficiency. 93,2 % of companies would be not able to reach the production possibilities frontier.
Similar like in 2006 also in 2007 the share of companies with efficiency up to 40% increased. Companies which invested to the technologies used European founds and were not afraid to take loans. In last period companies have production function higher as the average value of low effective companies and it was because of investing activities. The low effective group of companies contains 90,8% of companies. 17 companies produced on the production possibility frontier before given subsidies. After given subsidies this number increased around 7 companies.
Year 2009 is signed by economic crises which hit all branch of agriculture of Slovakia. From total amount of analysed companies operated on the production possibility frontier after subsidies 15 farms what is with comparison with 2008 about 13 farms less. Around 41% of companies were in the interval from 20,1% - 40% after subsidies.
CONCLUSION
On the base of our analyse we detected that the efficiency of companies increased by subsidies allocation in particular years in average about 0,06% up to 4,36%. All these changes were statistical approved except 2003. The reason of this situation was that except of subsidies the companies took special loans from the state for bypassing higher loss caused by worst climate conditions. In general we can say that the subsidies had positive impact on the technical efficiency of companies which reached the values of efficiency up to 40% compared with companies which produced on the production possibilities frontier. It means that financial support was good divided and helped mainly to companies which really needed that help. On other hand these subsidies were for companies very important but in the consequence of subsidies can endanger degeneration of production environment. Some companies are prosperous just because of subsidies and without them they would be not competitive. Except of based company production envoi the agricultural producers have other function too. We are talking about keeping of employment and regional development in many areas which are not interesting for investors from secondary sector.
The allocation of subsidies leaded into decrease of companies which produced on the production possibilities frontier about 1 company in 2000, 2002 and 2003. In 2006 the count of the most effective companies decreased about 2 companies. The opposite effect we can see in 2007. After allocation of subsidies the level of efficiency increased in each year and on the production possibilities frontier started to produce around 24 companies.
From the point of companies size the majority of producers were in the area of increased returns of scale what means that companies were not conveyable in followed period. These companies should increase their scale of production. In the last year of followed period the situation changed and in the area of increased returns of scale was just around 161 companies.
REFERENCES
1. BANKER, R.D. – CHARNES, A. – COOPER, W.W., (1984), “Some models for the estimation of technical and scale inefficiencies in Data Envelopment Analysis.”
Management Science 30,1984, p.1078-1092
2. BANKER, R.D. – THRALL, R.M., (1992), “Estimation of returns of scale using Data Envelopment Analysis.” European Journal of Operational Research 62. 1992, p.74-84.
3. CHARNES, A. – COOPER, W.W. – RHODES,E., (1978), “Measuring the efficiency of decision making units.” Journal of Operational Research, 1978, p.429-441
4. CHRASTINOVÁ Z., (2005), “Medium-term vision of integration changes impact in agriculture on the institutional structure of countryside”. Bratislava,
VÚEPP, 2005
5. DEBREU G., (1951), “The Coefficient of Resource Utilization.” Econometrica Journal of the Econometric Society, Vol.19, No. 3.1951, p.273-292,
6. FANDEL P., (2002), “Factors of efficiency and profitability of agricultural companies in the Slovak Republic.” Bratislava: VÚEPP, 2002
7. FARREL M.J., (1957), “The measurement of productive efficiency.” In: Journal of the Royal Statistical Society. Vol.120, part III., 1957, p.253-281
8. GRZNÁR, M. – SZABO, Ľ., (2005), “Efficiency and productivity of agriculture and agricultural companies.” Economy of Agriculture V, 2005, Num.1,VUEPP
Bratislava,p.23-28. ISSN 1335-6186
9. GUBOVÁ M., (2005), “The Development of company’s structure in agricultural producing.” Bratislava: VÚEPP, 2005. ISBN 80-8058-377-3
10. KOOPMANS T.C., (1951), “Efficient Allocation of Resources”. Econometrica Journal of the Econometric Society, Vol.19, No.4, 1951, p.455-465
11. KUBANKOVÁ M., (2005), “Evaluation of efficiency trends of main agricultural products before and after the entrance of the Slovak Republic to the EU and
their expecting development”. In study 106/2005. Bratislava: VÚEPP, 2005, 28 p. ISBN 80-8058-408-7
12. LISSITSA, A. – BALMANN, A., (2003), “Efficiency and productivity of farms in post-unification Germany.” Debrecen: Efita 2003. p. 439-450
13. MACAULEY Molly K., (2007), „Decision Support for Agricultural Efficiendy.“ Sept 2007.
http://www.climatescience.gov/Library/sap/sap5-1/public-review-draft/sap5-1prd-Ch1.pdf
14. MATHIJS E., (2002), “Microeconomic analysis of farm restructuring in Central and Eastern Europe.” Agricultural Economics 2002. p.189-196. ISSN 0139-570X
15. MURILLO-ZAMORANO L.R., (2004), “Economic Efficiency and Frontier Techniques”. In Journal of Economic Surveys. Vol 18, No.1. p.33-77, February 2004
16. SWINNEN, J. – VRANKEN, L., (2005), “Reforms and efficiency change in transition agriculture”. Paper prepared for presentation at the 11th Congress of the
EAAE (European Association of Agricultural Economists) “The future of rural Europe in the global agri-food system”. Copenhagen, Denmark, 24-27 August 2005
REQUEST FOR FEEDBACK
Dear Readers
At the very outset, International Journal of Research in Commerce, IT and Management (IJRCM)
acknowledges & appreciates your efforts in showing interest in our present issue under your kind perusal.
I would like to request you to supply your critical comments and suggestions about the material published
in this issue as well as on the journal as a whole, on our E-mail i.e.
for further
improvements in the interest of research.
If you have any queries please feel free to contact us on our E-mail
.
I am sure that your feedback and deliberations would make future issues better – a result of our joint
effort.
Looking forward an appropriate consideration.
With sincere regards
Thanking you profoundly
Academically yours
Sd/-