ADAPTIVE SEGMENTATION WITH OPTIMAL WINDOW
LENGTH SCHEME USING FRACTAL DIMENSION
AND WAVELET TRANSFORM
S.M. Anisheh
Department of Computer and Electrical Engineering Noushirvani University of Technology, P.O. Box 47144, Babol, Iran
H. Hassanpour*
School of Information Technology and Computer Engineering Shahrood University of Technology, P.O. Box 316, Shahrood, Iran
*Corresponding Author
(Received: July 14, 2008 – Accepted in Revised Form: July 2, 2009)
Abstract In many signal processing applications, such as EEG analysis, the non-stationary signal is often required to be segmented into small epochs. This is accomplished by drawing the boundaries of signal at time instances where its statistical characteristics, such as amplitude and/or frequency, change. In the proposed method, the original signal is initially decomposed into signals with different frequency bands using wavelet transform. The fractal dimension of the decomposed signal is calculated in a sliding window and the results are used as a feature for adaptive segmentation. A criterion is introduced in this paper to choose a proper length for the sliding window. Performance of the proposed method is compared with that of three other existing segmentation methods using synthetic and real EEG data. Simulation results show the high efficiency of the proposed method in signal segmentation.
Keywords Non-Stationary Signal, Adaptive Segmentation, Fractal Dimension, Wavelet Transform, Window Length EEG !" #$ %&' ( ) '* . ,(- . ."/ 0) 123 14$5 ! 67 , 89 : / ; '* . < =5 " > ; 6) < , ' / ?"$ ; 9) ; '* . " / @A ; 9) B* 9 % C 63 !0 ; < '* ,>D 4$5 !'- ( 6E) ! F ; BG" ; '* . @ F .
=H
9 'I J$" C
/ @ !0 ; B* . < =5 ( < 'H' ! BG" B "L ; @7< < ; EEG F B* . " 6* M !5 C ; N < =5 ( ! . 1. INTRODUCTION
In many signal processing applications, such as EEG analysis [1-3], the signal of interest is initially segmented into small epochs to consider the signal as piece-wise stationary. This is performed as many of the existing signal processing techniques, such as the technique introduced in [1], are only applicable to stationary or piece-wise stationary
In principle, two basic approaches exist for segmentation, namely constant segmentation and adaptive segmentation. In constant segmentation the signal is divided into small epochs with a fixed length. In general, this type of segmentation is the simplest one. However, the segmented signal may not have the condition needed for the analysis system (stationarity) [1,4,5].
Considering the disadvantage of constant segmentation approach, it is necessary to utilize a segmentation approach that automatically detects the true segments boundaries. The automatic detection of the true boundaries is known as adaptive segmentation [1,4,5]. In this approach, segmentation is performed based on the change in statistical characteristics (such as amplitude and/or frequency variations) of the original signal.
There are a number of adaptive segmentation techniques in the literature. In Varri’s method [6], two successive windows are slided along the signal. For each window, the frequency and amplitude variations are used for adaptive segmentation. To enhance the accuracy of Varri’s method, Krajca [7] suggested applying a threshold on the G function. Therefore, the local maxima of G function above the threshold are considered as segment boundaries.
In another method, a nonlinear energy operator (NLEO) is used for adaptive segmentation in EEG signal [4]. The output of NLEO is proportional to multiplication of instantaneous amplitude and frequency of the input signal; therefore, the two criteria for adaptive segmentation, amplitude variation and frequency change, are considered in NLEO. NLEO operator creates cross-terms for multi-component signals and therefore may have false segmentation results [5].
To improve the performance of the method introduced in [4], wavelet transform can be used as a pre-processing step [5]. In this method, namely INLEO, the signal is initially decomposed into different frequency bands using the wavelet transform. Then, NLEO operator is applied on the decomposed signals to detect the segments boundaries. Since, frequency changes in the decomposed signals are less than the changes in the original signal; the cross-term problem is alleviated to some extent. In another method [3], it has been shown that fractal dimension (FD) is a powerful tool for transient detection in a signal and
can be used to detect epileptic seizures [3].
In the above mentioned methods, the window length is not chosen adaptively; therefore, they have less accuracy in segmentation. This paper proposes a new approach for adaptive segmentation. In this approach the signal is initially decomposed into different frequency bands using wavelet transform. Then, the decomposed signal is segmented by considering its fractal dimensions. When the statistical behavior of a signal changes it is reflected in the fractal dimension of the signal. In this paper, a criterion is also presented to choose the proper length of sliding window to increase the accuracy of the proposed method. It is shown in this paper that the proposed method is superior to the existing methods in adaptive segmentation. In addition, the performance assessment of the proposed method indicates that it takes a short time to analyze an epoch; therefore it can be used for on-line segmentation.
The structure of the paper is as follows: Section 2 provides the background knowledge for the proposed method. The proposed adaptive segmentation method is explained in Sections 3. The performance assessment of the proposed method is performed in Section 4. Finally, conclusions are drawn in Section 5.
2. BACKGROUNDS FOR THE PROPOSED METHOD
2.1. Wavelet Transform Wavelet is a small wave with finite energy, which has its energy concentrated in time or space to provide a tool for the analysis of transient, non-stationary or time-varying phenomenon [8-10].The compactness and finite energy properties of wavelet functions have differentiated wavelet decompositions from other analysis such as Fourier transform. Discrete wavelet transform (DWT) can decompose time domain signal to different frequency bands by different time and frequency resolutions. Discrete time signal x can be decomposed into two different frequency bands using DWT as follows [11,12]:
] n m 2 [ h g n
] n [ x ] m [ h
∑ − = n ] n m 2 [ l g ] n [ x ] m [ l y (2)
Where yh[.] and yl[.] are the outputs of the high-pass and low-high-pass filters with gh[.] and gl[.] as impulse responses after sub-sampling by 2, respectively. The resulted component yl[.] can again be filtered for further decomposing the signal. The original signal can be reconstructed as follows: ) m ] n m 2 [ l g ] m [ l y ] n m 2 [ h g ] m [ h y ( ] n [
x =∑ − + − (3)
It should be mentioned that there is no absolute way to select a certain wavelet function (i.e. gh[.] and gl[.] in Equations 1 and 2). Choosing a wavelet function depends on the application. Choosing a wavelet function conforming to the original signal is very useful in wavelet applications [13].
2.2. Fractal Dimension The fractal dimension is an important characteristic of fractals as it contains information about their geometric structure. Fractal dimension values indicate the complexity of a pattern, or the quantity of information embedded in a pattern [14].
While Euclidean shapes have certain dimensions, for example, a cube has dimension 3, fractal process has no certain sizes. They are said to be self–similar and independent of scaling [14]. Fractal dimension analysis has been widely used in biomedical signal processing, such as EEG analysis [15,16]. It has been shown that FD is a promising method in transient detection [17,18]. In addition, in this approach there is no need to have a prior knowledge about the characteristics of the transient. FD calculation for transient detection is fast. It consists of estimating the dimension of a time-varying signal directly in the time domain, which reduces the computational load.
There are several different techniques in the literature for computing FD of a time series. An extensive research has been performed in [19,20] to compare between FDs in different application area. Higuchi algorithm [21] has a more precise estimation in computing FD of a signal, but it is sensitive to noise. Katz algorithm [22], compared to Higuchi has a lower accuracy. Katz's method creates the most consistent results concerning discrimination between states of brain function. In
addition, this algorithm has a lower sensitivity to noise. Petrosian's method [23] is relatively linear and presents the least dynamic range for the estimated FD. This method, like Higuchi, is sensitive to noise.
Selection of FD algorithm depends on the application. Factors such as knowledge about possible FD range, noise level and window length should be considered to gain the best results. In this paper, we have used Katz’s algorithm to calculate FD [19,20,22]. In this algorithm, FD of a time series is defined as follows:
, ) d ( 10 log ) L ( 10 log
FD= (4)
Where L is the length of the time series or sum of distances between successive points, d is diameter estimation of the distance between the first data point and the data with the highest distance. By normalizing the distance, using a as the average distance between the two successive data points, the following equation is obtained.
) a / d ( 10 log ) a / L ( 10 log
FD= (5)
In the above equation, we consider n = L/a as the step size in the time series, therefore Equation 5 can be written as below:
) n ( 10 log ) L / d ( 10 log ) n ( 10 log FD + = (6)
The above equation represents the Katz’s method to calculate FD of the time series [19,20,22].
3. PROPOSED ADAPTIVE SEGMENTATION METHOD
The proposed adaptive segmentation method consists of three steps described below,
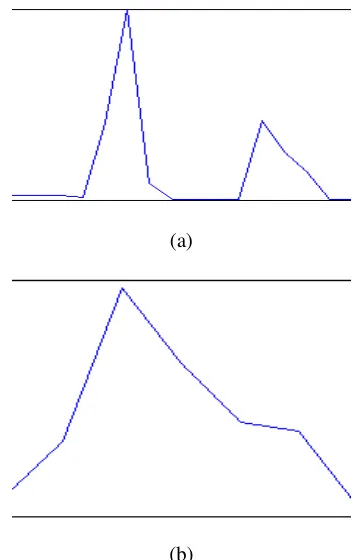
(a)
(b)
Figure 1. Representation of the G function applied on a signal, (a) it is more spike for the proper window length and (b) it is less spike for an improper window length.
signal. It should be noted that the structure variations in the original signal appear in its sub-bands [5,24].
2. In adaptive segmentation when the statistical characteristics of a signal encounter a considerable change, the signal should be splitted at border of the change. Since structure of signal is the main concern in segmentation, fractal dimension can be a suitable tool for monitoring structure variations along the signal. In this step, two successive windows are slided along the signal. For each window, FD is computed using the Katz algorithm [19,20,22]. Any changes on the signal characteristics are reflected on the fractal dimension of the signal. Therefore, for application of adaptive segmentation, we use FD variations to detect segments boundaries [3,24].
The following function, namely G function, is used to detect segments boundaries:
G = [G1,G2,…,GM-1],
Gi = |FDi+1-FDi| i = 1,…,M-1 (7)
Where,Mis thetotal number of analyzed windows. G function can be normalized by Gi/max(G) during the analysis process to have the values between 0 to 1.
3. Finally, to localize the segments boundaries in a signal, the corresponding G function is thresholded. The local maxima above the threshold value are considered as positions of segments boundaries. One may choose the average value of G as the threshold [24].
Two parameters are needed to calculate the fractal dimension of a signal. These parameters are: window length, percentage overlapping of the successive windows.
The first important parameter used in adaptive segmentation algorithm is the window length. A large window length may results in missing segments boundaries. On the other hand, the window length should be short enough to recognize the smallest segments. Therefore, we present a method to find the best window length for the analyzing signal.
As mentioned before, the signal under analysis is assumed to have the same statistical characteristics through the whole segment. Therefore, the same fractal dimension should be obtained from the sliding windows along the segment. G function calculates the difference of the fractal dimension in
successive windows of the signal; hence, it should have little values in a segment. Facing a new segment, due to the changes in statistical characteristics of the analyzing signal, the corresponding fractal dimension is changed. This change is reflected in G function; hence, the segment boundary is detected.
calculated using the following equation: k i 2 | l i G | l G E ∑ = (8)
Where k is the number of samples in Gl. The k term in the denominator is written for energy normalization to have a fair comparison between the energy of Gl s associated with different window length.
Finally, the proper window length is the minimum point of the normalized energy curve associated with G function versus window length. Overlapping successive windows is another parameter required in calculating FD of a signal. Window overlapping increases accuracy of the proposed method in detecting the segments boundaries with the cost of increasing computational load. To compromise between accuracy and computational load factors, we choose 50 % overlapping for successive windows.
4. PERFORMANCE ASSESSMENT
4.1. Synthetic Signal In order to assess performance of the proposed method, it was applied on a synthetic multi-component signal shown in Figure 2a. The signal in this figure contains seven multi-component epochs with the duration between 6 s to 8 s described below:
Block 1: 0.5cos(πt)+1.5cos(4πt)+4cos(8πt),
Block 2: 1.5cos(2πt)+4cos(14πt),
Block 3: cos(πt)+4.5cos(7πt),
Block 4: ), t 16 cos( 5 . 3 ) t 6 cos( 8 . 0 ) t 2 cos( 5 . 1 ) t cos( 5 .
0 π + π + π + π
Block 5: 0.5cos(6πt)+2.5cos(16πt),
Block 6: 0.5cos(3πt)+1.7cos(8πt),
Block 7: 0.8cos(3πt)+cos(5πt)+3cos(8πt)
In the proposed method, the decomposed signal from the approximate sub-band is used for
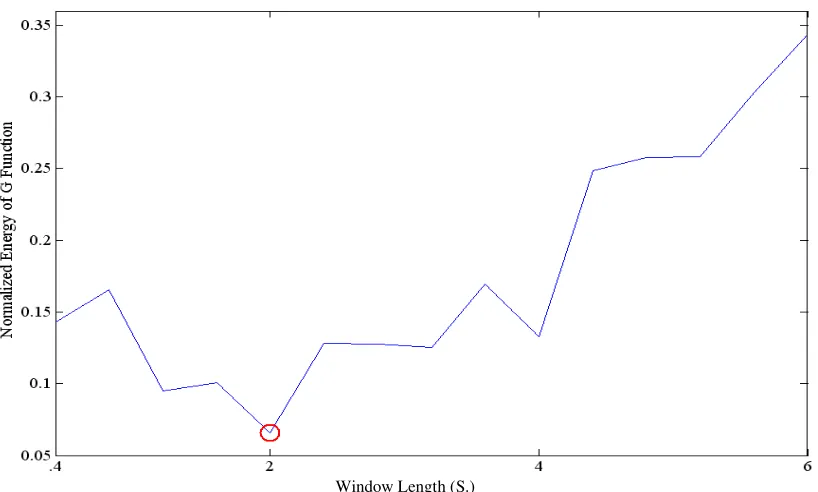
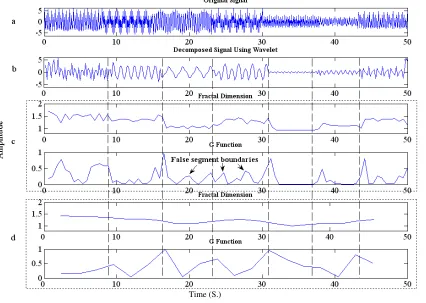
segmentation. In this research, DWT is performed with Daubechies wavelet of order 8. The approximate sub-band for the signal in Figure 2a is shown in Figure 2b. Considering the point that the length of the smallest segment in Figure 2a is 6 s, windows up to 6 s are analyzed to determine the optimum window length following Equation 8. Figure 3 shows the normalized energy curve of G function versus window length. This figure indicates that the optimum window length for segmenting the signal in Figure 2a is 2 s. FD and G function of the decomposed signal are computed using the optimum window length, and the results are shown in Figures 2c,d respectively. After thresholding, the local maxima in G function (see Figure 2d) clearly represent boundaries for the all seven epochs.
To show the importance of window length in segmentation, we have applied the proposed method on the signal in Figure 2a using non-optimal window lengths (window length of 1.2 s and 4.8 s) and the results are shown in Figure 4. As the figure shows, computing G function using the optimum window length provides more spiky G function, hence, improves accuracy of the proposed method in signal segmentation.
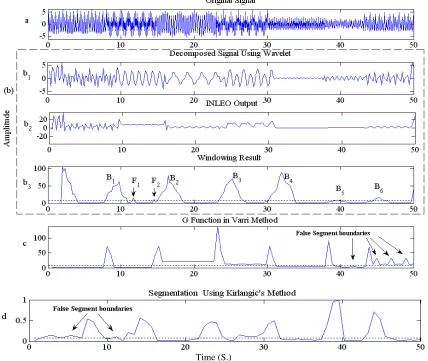
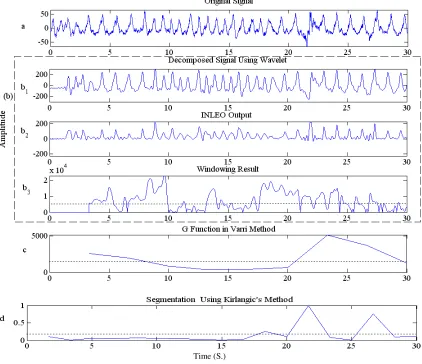
To evaluate the performance of the proposed method, the signal in Figure 2a is segmented using three existing methods, INLEO [5], Varri [7] and Kirlangic [3] methods. The results of segmentation with these methods are shown in Figure 5. As can be seen in Figure 5b3, some of segment boundaries cannot be clearly recognized using the INLEO method. To detect boundaries B5 and B6 in Figure 5b3, a lower threshold value is needed, in which causes false boundaries detection (see F1 and F2 in Figure 5b3).
Varri’s and Kirlangic’s methods are also applied on the signal in Figure 2a and the results are shown in Figures 5c and 5d respectively. These figures indicate that these methods have more false boundary detection rate (marked with the arrows in the plots) compared to the proposed method.
Time (S.)
Figure 2. Using the Proposed method for segmentation, (a) original signal, (b) approximate signal after applying two levels DWT, (c) fractal dimension computed using optimal window length (window length=2 s)
and overlapping is 50 % and (d) Gfunction, threshold value is 0.13.
Window Length (S.)
Time (S.)
Figure 4. Using the proposed method for segmenting the signal in Figure 2a with non-optimal window lengths: (a) original signal, (b) approximate signal after applying two levels DWT,
(c) window length = 1.2 s and (d)window length = 4.8 s.
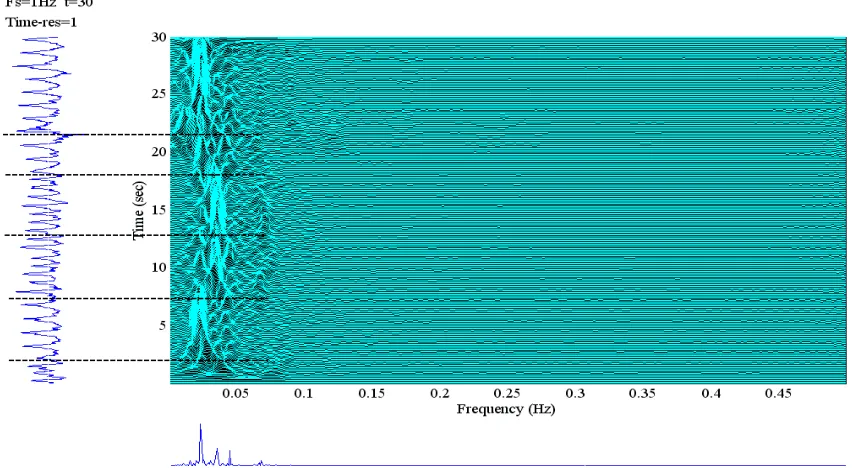
five level DWT, and the approximate sub-band is shown in Figure 6b. The minimum segment duration was set to 3 second [4]. We have found 2.8 second as the optimal window length using the normalized energy of G function. The segmentation result is shown in Figure 6d. As the figure shows, the proposed method could segment the EEG signal into six segments. As described before, the aim of segmentation is to have epochs with similar characteristics along each epoch. To test the performance of the proposed method in segmenting the EEG, the time-frequency distribution [25] of the signal was shown in Figure 7. This figure clearly indicates existence of the six epochs with the different time-frequency characteristics. For example, epoch1 has more frequency variation compared to epoch 2, and epoch 2 is concentrated on lower frequency region compared to epoch 3. The signal in Figure 6a was segmented using
INLEO [5], Varri [7] and Kirlangic [3] methods. The results of segmentation with these methods are shown in Fig 8. As can be seen, there are too much fluctuations in Figure 8b3. Therefore, by the existence of these fluctuations, it is difficult to determine the local maxima indicating segments boundaries.
Varri’s and Kirlangic’s methods are applied on the signal in Figure 6a and the results are shown in Figures 8c,d respectively. As can be seen in this figure, only one segment boundary (at about 23 s) is detected using Varri’s method. It should be mentioned that empirically parameter adjustment is the main problem in using Varri’s method. Figure 8d indicates that some segment boundaries are missed by Kirlangic’s method.
Time (S.)
Figure 5. Using the proposed method for segmentation. (a) original signal. (b) approximate signal after applying two levels DWT, (c) fractal dimension computed using optimal window length (window length=2 s)
and overlapping is 50 % and (d) G function, threshold value is 0.13.
and false alarm or false positive (FP) ratios as defined below [26]:
, N
t N
TP= ,
N m N
FN= ,
N f N
FP= (9)
Where Nt , Nm , Nf and N represent the number of true, missed, falsely detected and actual number of segment boundaries respectively. An efficient segmentation approach should have a high value for TP ratio and low values for FN and FP ratios. The results of segmentation using the proposed method and the three other existing approaches on
Time (S.)
Figure 6. Using the proposed method for segmenting EEG signal, (a) original signal, (b) approximate signal after applying five levels DWT, (c) fractal dimension computed using optimal window length (window length= 2.8 second)
and overlapping is 50 % and (d) G function, threshold value is 0.32.
Time (S.)
Figure 8. Using the exiting approaches for segmenting the signal in Figure 6a, (a) original signal, (b) the INLEO approach {b1: approximate signal after applying five levels DWT, b2: INLEO output, b3: results of applying the sliding window},
(c) G function in varri’s method and (d) segmentation using kirlangic’s method.
TABLE 1. Results of Segmentation using Proposed Method and Three other Existing Approaches with 40 Realizations for EEG Signals.
Method TP Ratio FN Ratio FP Ratio Average Run-Time (s.)
Proposed Method 88.57 % 11.43 % 8.57 % 1.3991
INLEO 82.86 % 17.14 % 245.71 % 1.1121
Kirlangic 60 % 40 % 60 % 0.1725
5. CONCLUSIONS
In this paper, a new method for adaptive segmentation of non-stationary signals using fractal dimension and wavelet transform has been introduced. The fractal dimensions of the decomposed signal are computed in a sliding window. The obtained results contain spikes pointing the segments boundaries. A criterion was presented to choose the proper length of sliding window to increase the accuracy of the proposed method. The performance of the proposed method was compared with three other exiting methods and the results indicate superiority of the proposed method for segmenting non-stationary signals.
6. REFERENCES
1. Kosar, K., Lhotska, L. and Krajca, V., “Classification of Long-Term EEG Recordings”, Lecture Notes in Computer Science,Vol. 3337, (2004), 322-332. 2. Hassanpour, H., Mesbah, M. and Boashash, B.,
“ Time- Fr eq uenc y Bas ed Newb or n EEG Sei zur e Det ec ti on us ing Low and Hi gh Fr eq uenc y Signatures”, Physiological Measurement, Vol. 25, (2004), 935-944.
3. Kirlangic, M.E., Perez, D., Kudryavtseva, S., Griessbach, G., Henning, G. and Ivanova, G., “Fractal Dimension as a Feature for Adaptive Electroencephalogram Segmentation in Epilepsy”, Proc. IEEEInternational EMBS Conference, Vol. 2, (2001), 1573-1576.
4. Agarwal, R. and Gotman, J. “Adaptive Segmentation of Electroencephalographic Data using a Nonlinear Energy Operator”, Proc. IEEE International Symposium on Circuits and Systems (ISCAS'99), Vol. 4, (1999), 199-202.
5. Hassanpour, H. and Shahiri, M.,“Adaptive Segmentation using Wavelet Transform”, IEEE International Conference on Electrical Engineering, (2007), 1-5.
6. Varri, A., “Digital Processing of the EEG in Epilepsy” Licentiate Thesis, Tampere University of Technology, Tampere, Finland, (1988).
7. Krajca, V., Petranek, S., Patakova, I. and Varri, A., “Automatic Identificaton of Significant Graphoelements in Multichannel EEG Recordings by Adaptive Segmentation and Fuzzy Clustering”, Int. J. Biomed. Comput., Vol. 28, (1991), 71-89.
8. Magosso, E., Ursino, M., Zaniboni, A. and Gardella, E., “A Wavelet-Based Energetic Approach for the Analysis o f B i o m e d i c a l Si g n a l s : A p p l i c a t i o n t o t h e Electroencephalogram and Electro-Oculogram”, Applied Mathematics and Computation, Vol. 207, (2009), 42-62.
9. Sun, L. and Shen, M., “Analysis of Non-Stationary E l e c t r o e n c e p h a l o g r a m u s i n g t h e W a v e l e t Transformation”, International Conference on Signal Processing, Vol. 2, (2002), 1520-1523.
10. Yamaguchi, C., “Fourier and Wavelet Analyses of Normal and Epileptic Electroencephalogram (EEG)”, Proc. IEEE International EMBS Conference, Vol. 20, (2003), 406-409.
11. Walnut, D.F., “An Introduction to Wavelet Analysis”, Birkhauser Boston, Cambridge, MA, U.S.A., (2004). 12. Bachmann, G., Narici, L. and Beckenstein, E.,“Fourier
and Wavelet Analysis”, Springer, New York, U.S.A., (2002).
13. Daubechies, I., “Ten lectures on Wavelets”, Society for Industrial and Applied Mathematics, Philadelphia, U.S.A., (1992).
14. Fa lc oner , J ., “ Frac ta l Geomet r y Ma themat ical Foundations and Applications”, John Wiley and Sons, New York, U.S.A., (2003).
15. Acharya, U.R., Faust, O., Kannathal, N., Chua, T. and Laxminarayan, S., “Non-Linear Analysis of EEG Signals at Various Sleep Stages”, Comput Methods Programs Biomed, Vol. 80, (2005), 37-45.
16. Paramanathan, P. and Uthayakumar, R., “Application of F r a c t a l T he or y i n An a l ys i s of H u ma n Electroencephalographic Signals”, Computers in Biology and Medicine, Vol. 38, (2007), 372-378. 17. Tykierko, M., “Using Invariants to Change Detection in
Dynamical System with Chaos”, Physica D: Nonlinear Phenomena, Vol. 237, (2008), 6-13.
18. Li, Y., Fan, Y.L. and Tong, Q.Y., “Endpoint Detection in Noisy Environment using Complexity Measure”, Proc. IEEE InternationalConference, Vol. 3, (2007), 1004-1007.
19. Esteller, R., Vachtsevanos, G., Echauz, J. and litt, B., “A Comparison of Fractal Dimension Algorithms using Synthetic and Experimental Data”, Proc. IEEE International Symposium on Circuits and Systems (ISCAS'99), Vol. 3, (1999), 199-202.
20. Esteller, R., Vachtsevanos, G., Echauz, J. and litt, B., “A Comparison of Fractal Dimension Algorithms using Synthetic and Experimental Data”, IEEE Trans. Circuits Syst., Vol. 48, (2001), 177-183.
21. Higuchi, T., “Aproach to an Irregular Time Series on The Basis of the Fractal Theory”, Physica D, Vol. 31, (1988), 277-283.
22. Katz, M. J., “Fractals and the Analysis of Waveforms”, Comput. Biol. Med., Vol. 18, (1988), 145-156. 23. Petrosian, A., “Kolmogorov Complexity of Finite
Sequences and Recognition of Different Preictal EEG Patterns”, Proc. IEEE Symposium onComputer-Based Medical Systems, Vol. 5, (1995), 212-217.
24. Hassanpour, H., Anisheh, S.M., “Adaptive Segmentation using Fractal Dimension and Wavelet Transform”, IEEE Int. Workshop on Signal Processing and its App., Sharjah, U.A.E., (2008).
25. Boashash, B., “Introduction to the Concepts of Time-Frequency Signal Analysis and Processing”, Elsevier, Oxford, U.K., (2003).