HYDROGEN DISTRIBUTION IN REFINERY WITH
NON-LINEAR PROGRAMMING
F. Shahraki , E. Kashi
Department of Chemical Engineering, Sistan and Baluchestan University, Zahedan, Iran
D. Rashtchian
Department of Chemical and Petroleum Engineering, Sharif University of Technology, Tehran, Iran
(Received: Jan 17, 2004– Accepted in Revised Form: Aug. 5, 2005)
Abstract Growth of the world population, increasing demand for fossil fuel consumption
and consequently increasing threat of global warming, has extended the need for production and use of clean fuels and normal hydrogen is an important utility in the production of clean fuels. In this paper, a mathematical optimization method is applied which is based on non-linear programming of superstructure for minimizing the consumption of hydrogen. The method considers all the pressure constraints and is suited for revamping industrial systems. The optimum placement of new equipments like purification unit has been also considered. It is tried to verify the method adopted, in addition, an industrial case study has been carried out.
Keywords Hydrogen, Optimization, Non-linear programming, Refinery
ﺪﻴﻜﭼ ه
ﺪﺷﺎﺑﻲﻣرﻮﻔﻟﻮﺳﻢﻛوهﺰﻴﻛﺎﭘيﺎﻬﺘﺧﻮﺳﺪﻴﻟﻮﺗردﻢﻬﻣﻲﺘﻴﻠﻴﺗﻮﻳﻚﻳنژورﺪﻴﻫلﺎﻣﺮﻧ .
ﻦﻴـﻴﻌﺗشورﻪﻟﺎﻘﻣﻦﻳارد
ﺖﻓﺮﮔراﺮﻗﻲﺳرﺮﺑدرﻮﻣﺎﻬﻫﺎﮕﺸﻳﻻﺎﭘردزﺎﻴﻧدرﻮﻣنژورﺪﻴﻫناﺰﻴﻣﻦﻳﺮﺘﻤﻛ .
ﻲـﺿﺎﻳرﻼﻣﺎـﻛشورﻚـﻳﻪﻛشورﻦﻳاﻚﻤﻛﻪﺑ
اﺮﻃاﺪﺘﺑازاهﺎﮕﺸﻳﻻﺎﭘنژورﺪﻴﻫﻪﻜﺒﺷﺪﺷﺎﺑﻲﻣ
ﺪـﻳدﺮﮔﺺﺨﺸـﻣﺎﻫﺪﺣاوﻦﻴﺑﺮﻴﺴﻣﻦﻳﺮﻨﻬﺑوهﺪﺷﻲﺣ .
اﺪـﺘﺑا،شورﻦـﻳارد
ﺮﮕﻳﺪﻜﻳﻪﺑﺎﻬﻧآلﺎﺼﺗاﺖﻟﺎﺣﻦﻳﺮﺗﻪﻨﻴﻬﺑﺎﻬﻧآيورﺮﺑمﺮﺟﻪﻧزاﻮﻣتﻻدﺎﻌﻣﻦﺘﺷﻮﻧﺎﺑﺲﭙﺳوهﺪﺷﺺﺨﺸﻣﺎﻬﻫﺎﭼوﺎﻫﻪﻤﺸﭼ ددﺮﮔﻲﻣﺺﺨﺸﻣ .
1. INTRODUCTION
Oil refining industry uses increasingly large amounts of hydrogen. The shrinking market for heavy fuel oil and the move to heavier crude oils are forcing refiners to increase their use of hydrocracking as a means of upgrading heavy oils to middle distillates and products that are more valuable. Therefore, the continuous reduction of the acceptable amount of sulfur content of fuels throughout the world has increased the need for hydro-treating, while low-aromatic gasoline has
reduced the scope for hydrogen production as a byproduct of catalytic reforming. At the same time concerns about CO2 emissions, has led the refiners to look for an alternative new way to reduce hydrogen production. The hydrogen production process produces a considerable amount of CO2, typically 10kg CO2/kg H2 produced. Raising the throughput of a refinery will also increase the consumption of hydrogen, with the existing hydrogen production capacity often being a bottleneck. [1,2,3]
consists of several processes that can be considered as a hydrogen sources and hydrogen sinks. If we could increase the amount of recycled hydrogen, it would be possible to reduce the amount of hydrogen that is sent to the furnaces with the off-gas, and decrease the need for hydrogen production. [4] This procedure increases cost effectiveness by removing the need for a new hydrogen production plant necessary for higher amounts of hydrogen. The interactions between these elements define the hydrogen distribution network and the amount of require hydrogen. This is analogous to that of heat integration process [5], in which we seek to minimize the utility requirements of a process by maximizing heat exchange between streams. [6]
For designing and operation of the hydrogen distribution systems, one should firstly take the available supplies of hydrogen into consideration. The hydrogen used in a refinery may have different origins. Catalytic reforming is the preferred source of hydrogen in most refineries. This process increases the octane number of heavy naphtha by cyclization and dehydrogenation of aliphatic hydrocarbon molecules into aromatic compounds and at the same time generates large amounts of hydrogen at 70-90% purity that can be used in variety of refinery processes. Additional amounts of hydrogen that may be needed in hydro-cracker or refineries that make deep conversion of heavy oils can be supplied by the steam reforming of natural gas, refinery off-gases, or naphtha. Partial oxidation of hydrocarbons and importing hydrogen-by-hydrogen pipeline, if available, are possible alternatives to steam reforming. The integration of steam reforming or partial oxidation
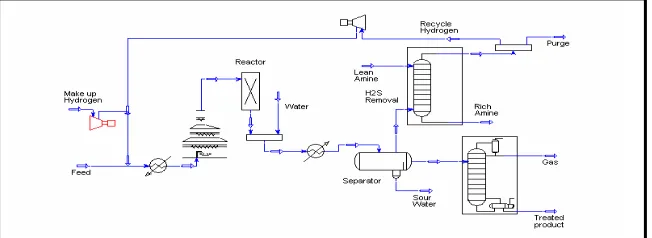
with pressure-swing adsorption (PSA) separation technology is a common practice in new technologies, allowing for the production of hydrogen with purity of exceeding 99%. [7,8] The main sinks are refinery processes like hydro-crackers or hydro-treaters that consume hydrogen. Sometimes an off-gas stream is sent to the fuel gas system or is flared. Therefore, fuel gas system and flare are potential sinks. Figure 1 shows a simplified flow diagram of a typical hydrogen consumption process. A liquid hydrocarbon feed stream is mixed with hydrogen-rich gas, heated and fed to a reactor. Part of the hydrogen is consumed during the reaction with the feed. Light hydrocarbon compounds (methane, ethane, and propane), H2S, and NH3 are usually formed as byproducts of the reaction. The effluent from the reactor is cooled and sent to a high-pressure flash separator. The gas released in the separator, is often treated in an amine scrubber in order to remove the H2S. Part of the gas is vented from the process through a high-pressure purge to prevent the buildup of hydrocarbons in the recycle. The remaining hydrogen-rich gas is recompressed and returned to the reactor, together with a fresh hydrogen make-up stream. The liquid stream removed from the bottom of the high-pressure separator contains some hydrogen, light hydrocarbon gases, and H2S in solutions, which are lost from the hydrogen system. This liquid stream is often sent to a low-pressure separator, from which an off-gas is taken and typically sent to a flare or to the fuel gas system. Figure 2 shows the simplified diagram of the sinks and the sources.
Figure 1. Schematic diagram of a typical hydrogen
consumption plant
Figure 2. Sink and source diagram
Although the hydrogen system can be improved by modifying the individual units or processes, but the interactions among different units are specified the performance rate of the overall system. Towler and et al. [9] have analyzed distribution system of hydrogen using value composite curves, taking the cost effectiveness of hydrogen reuse into consideration. Their approach provides new insights into economic trade off in hydrogen management problem. Alves and et al. [10] proposed a systematic method for having the least amount of fresh hydrogen for a hydrogen distribution system. However, it does not account for the physical limitations of designing hydrogen distribution networks.
In this paper, the application of a mass integration procedure has been used for refinery hydrogen management. Mass integration determines the optimal routing and allocation among sources and sinks. Sometimes, sources can be intercepted and modified in order to change flow rates and composition.
2. MATHEMATICAL NETWORK DESIGN
In this work, a method is described that can account for the pressure constraints and at the same time can optimize hydrogen distribution network. This problem is commonly observed in industry. The refineries that are interested in no-cost or low-cost modifications such as re-routing and
allocation changes may be concerned about this criterion.
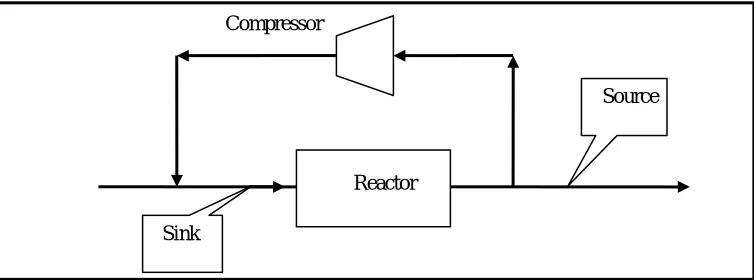
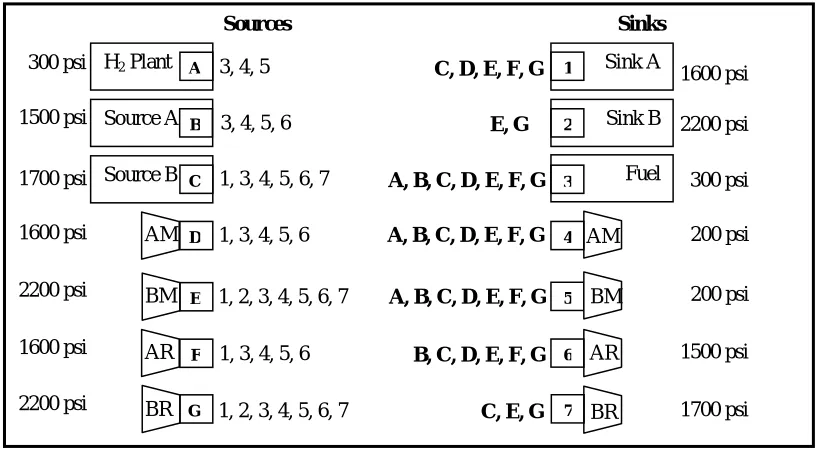
This method is based on optimizing a reducible superstructure and may be illustrated with a simple example already used by N. Hallale [11,12]. There are two hydrogen consumers (A and B) and a hydrogen plant in this example. The hydrogen system is shown in Figure 3. Each consumer has both make-up and recycle of hydrogen. Currently the hydrogen plant supplies 200MMscfd hydrogen. In this figure, letter legends specify sources and numbers indicate sinks.
Moreover, it is worth noting the physical and engineering aspects of the problem. Obviously, direct re-use of hydrogen by consumers is only possible if there is sufficient pressure. However, if certain conditions are satisfied, it is possible to re-use a hydrogen stream indirectly, i.e. by routing through an existing compressor. Firstly, we must make sure that sufficient compressor is available in order to accommodate the stream. Re-using hydrogen will change the make-up and recycle flow rates throughout the system and consequently some capacity may be freed in one or more compressors. In addition, the initial pressure of the re-used stream needs to be high enough to be fed to the compressor as it is designed for a specific inlet pressure. Besides, the compressor should be able to pressurize the stream to an elevated pressure so that it can be used for the required consumer. To obtain this objective, the first step is to set up a superstructure that embeds all possible connections while considering the practicality issues. First, we connect all sinks and sources so that the source
Reactor
Source
Sink
Figure 3. An existing network in example
Figure 4. Source and sink connections are shown by matched number and letters
300 psi 200 MMscfd
F 6
B
110 MMscfd
2200 psi 85%
1700 psi
10 MMscfd
E C
5 2
H2 Plant
90 MMscfd
99% 300 psi
1600 psi
490 MMscfd 91%
1500 psi
40 MMscfd
G
D C
A
7 4
3
1 A
Fuel
310 MMscfd
H2 Plant
Source A
Source B
AM
BM
AR 1600 psi
2200 psi 1600 psi 300 psi
1700 psi
Sink B Sink A
AM
AR 3,4,5
3,4,5,6
1,3,4,5, 6, 7
1,3,4,5, 6
A
B
C
D
E
F
1
2
3
4
6
1,2,3,4, 5, 6, 7
1,3,4,5, 6
C, D, E, F, G
E, G
A, B, C, D, E, F, G
A, B, C, D, E, F, G
B, C, D, E, F, G A, B, C, D, E, F, G
1500 psi
5 BM
Fuel
Sources Sinks
BR
2200 psi G 1,2,3,4, 5, 6, 7 C, E, G 7 BR
1600 psi
2200 psi
300 psi
200 psi
200 psi
1500 psi
pressure is more than or equal to the sink pressure (Figure 4). The source pressure does not have to be equal to the sink pressure since the source can readily be dropped to a lower pressure, for example by passing through a valve. Note that in this formulation, a compressor consists of a source and a sink; the inlet and the outlet of the compressor behave as the sink and the source, respectively. Setting up the superstructure in this way assumes that the inlet and the outlet pressures of the compressors are fixed at their design values. Next step is to develop a mathematical plan for the design. First, let us consider our objective that is to minimize the hydrogen consumption. Several constraints that must be met for this purpose are discussed here. Note that the flow rates should be used as a molar or standard volume. All computer code for the above procedures was written by the authors.
Sinks:
The amounts of gas fed, as well as the hydrogen purity (partial pressure) at the reactor inlet are assumed constant. Mass balance: j , k sin i j , i
F
F
=
∑
(1) Hydrogen balance: j , k sin j , k sin i i j ,i
y
F
y
F
=
∑
(2)Sources:
The total amount of gas sent to the sinks and fuel system must be equal to the amount available from the source: Mass balance: i , source j j , i
F
F
=
∑
(3)Compressors:
Here both the flow rates and the purity in the compressors are the variables, whereas for the hydrogen consumers they were constant. The constraints on the compressors are as follows. The
flow rate of gas entering the compressor must be equal to the exit flow rate.
Mass balance:
∑
∑
=
i comp , i j j , compF
F
(4)The amount of pure hydrogen entering the compressor must be equal to the amount leaving. Hydrogen balance:
∑
∑
=
i i comp , i j comp j ,comp
y
F
y
F
(5)Since the existing compressors have been designed for a specific flow rate, there will be a maximum flow rate constraint on them. Usually, this will be the design flow rate with a small tolerance.
Capacity limit: comp max, i comp , i
F
F
≤
∑
(6)Since several sources may be mixed before entering a compressor and the hydrogen purity in the compressors is not known a priori, the problem is a non-linear program (NLP). There are several ways to approach this problem. One way would be to use the standard non-linear programming technique. This problem can be attached adopting some kind of spreadsheets (e.g., Excel as is used in this work).
In this example, it is assumed that all the compressors are operating at their designed flow rates and have an additional 5% margin. Optimization by minimizing hydrogen consumption gives the design shown in Figure 5. Although the pressure of the purge gas from A is too low to be fed directly to B, it can be fed to B’s make-up compressor. This is designed for an inlet pressure of 300 psi. The minimum consumption rate is 195.9 MMscfd.
included. However, we can add new equipments like compressors and purifiers to the hydrogen network. We will discuss the purifications in new units that raise the hydrogen purity of resources. The most commonly used purifiers are PSA, membrane and cryogenic. Whyshall and Picioccio [13] have provided a very detailed comparison of these three alternatives.
3. SELECTING THE BEST PURIFICATION TECHNOLOGY
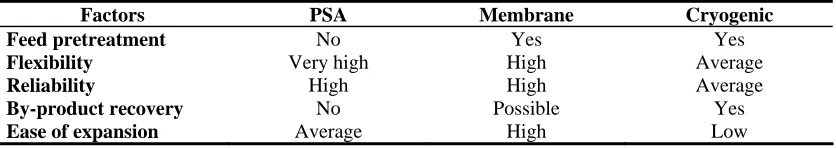
Selecting the most-appropriate hydrogen purification technology, depends upon the both procedural requirements (hydrogen recovery, feed, and product) and operational requirements (flexibility, reliability, feed pretreatment, and by-product recovery). The factors discussed so far, are summarized in brief for all technologies in Tables 1 and 2.
The PSA process requires relatively high hydrogen purity feeds (typically above 50% by volume) at moderate pressures and delivers a high-purity product with little pressure drop with a good hydrogen recovery from the feed. PSA units are particularly well suited for purifying catalytic
reformer hydrogen that is used in hydro-processing units. The high purity of the hydrogen produced in a PSA unit helps maintaining high purity in the hydro-processing unit and the small pressure drop across the PSA prevents the unnecessary recompression.
In comparison with PSA, membrane systems need to operate under sizeable pressure drop to deliver moderately pure hydrogen (typically 90 to 95 vol.%), but with higher recovery. Such systems are more suited for recovering hydrogen from high-pressure purge gases.
The performance of cryogenic units is similar to that of membrane systems except that the hydrogen pressure loss is much less. The cryogenic process is preferred when the hydrogen content of the feed is low (30 to 50 vol.%) and the expansion of hydrocarbons provides the necessary cooling without external refrigeration. Cryogenic units allow the simultaneous recovery of by-products like ethane and methane. However, they have low reliability and flexibility and require significant feed pretreatment.
Having installed a purifier, we have actually added a new sink (the feed stream) and two new sources (product and residue streams) to the network. Figure 6 shows a schematic diagram of the purifier.
Table 1. Procedural Considerations in Hydrogen Purification Technology
Factors PSA Membrane Cryogenic
Minimum feed H2, % 50 15 15
Feed pressure, psig 150 - 1,000 200 - 2,000 200 - 1,200
H2 purity, % 99.9+ 98 max. 97 max.
H2 recovery, % up to 90 up to 97 up to 98
CO + CO2 removal Yes No No
H2 product pressure Approximately feed Much less than feed Approximately feed
Table 2. Operational Considerations in Hydrogen Purification Technology
Factors PSA Membrane Cryogenic
Feed pretreatment No Yes Yes
Flexibility Very high High Average
Reliability High High Average
By-product recovery No Possible Yes
Figure 6.Shematic diagram of purifier
Having specified the purity of the product (yprod,pure) and hydrogen recovery of the purifier (R), mass balance around the purifier gives:
residual j
j , prod i
pur ,
i
F
F
F
=
∑
+
∑
(7)Hydrogen balance around the purifier gives:
∑
∑
=
×
×
×
i
i pur , i j
j , prod
prod
F
R
F
y
y
(8)Case study:
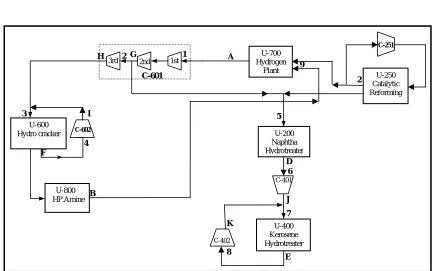
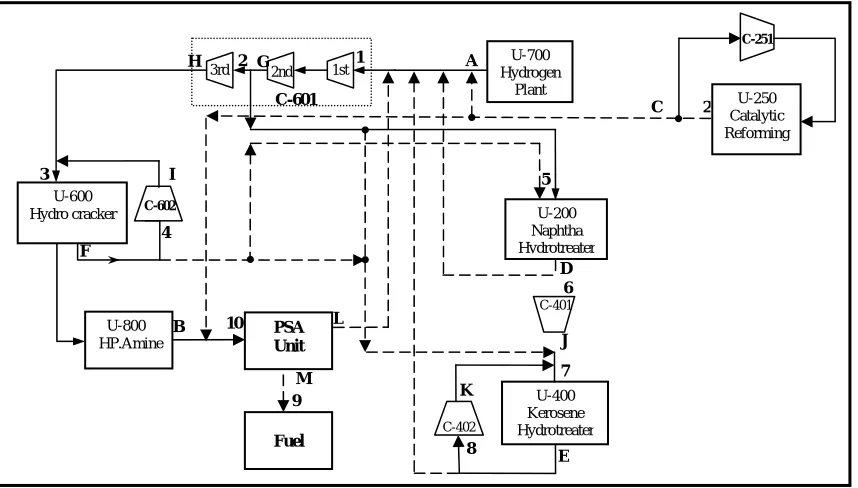
This case study is representative of a real refinery system. Figure 7 shows the existing hydrogen system in the refinery. There are three consumers and the hydrogen is supplied by a hydrogen plant. There are two make-up compressors in the system and all the consumers have recycle compressors except the naphtha hydrotreater plant. Currently, 35000 Nm3/h hydrogen is produced in the hydrogen plant. The data related to the flow rate and pressure is presented in Table 3. Table 4 shows the maximum capacity of the compressors.
Purifier Feed
Residual
Product (rich from hydrogen)
C-602
U-250 Catalytic Reforming
U-400 Kerosene Hydrotreater U-700 Hydrogen
Plant 3rd 2nd 1st
C-601
U-800 HP.Amine
U-200 Naphtha Hydrotreater
C-401
C-402
9
2 A
1 G
2 H
3
F
4 I
C-251
B
5
D 6
J 7
E 8
K
U-600 Hydro cracker
Table 3. Process data for refinery in the case study
Stream No.
Temp. (°C)
Pressure (kg/cm2)
Rate (Nm3/h)
Mole % H2
1 33 25 10100 68.6
2 32 16 35000 95.9
3 150 180 20000 95.9
4 54 27.5 2900 55
5 38 25 8000 67
6 N/A 74 5000 95.9
7 41 25 1900 94.5
8 33 30 37000 68.6
9 62 165 210000 84
10 29 24 5500 90
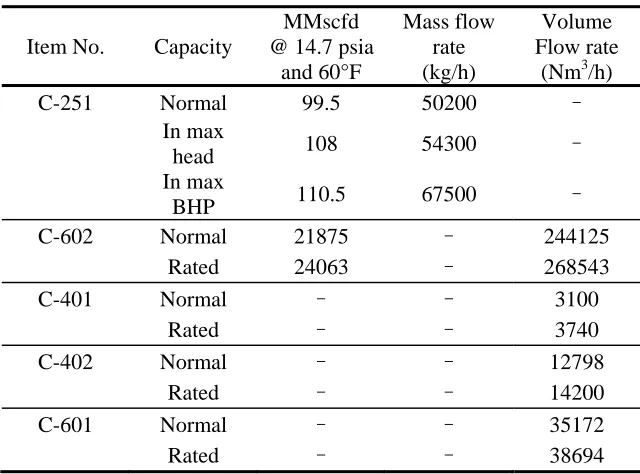
Table 4. Maximum capacity of compressors in the case study
Item No. Capacity
MMscfd @ 14.7 psia
and 60°F
Mass flow rate (kg/h)
Volume Flow rate (Nm3/h)
C-251 Normal 99.5 50200
-In max
head 108 54300
-In max
BHP 110.5 67500
-C-602 Normal 21875 - 244125
Rated 24063 - 268543
C-401 Normal - - 3100
Rated - - 3740
C-402 Normal - - 12798
Rated - - 14200
C-601 Normal - - 35172
Rated - - 38694
The refinery has imposed some limitations, which are as follows:
1. The maximum capacity is limited for the existing compressors (shown in Table 4).
2. The purity of naphtha hydrotreater sinks should be at least 80%.
3. PSA units are preferred for purification because they do not require feed pretreatment. The PSA residue must be sent to the fuel system. The PSA product purity is assumed 96% and the recovery is assumed 90%. The pressure drop in the
PSA unit is one bar
.
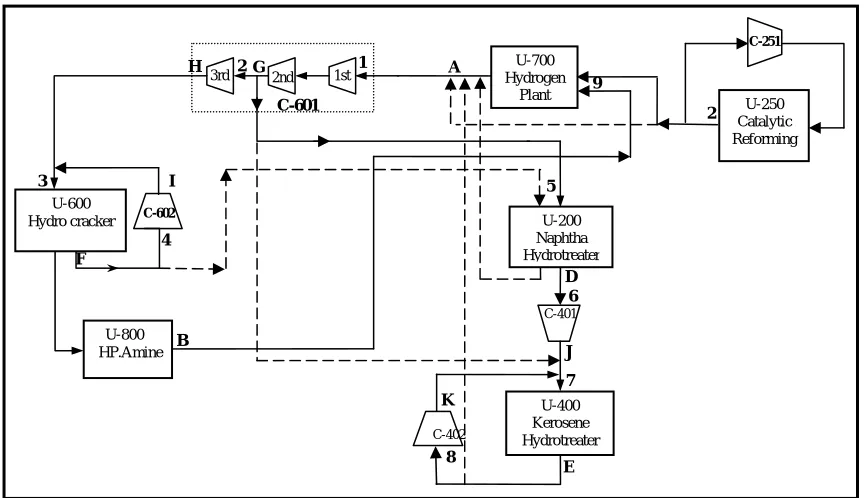
The purpose of designing this network is to provide the minimum utility. Figure 8 shows the design procedure without adding any new equipment to the network. Dotted lines depict new connections.
change, we will not have any enhancement improvements.
The total capital cost invested on this retrofit, is $884868 and the saving in operational cost is $502964/year. The payback period is therefore 22 months.
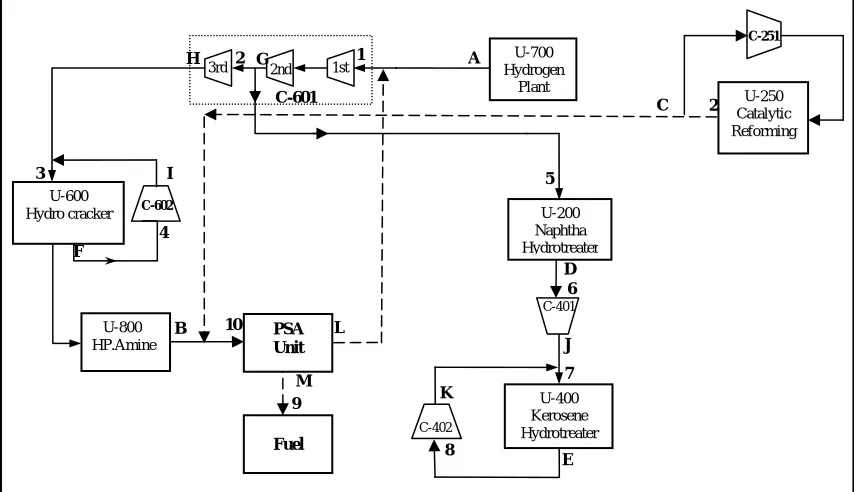
If we are allowed for the new equipments
(Figure 10), the purifier would be the best choice. By fixing the purity of naphtha hydrotreater sink at 95.9%, again, we willnot have any other connections and only the purifier can be added. In this case, the maximum saving of utility will be 11532 Nm3/h. The total capital cost is $3895682 and the operating cost saving will be $4576585 per
C-602
U-250 Catalytic Reforming
U-400 Kerosene Hydrotreater U-700 Hydrogen
Plant 3rd 2nd 1st
C-601
U-800 HP.Amine
U-200 Naphtha Hydrotreater
C-401
C-402
9
2 A
1 G
2 H
3
F
4 I
C-251
B
5
D 6
J 7
E 8
K
U-600 Hydro cracker
Figure 8. A network designed with non-linear programming, (no new equipment is adopted)
C-602
U-250 Catalytic Reforming
U-400 Kerosene Hydrotreater U-700 Hydrogen
Plant 3rd 2nd 1st
C-601
U-800 HP.Amine
U-200 Naphtha Hydrotreater
C-401
C-402
9
2 A
1 G
2 H
3
F
4 I
C-251
B
5
D 6
J 7
E 8
K
year. The payback period is 11 months.
The given cost of hydrogen is $1.48/kmol. Towler and et al. [9] have prepared the capital cost and operating cost of PSA unit that are as follows: Capital cost of PSA unit:
Cost (103 $) = 503.8+347.4*feed flow (MMscfd) (9) Operating cost of PSA unit:
Z
Y
Q
C
Kmol R
*
2364
.
0
04
.
18
1994
$
=
+
⎟ ⎠ ⎞ ⎜ ⎝
⎛ (10)
Where Y = recovery yield of hydrogen, Z = feed gas hydrogen mole fraction, and Q = production rate of purified hydrogen (kmol/h)
By decreasing the purity of naphtha hydrotreater sink to 85.488%, we can achieve better results. In this way, one compressor is omitted and the amount of saving of utility will be 11619 Nm3/h.
Figures 8 and 9 show the related network design. In this case based on equations 9 and 10, the total
capital investment of the retrofit would be $4327142 and the operating cost saving would be $4332355/year and thus the payback period would be 12 months. Although the amount of utility saving increases, the operational cost saving decreases. Note that in all cases, we made some changes in the connections in order to reduce the cost. These streams have the same purity. Figures 9 and 12 show the simplified diagram.
4. CONCLUSION
In this paper, a mathematical method is introduced for planning and design of hydrogen network in the refinery. The method is based on setting up a superstructure model.
C-602
U-250 Catalytic Reforming
U-400 Kerosene Hydrotreater U-700 Hydrogen
Plant 3rd 2nd 1st
C-601
U-800 HP.Amine
U-200 Naphtha Hydrotreater
C-401
C-402
9
2 A
1 G
2 H
3
F
4 I
C-251
B
5
D 6
J 7
E 8
K
U-600 Hydro cracker
PSA Unit
Fuel M
L 10
C
Figure 11. Network design with new PSA unit (purity of naphtha hydrotreater sink is 5.488%)
Figure 12. The simplified diagram of new network design with PSA unit. Purity of naphtha
hydrotreater sink is 85.488%
Besides pressure constraints, the mathematical nature of this approach enables the designer to
C-602
U-250 Catalytic Reforming
U-400 Kerosene Hydrotreater U-700 Hydrogen
Plant 3rd 2nd 1st
C-601
U-800 HP.Amine
U-200 Naphtha Hydrotreater
C-401
C-402
9
2 A
1 G
2 H
3
F
4 I
C-251
B
5
D 6
J 7
E 8
K
U-600 Hydro cracker
PSA Unit
Fuel M
L 10
C
C-602
U-250 Catalytic Reforming
U-400 Kerosene Hydrotreater U-700 Hydrogen
Plant 3rd 2nd 1st
C-601
U-800 HP.Amine
U-200 Naphtha Hydrotreater
C-401
C-402
9
2 A
1 G
2 H
3
F
4 I
C-251
B
5
D 6
J 7
E 8
K
U-600 Hydro cracker
PSA Unit
Fuel M
L 10
include any other practical constrains like safety, operability, layout, contaminant, pollution, etc and full details are given by Kashi [14].
Finally, the method presented in this paper is not limited to the hydrogen distribution systems. It can also be used for other systems with sources and sinks like water and wastewater systems, where both the quantity (e.g. flow rate) and the quality (e.g. purity) are to be considered simultaneously.
5. ACKNOWLEDGMENTS
The helpful cooperation of Tabriz refinery by providing valuable industrial information and making refinery case study possible during this research is gratefully acknowledged.
6. REFERENCES
1. Hallale, N. and Liu, N., “Refinery Hydrogen Management for Clean Fuels Production”,
Advances in Environmental Research, 81-98,
July 2001
2. Hallale, N., Moore, L. and Vauk, D., “Hydrogen: Liability or Asset?”, Chemical
Engineering Progress, September 2002
3. Phillips, G., “Hydrogen Innovative Business Solutions for 2005 & Beyond”, the European Refining Technology Conference-Process, Paris, France, November 1999
4. Peramanu, S., Cox, B. G. and Pruden, B. B., “Economics of Hydrogen Recovery Processes for the Purification of Hydro Processor Purge and Off-gases”, International Journal of
Hydrogen Energy, 24, 405-424, 1999
5. Linnhoff, B., Townsend, D. W. and Boland, D., “User Guide on Process Integration for the Efficient use of Energy”, IChemE, Rugby, UK, 1982
6. Aitani, A. M., “Processes To Enhance Refinery-Hydrogen Production”, Journal of
Hydrogen Energy, 21(4), 267-271, 1995
7. Lin, Y. M. and Rei, M. H., “Separation of Hydrogen from the Gas Mixture out of Catalytic Reformer by using Supported Palladium Membrane”, Separation and
Purification Technology, 25, 87-95, 2001
8. Spillman, W. R., “Economics of Gas Separation Membranes”, Chemical Engineering Progress, 41-62, January 1989
9. Towler, G. P., Mann, R., Serriere, A. and Gabaude, C. M., “Refinery Hydrogen Management: Cost Analysis of Chemically-Integrated Facilities”, Industrial Engineering
Chemical Research, 35, 2378-2388, 1996
10.Alves, J. and Towler, G. P., “Analysis of Refinery Hydrogen Distribution Systems”,
Industrial Engineering Chemical Research, 41,
5759-5769, 2002
11.Hallale, N., “A New Graphical Targeting Method for Water Minimization”, Advances in
Environmental Research, 377-390, July 2002
12.Hallale, N., “Burning Bright Trends in Process Integration”, Chemical Engineering Progress, july 2001
13.Whysall, M. and Picioccio, K. W., “Selection and Revamp of Hydrogen Purification Processes”, AIChE Annual Meeting, Houston, Texas, 1999