*Corresponding author:(Email: [email protected]) Introduction
Groundwater contamination in the rural areas of the developed and less-developed countries is a critical issue (Vilane & Dlamini 2016, Kløve et al., 2017 and Abdalla & Khalil 2018). The most important contamination sources are related to raw sewage, domestic or industrial wastewater discharges, as well as agricultural runoff (Lewis and Claasen, 2018). Uninsulated underground sewage sites, which have direct contact with groundwater therefore, wastewater infiltrates easily into the shallow aquifer (Szabó et al. 2016 and Mester et al. 2017).
Since the establishment of sewage networks was not carried out in parallel with the development of the water infrastructure, and the
general use of uninsulated sewage tanks, domestic wastewater has become the most significant source of pollution in Hungarian settlements. According to the Water Framework Directive (2000/60/EC) and the Urban Wastewater Treatment Directive (271/91/EEC), the member states of the European Union are required to establish sewage systems in every settlement with a population of over 2000. As a result of the implementation of EU environmental legislation, the establishment of sewage networks in Hungary has accelerated over recent years. The difference between the proportion of households connected to the public water network and those connected to a sewage network had fallen below 15% by 2016 (Hungarian Central Statistical Office, 2017). Investments have had a significant impact on the local environment, especially on groundwater
D
OMESTIC wastewater is the most significant source of pollution in Hungarian settlements.In order to eliminate this pollution the construction of sewage networks is ongoing in the country. The investments have a significant impact on the local environment, especially on groundwater resources. In the present case study changes in groundwater quality are evaluated after the construction of the sewage network. In the summers of 2013 and 2017 water samples were collected from 40 ground water wells. The comparative investigations were performed using a contamination index. The following parameters were used to calculate the contamination index:pH, EC, NH4+, NO
2-, NO3-, PO43-, CODps, Na+. The degree of contamination (Cd) of the groundwater was classified into 4 categories: Cd>3 very heavy contamination, 3>Cd>2 heavy contamination, 2>Cd> 1 moderate contamination, 1>Cd low contamination. The results show strong groundwater contamination. In 2013, in 67.5% of the examined wells, the water quality was very heavily or heavily contaminated. Only 15% of the water samples had a low degree of contamination. Three years after the sewage network was set up, significant changes were observed. In 2017 the proportion of highly or heavily contaminated wells dropped to 50%, thus the number of moderately contaminated wells more than doubled. The number of low-polluted wells also grew, but their proportion did not reach 20% in 2017. On the basis of the results, it can be concluded that the purification process has started, but it may take several years. Further environmental measures are needed in order to eliminate these pollutants.
Keywords: Groundwater pollution, Contamination index, Sewage network, Nitrate.
33
Evaluation of Groundwater Quality Changes Following the
Establishment of a Sewage Network
Tamás Mester1*, Dániel Balla2, Emőke Kiss1 and György Szabó1
1Department of Landscape Protection and Environmental Geography, 2Department
resources. In the settlement examined, Báránd, the construction works started in 2013 and the sewage network was completed in 2014. By 2017, more than 90% of households had joined the network; however there are still many households that do not meet the legal requirements.
Water quality status can be described by several chemical,physical and biological parameters (Reisenhofer, 1998). Large amounts of data make evaluation and comparison much more difficult. In order to solve this problem, Horton (1965) proposed the first water quality index. The most important advantage of the various pollutant indices is the aggregating of chemical, physical and biological parameters into a single number, which makes water quality information understandable for both the public and policy makers (Bouslah et al., 2017). Thus, the general use of water quality indices has become a common practice when describing the state of surface and groundwater (Liou et al., 2004, Bora & Goswamic, 2017 and Bouslah et al. 2017). In recent decades several index methods have been developed to aggregate monitoring data into a single water quality index (Brown et al., 1970,
Backman et al., 1998, Reisenhofer et al., 1998 and Pesce - Wunderlin 2000).
In the present study, the effects of the sewage network construction on ground water quality are evaluated using Backman’s (1998) contamination index. The general hypothesis was three years after the investment the ground water quality would have significantly increased. To test this assumption, ground water samples were taken and analysed in 2013 and 2017, and the results were compared. The results of this study provide information on the cleaning processes.
Materials and Methods
Study area
The settlement investigated is located in the eastern part of the Great Hungarian Plain (Fig. 1). The average elevation of this area is 85-89 a.s.l. As a result of the high groundwater level (1-2 metres below the surface), the characteristic soil types are affected by water (Dövényi, 2010). The most common soils are Solonetz,Vertisol,Kastanozem and Chernozem. The average precipitation is 540 mm, and according to the Köppen classification system, the climate group is Cfb (Szelepcsényi et al., 2009).
According to our calculations, over the past few decades 30-40% of the domestic waste water generated (appr. 120,000 m3 every year) could
have seeped into the soil and groundwater (Mester et al., 2017). This significant pollution discharge has caused heavy contamination in the settlement.
Sampling and laboratory analysis
The study included 40 wells (Fig. 1). The sampling was performed in the summers of 2013 and 2017,Water samples were collected from the upper 1-meter water layer and stored in tightly sealed plastic bottles. Analytical measurements we carried out in the Geography Laboratory of the University of Debrecen to the. The pH and EC values were determined using a WTW 315i measuring instrument, the NH4+concentrationswere
determined with Nessler reagent(HS ISO 7150-1:1992), the NO2-concentrations were determined
with alfa-Naftil-amin and the (HS 448-18:2009) and theNO3-concentrations were determined with
sodium-salicylate (HS 1484-13:2009) using a spectrophotometer. The PO43-concentrations were
determined according to Hungarian Standard, HS 12750-17: 1974, using a spectrophotometer. The CODps value was determined with potassium-permanganate, and Na+ was measured by
PerkinElmer 3110 AAS. The contamination index was calculated using MX Excel 2016. Data visualisation with boxplot diagrams and the descriptive statistics were carried out using SPSS 22. Thematic maps of the results were created using the 10.2 version of ArcGIS Software Package.
Calculation of the contamination index
When calculating the contamination index, 8 important parameters were used (pH, EC, NH4+,
NO2-, NO3-, PO43-, CODps,Na+)and calculations
were based on the following equation. (Backman et al., 1998):
Cfi: contamination factor for the i–th parameter, CAi: analytical value of the i–th component, CNi: upper permissible concentration (according to the 6/2009 Hungarian Government Decree) of the
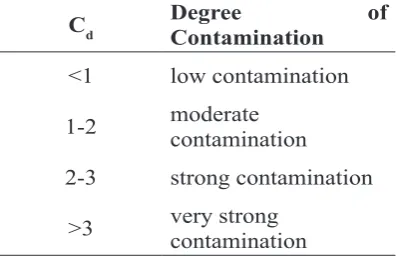
i–thparameter. The contamination degree (Cd) of groundwater was classified into 4 categories (Table 1).
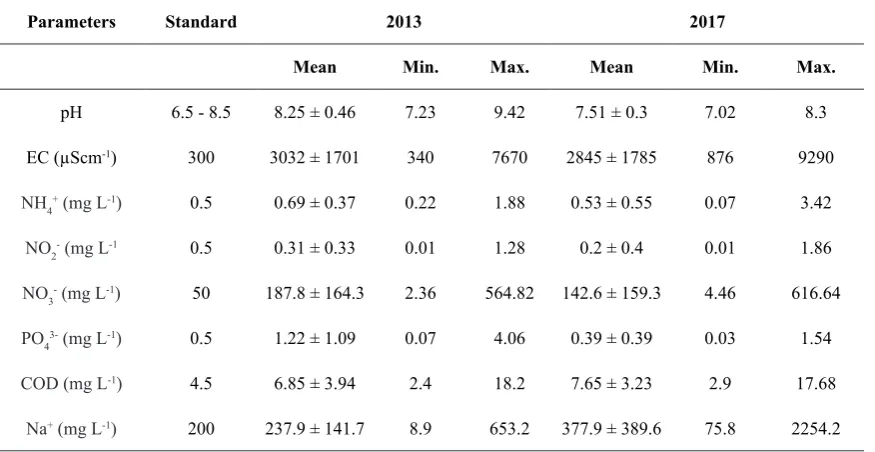
Results and Discussion The average values of the examined parameters for 2013 and 2017 are shown in Table 2. Three years after the construction of the sewage network, a decrease was observed for all the parameters studied, except for Na+ and COD
ps (Table 2).
The high Electrical Conductivity values can be explained by anthropogenic impacts and the natural weathering of the parent material. The Na+ average
concentrations are also characteristic of alkaline soil conditions. Domestic wastewater contains large amounts of phosphorus and nitrogen which are present in groundwater in the form of ions. The mean value of the PO43- concentration (1.22±1.09
mgL-1) decreased below the contamination
limit(0.5mgL-1)to 0.39mgL-1. In the case of the
inorganic nitrogen forms, the average concentration of NH4+ (0.53mgL-1) and NO3-(142.6mgL-1)
remains above the relevant limits (0.5 and 50mgL -1) (Hungarian Government Decree no. 6/2009).
The degree of contamination (Cd) of the
groundwater wells is shown in Table 3. In 2013, in 67.5% of the examined wells, the water quality was very heavily or heavily contaminated. Only 15% of the water samples had a low degree of contamination. The average value of the Cd index
in 2013 was 5.94, and the highest contamination value was determined as 17.7 in the 35thwell,
which is more than five times the lower limit of the very strong contamination category (Fig. 2).
Three years after the construction of the sewage network, significant changes were observed. The proportion of highly or heavily contaminated wells had dropped to 50%, thus the number of moderately contaminated wells had more than doubled. The number of low-polluted wells also increased, but their proportion did not reach 20% in 2017 (Table 3). The mean value of the contamination index decreased from 5.94 to 4.75 (Fig. 2).
TABLE 1. The degree of groundwater contamination according to Cd index (after Backman et al. 1998)
Cd Degree of Contamination
<1 low contamination
1-2 moderate contamination
2-3 strong contamination
>3 very strong contamination
𝑪𝑪𝒅𝒅ൌ 𝐶𝐶𝑓𝑓𝑖𝑖 𝑛𝑛
𝑖𝑖ൌͳ
where:
TABLE 2. Descriptive statistics of the parameters investigated
Parameters Standard 2013 2017
Mean Min. Max. Mean Min. Max.
pH 6.5 - 8.5 8.25 ± 0.46 7.23 9.42 7.51 ± 0.3 7.02 8.3 EC (µScm-1) 300 3032 ± 1701 340 7670 2845 ± 1785 876 9290
NH4+ (mg L-1) 0.5 0.69 ± 0.37 0.22 1.88 0.53 ± 0.55 0.07 3.42
NO2- (mg L-1 0.5 0.31 ± 0.33 0.01 1.28 0.2 ± 0.4 0.01 1.86
NO3- (mg L-1) 50 187.8 ± 164.3 2.36 564.82 142.6 ± 159.3 4.46 616.64
PO43- (mg L-1) 0.5 1.22 ± 1.09 0.07 4.06 0.39 ± 0.39 0.03 1.54
COD (mg L-1) 4.5 6.85 ± 3.94 2.4 18.2 7.65 ± 3.23 2.9 17.68
Na+ (mg L-1) 200 237.9 ± 141.7 8.9 653.2 377.9 ± 389.6 75.8 2254.2
TABLE 3. Number of the monitoring wells with different degree of contamination
Cd Degree of contamination 2013 2017
<1 low contamination 6 7
1-2 moderate contamination 7 13
2-3 strong contamination 10 9
>3 very strong contamination 17 11
Total: 40 40
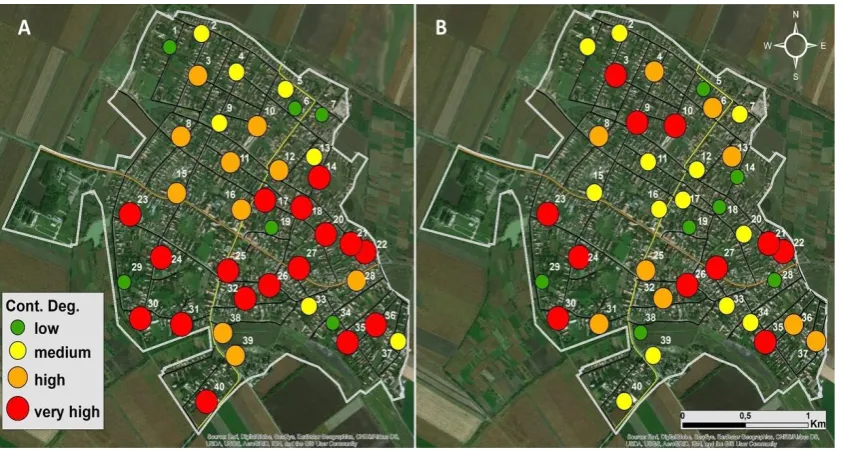
The degree of contamination and its spatial distribution is shown in Fig. 3. By examining the situation in 2013 before the investment it can be concluded that the northern part of the settlement is less polluted. More than 60% of the low or moderate contaminated wells are located here. The southern and eastern part of the settlement shows very heavy pollution. This is explained by the fact that the sewage of more and more households is mixed with the groundwater flowing to the south, so that the level of pollution in the southern area is increasing.
In the third year following the project, it seems that the degree of contamination in the inner parts of the settlement has decreased and the clear north-south difference has disappeared. However, the groundwater can still be regarded as contaminated.
Conclusion In the present study, changes in groundwater quality following the construction of the sewage network were investigated using the contamination index. The results show that the quality of the groundwater of settlements without
a sewage network is heavily contaminated due to decades of pollution. Three years after the sewage network was established, it can beclearly seen that the purification process had started, and the proportion of highly or heavily polluted wells had fallen to 50%, thus the number of moderately contaminated wells had more than doubled. The slow rate of the cleansing process is evidenced by the fact that the number of low-polluted wells hadnot reached 20% in 2017. Furthermore, groundwater purification has slowed down, because there are still households not connected to the sewage network, and point contamination sources such as latrines and manure bushes can still be found at several locations in the settlement. Further environmental measures are needed in order to eliminate these pollutants.
Acknowledgement The research was financed by the Higher Education Institutional Excellence Programme (20428-3/2018/FEKUTSTRAT) of the Ministry of Human Capacities in Hungary, within the framework of the 4.thematic programme of the University of Debrecen.
References
Abdalla, F. and Khalil, R. (2018) Potential effects of groundwater and surface water contamination in an urban area, Qus City, Upper Egypt. Journal of
Afri-can Earth Sciences, 141, 164-178.
Backman, B., Bodiš, D., Lahermo, P., Rapant, S. and Tarvainen, T. (1998) Application of a groundwater contamination index in Finland and Slovakia.
Envi-ronmental Geology, 36 (1-2), 55-64.
Bora, M. and Goswami, D. C. (2017) Water quality as-sessment in terms of water quality index (WQI): case study of the Kolong River, Assam, India.
Ap-plied Water Science, 7 (6), 3125-3135.
Bouslah S., Djemili L. and Houichi L. (2017) Water quality index assessment of Koudiat Medouar Res-ervoir, northeast Algeria using weighted arithmetic index method. Journal of Water and Land Develop-ment. No. 35 p. 221–228. DOI: 10.1515/jwld-2017-0087.
Brown, R. M., McClelland, N. I., Deininger, R. A. and Tozer, R. G. (1970) A Water Quality Index- Do We Dare? Water and Sewage Works. Vol. 117 p. 339– 343.
Dövényi, Z. (2010) Magyarország kistájainak katasz-tere. MTA Földrajztudományi Kutatóintézet, Buda-pest, p. 876.
Horton, R. K. (1965) An index number system for rat-ing water quality. Journal of Water Pollution
Con-trol Federation, 37 (3), 300-306.
HS ISO 7150-1:1992 Hungarian Standard Water qual-ity. Determination of ammonium. Part 1: Manual spectrophotometric method.
HS 1484-13:2009 Hungarian Standard Water quality. Part 12: Determination of nitrate and nitrite. Con-tent by spectrophotometric method.
Hungarian Central Statistical Office (2017) https:// www.ksh.hu/docs/hun/xstadat/xstadat_eves/i_
zrk006.html
Kløve, B., Kvitsand, H. M. L., Pitkänen, T., Gunnars-dottir, M. J., Gaut, S., Gardarsson, S. M. and Miet-tinen, I. (2017) Overview of groundwater sources and water-supply systems, and associated microbial pollution, in Finland, Norway and Iceland.
Hydro-geology Journal, 25 (4), 1033-1044.
Lewis, E., and Claasen, T. (2018) Monitoring ground-water quality in a Namibian rural settlement. Water
Practice and Technology, 13 (2), 312-320.
Liou, S. M., Lo, S. L., and Wang, S. H. (2004) A gener-alized water quality index for Taiwan.
Environmen-tal Monitoring and Assessment, 96(1), 35-52.
Mester T., Szabó Gy., Bessenyei É., Karancsi G., Barkóczi N. and Balla D. (2017) The effects of uninsulated sewage tanks on groundwater. A case study in an eastern Hungarian settlement. Journal
of Water and Land Development, 33, 123–129.
Pesce, S. F. and Wunderlin, D. A. (2000) Use of water quality indices to verify the impact of Córdoba City
(Argentina) on Suquı́a River. Water Research, 34
(11), 2915-2926.
Reisenhofer, E., Adami, G., and Barbieri, P. (1998)
Using chemical and physical parameters to define
the quality of karstic freshwaters (Timavo River, North-eastern Italy): a chemometric approach.
Wa-ter Research, 32 (4), 1193-1203.
Szelepcsényi, Z., Breuer, H., Ács, F., Kozma, I., (2009)
Biophisical climate classifications (in Hungarian).
Légkör. 54 (4), 18-24.
Szabó, Gy., Bessenyei, É., Hajnal, A., Csige, I., Sz-abó, G., Tóth, Cs., Posta, J. and Mester, T. (2016) The Use of Sodium to Calibrate the Transport Modeling of Water Pollution in Sandy Formations Around an Uninsulated Sewage Disposal Site.
Wa-ter Air and Soil Pollution, 227 (2), 1-13.
The joint decree nr. 6/2009 (IV. 14.) of KvVM-EüM-FVM [the Hungarian Ministries of Environment, Healthcare and Agriculture, respectively] about the limit values and standard procedures to assess the pollution level, in order to protect the geological medium and ground waters against pollution. Vilane, B. R. T., and Dlamini, T. L. (2016). An
assess-ment of groundwater pollution from on-site sani-tation in Malkerns, Swaziland. Journal of
Agricul-tural Science and Engineering, 2(2), 11-17.
(Received:28/11/2018;