Assessment of soil quality after biochar application based on enzymatic activity
and microbial composition**
Monika Mierzwa-Hersztek1 , Krzysztof Gondek1 , Agnieszka Klimkowicz-Pawlas2* , Maria J. Chmiel3 , Krzysztof Dziedzic4 , and Hutsol Taras5
1University of Agriculture in Kraków, Department of Agricultural and Environmental Chemistry, Mickiewicza 21, 31-120 Kraków, Poland
2Department of Soil Science Erosion and Land Protection, Institute of Soil Science and Plant Cultivation-State Research Institute, Czartoryskich 8, 24-100 Puławy, Poland
3Department of Microbiology, University of Agriculture in Kraków, Mickiewicza 24/28, 30-059 Kraków, Poland 4Beskid Żywiec Sp. z o.o., Department of Research and Development, Kabaty 2, 34-300 Żywiec, Poland 5State Agrarian and Engineering University in Podilya, 13 Shevchenko Str., Kamianets-Podilskyi, Ukraine, 32300
Received September 14, 2018; accepted March 11, 2019
*Corresponding author e-mail: [email protected]
**This work was carried out under the project named “Research on forming a model of biochar changes in soil based on the quan-titative and qualitative parameters of humus” financed by the National Science Centre (project No.: 2015/17/N/NZ9/01132).
A b s t r a c t. Soil microorganisms play a key role in many biochemical processes essential for the environment and for the ecological and production functions of soils, hence they are very important quality indicators. The study aimed at evaluat -ing the effect of 1 and 2% additions of wheat and miscanthus straw biochars on soil enzymatic activity (dehydrogenases, ure-ase, phosphatases) and the number of microorganisms (bacteria, fungi, actinobacteria). Pot experiments were carried out on soil with a loamy sand texture. The geometric mean of enzyme activi -ties, biological index of fertility, and the integrated total enzyme activity index were used to explore the relationships between soil enzyme activities and the microbiological and chemical properties of soil. The addition of 1% miscanthus straw biochar had the most beneficial effect on the number of bacteria and fungi (increase by 380 and 26%, respectively), and 1% wheat straw biochar on the number of actinomycetes (increase by 273%). The correlation analysis between the number of actinomycetes and the chemical parameters of the soil showed the significant effect of the con -tent of Ntotal (r = 0.76) and Ctotal (r = 0.85). The values of biological index of fertility, total enzyme activity index and geometric mean of enzyme activities indexes showed that the best quality of soil was produced by a 2% addition of wheat straw biochar.
K e y w o r d s: biochar, soil, enzymatic activity, microorga- nisms, soil quality indexes
INTRODUCTION
In recent years, the quality and health of soil fertilized with biochar has been of great interest to a wide range of scientists around the world (Vithanage et al., 2018).
Although the boundary between the two concepts is not
clearly defined, it is assumed that “soil quality” refers to
the soil’s ability to perform certain functions, while “soil health” refers to its overall state (Tian et al., 2016; Liu
et al., 2017). Despite the significant number of scientific
papers describing the effect of biochar on the soil, only a small proportion of them estimate and quantify the quali-
ty parameters of the soil. This probably reflects not only the difficulties in finding appropriate, integrated quantita -tive indicators for the assessment of soil quality, but also
the ability to interpret them. This problem could be solved
by aggregating data concerning the chemical, physical, and biological properties of soil in the form of numerical
indexes, which include, among other factors, the geomet -ric mean of enzyme activities (GMea), the biological index
of fertility (BISF), and the integrated total enzyme activity index (TEI) (Paz-Fereiro et al., 2012; Tan et al., 2014). The
determination of the enzymatic activity constituting the
core of each of these indexes and the microbiocenotic com -position of soil is one of the most rapid and sensitive ways of indicating the natural and anthropogenic changes in the
soil (Gul et al., 2015; Mierzwa-Hersztek et al., 2017; Liu
et al., 2017). Firstly, soil enzymes are measures of the
acti-vity of microorganisms involved in biochemical processes, such as the mineralization and synthesis of organic sub-stances, as well as the circulation of nutrients (Gul et al.,
2015; Tian et al., 2016). Secondly, a significant volume of
research indicates that changes in the physical and chemi-cal properties of soil have an effect on enzymatic activity, and that quantitative and qualitative changes in microbial
populations have a significant impact on the functional integrity of soil (Khadem and Raiesi, 2017; Beheshti et al., 2018). These changes have a direct impact on the liv -ing conditions of plants, which in turn affects the quantity
and quality of the biomass obtained. For this reason,
stu-dies on soil that involve methods based on enzymatic tests and the assessment of microbiological composition allow
for a comprehensive verification of changes that take place
in soil after fertilization, including fertilization with bio-char (Ameloot et al., 2013; Vithanage et al., 2018). Due to
its unique properties, biochar is considered to be a perfect
source of mineral substances. The addition of biochar to the soil may lead to significant changes in the structural and
functional diversity of the microbial population, and thus
affect their activity.
However, data concerning the effect of different types of biochar on the activity and abundance of soil
microor-ganisms are still limited and contradictory. A study was
conducted to evaluate the effect of 1 and 2% additions
of wheat (WSB) and Miscanthus giganteus (MSB) straw
biochars on: soil enzymatic activity (dehydrogenases,
ure-ase, acid and alkaline phosphatase) and the number of soil microorganisms. An additional aim was to explore the rela -tionships between soil enzyme activities and chemical and
microbiological properties using three different indexes:
TEI, BISF, and GMea.
MATERIALS AND METHODS
The biochars were produced from miscanthus and wheat straws, which were previously dried at ambient
tem-perature, ground in a laboratory mill (mesh size of 4 mm), and mixed to ensure homogeneity. The straws were pyro -lysed in an electric laboratory furnace at 300°C for 15 min
under a limited supply of air (IBI, 2014).
The pot experiment was carried out in the greenhouse
of the University of Agriculture on soil with a loamy sand
texture collected from the 0-0.2 m layer. The experiment
consisted of 6 treatments carried out in 3 replications: 0
– control soil (soil without additives), MF – soil with the
addition of pure mineral salts, WSB – soil with the addition
of mineral salts (MF) and wheat straw biochar of 1% (WSB 1%) and 2% (WSB 2%), and MSB - soil with the addition of mineral salts (MF) and miscanthus straw biochar of 1% (MSB 1%) and 2% (MSB 2%). The nutrients were intro -duced into the soil as mineral salts at the following doses:
0.10, 0.04 and 0.12 g kg-1 DM of soil, for N (ammonium nitrate – NH4NO3), P (monocalcium phosphate monohy -drate – Ca(H2PO4)2H2O) and K (potassium chloride – KCl),
respectively. After the application of biochars and mineral salts and mixing them with the soil, the seeds of perennial ryegrass were sown. During the experiment, the humidity
of the soils was maintained at a constant level of 45% of
the WHC. Soil for microbiological and biochemical analy -ses was collected 6 months after biochar application and stored at 4 °C for biological analysis and at 25°C for phy-
sicochemical analysis.
The following parameters were determined for the soils and biochars: pHKCl and pHH2O using the potentiometric
method, electrical conductivity (EC) which was measured
conductometrically, the content of total nitrogen (Ntotal) and carbon (Ctotal) using a CNS analyser (Vario MAX Cube,
Elementar Analysensysteme, GmbH, Germany). The total
content of trace elements in the soil and biochars was deter-mined using the ICP – OES method on the Perkin Elmer
Optima 7300DV apparatus according to the methodology
described in an earlier study by Mierzwa-Hersztek et al.
(2017). The specific surface area (SBET), pore volume and diameter of the biochars were determined using the multi-function accelerated surface area and porosimetry analyser
ASAP 2010 (Micrometics, USA).
The measurement of the soil biological activity included
the number and enzymatic activity of soil microorganisms.
The evaluation of the number of selected groups of soil microorganisms was carried out using the serial dilution method developed by Koch with a number of
microbio-logical substrates. The following groups of microorganisms
were determined: bacteria (Trypticasein Soy Lab Agar,
BTL, Poland, grown at 37ºC, for 24 h), mould fungi (Malt Extract Agar, BTL, Poland, grown at 28ºC, for 5 days) and
actinomycetes (Actinomycete Isolation Lab Agar, Biocorp,
Poland, grown at 28ºC, for 7 days). The number of colony-forming units (CFU) of microorganisms was determined by the dilution culture method.
The evaluation of dehydrogenase (EC 1.1.1.1) activity was performed using the method of Thalmann (1968), ure
-ase (EC 3.5.1.5) activity by the Zantua and Bremner (1975) method and acid and alkaline phosphatase (EC 3.1.3.1) activities with the Allef and Nannipieri (1995) method. In
order to integrate the information obtained and to compare
data, three different indexes were calculated. The integrat -ed TEI index was calculated using the following Eq. (1)
(Tan et al., 2014):
, (1)
where: Xiis the activity of the soil enzyme i and Xiis the
mean activity of enzyme 𝑖 in all samples.
The geometric mean of enzyme activities (GMea)
was calculated using a method discussed elsewhere
. (2)
The BISF index was calculated as follows (Bastida et al., 2008):
. (3)
where: Mf – number of mould fungi (×10-3CFU g-1 DM),
Act – number of actinomycetes (×10-3 CFU g-1 DM), C org
– organic carbon content (g kg-1), CEC – cation exchange
capacity (mmol(+) kg-1).
The differences between treatments were evaluated using a one-way analysis of variance (ANOVA, Duncan
test, p ≤ 0.05). The variation within treatments was deter
-mined by calculating the standard deviation (± SD). The correlation coefficients between the chemical and biologi -cal properties of soil were -calculated using Spearman’s
nonparametric test. All statistical analyses were performed using Statistica PL 13 software (StatSoft Inc.).
RESULTS AND DISCUSSION
The soil used in the experiment was slightly acidic
pHH2O (5.67) and had a relatively low Ctotal (6.43 g kg-1) and Ntotal (0.54 g kg-1) content. The biochars applied in the ex-periment had similar values of pHH2O (WSB: 6.52 and, and
MSB 6.28), EC (WSB: 378 µS cm-1, and MSB: 345 µS cm-1), and Ctotal content (WSB: 628 g kg-1, and MSB: 651 g kg-1).
In contrast to miscanthus straw biochar, wheat straw
bio-char (WSB) had a larger specific surface area SBET, and a higher content of Ntotal. A more detailed description of the biochars used is given in Mierzwa-Hersztek et al. (2017).
The dose of biochar is considered one of the main fac-tors determining the effectiveness of this material in the process of changing soil properties (Tian et al., 2016). The
application of WSB and MSB biochars to the soil at 1%
and 2% doses significantly (p ≤ 0.05) increased the soil pH
compared to the treatment which was only fertilized with
mineral salts (MF) (Table 1), however, changes in the pH were more definite in combination with a WSB biochar. Treatment with mineral salts (MF) significantly decreased soil reaction (pH) against all other treatments, including the control treatment (Table 1). Lošák et al. (2012) described the effect of mineral fertilizers on soil reaction changes. The value of CEC significantly increased (by 85%) only
after the MSB 2% treatment and was 130 mmol(+) kg-1. The content of Ctotal and Ntotal also increased relative to the
applied doses of WSB and MSB biochars. Compared to the MF treatment, the Ctotal content after WSB and MSB
treat-ments applied at 1 and 2% doses increased by: 86, 146, 79,
139%, respectively, while the Ntotal content increased by:
22, 41, 10, 16%.
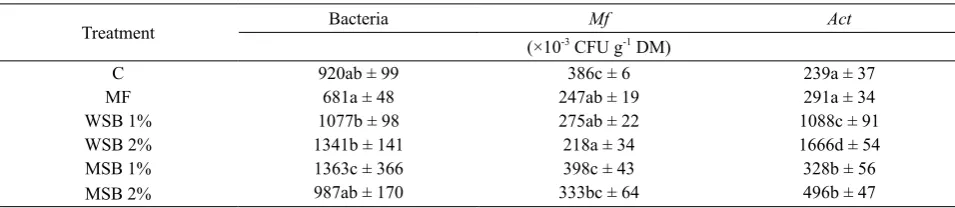
WSB and MSB application significantly affected the
abundance of microbial groups and the patterns of the
microbial community (Table 2). The dominant group of
microorganisms were bacteria, as their numbers peaked in
Table 1. Selected soil properties after 6 months of the experiment
Treatment pH H2O EC (µS cm-1) CEC (mmol(+)
kg-1) Ctotal (g kg-1) Ntotal (g kg-1)
C 5.94b ±0.24 34.7a ±6.35 59.1a ±7.34 5.70a ±0.13 0.45a ±0.03
MF 5.52a ±0.08 56.0b ±3.00 70.4b ±10.8 5.86a ±0.23 0.49ab ±0.03
WSB 1% 6.09bc ±0.17 70.7c ±6.11 77.0b ±8.00 10.9b ±1.36 0.60c ±0.06
WSB 2% 6.31c ±0.09 82.0c ±1.42 80.2b ±6.61 14.4c ±1.42 0.69d ±0.02
MSB 1% 5.83b ±0.14 56.0b ±2.95 74.5b ±1.47 10.5b ±0.48 0.54c ±0.01
MSB 2% 5.91b ±0.15 45.0ab ±2.00 130c ±10.5 14.0c ±1.47 0.57c ±0.03
Each value represents the mean of three replicates ± standard deviation; mean values marked with the same letters in the column do not differ significantly according to Duncan’s test at p ≤ 0.05, factor: fertilization, C – control (soil without additives), MF – mineral fertilization (NPK),WSB 1% and WSB 2% – NPK + wheat straw biochar of 1 and 2%, respectively, MSB 1% and MSB 2% – NPK + miscanthus straw biochar of 1 and 2%, respectively.
Table 2. Average number of microorganisms in soil after the application of biochars
Treatment Bacteria Mf Act
(×10-3CFU g-1 DM)
C 920ab ± 99 386c ± 6 239a ± 37
MF 681a ± 48 247ab ± 19 291a ± 34
WSB 1% 1077b ± 98 275ab ± 22 1088c ± 91
WSB 2% 1341b ± 141 218a ± 34 1666d ± 54
MSB 1% 1363c ± 366 398c ± 43 328b ± 56
MSB 2% 987ab ± 170 333bc ± 64 496b ± 47
the soil with the addition of MSB 1%. The pH (r = 0.49, p ≤ 0.05), C content (r = 0.51, p ≤ 0.05) and N content (r = 0.58; p ≤ 0.05) (Table 3) mainly affected the number of bacteria. A positive correlation between the number of
microorganism populations and pH as well as the C and N contents was also demonstrated by Khadem and Raiesi
(2017). Compared to the MF treatment, the number of actinomycetes also significantly (p ≤ 0.05) increased after
the application of both doses of WSB and MSB biochars; however, the effect of wheat straw biochar was more
pro-nounced, regardless of the dose applied. The addition of
WSB biochar increased the number of actinomycetes by
231% (WSB 1%) and by 236% (WSB 2%) compared to treatments with various doses of MSB applied. The cor -relation analysis between the number of actinomycetes and
the chemical parameters of the soil showed the significant effect of pH (r = 0.59, p ≤ 0.05), EC (r = 0.61, p ≤ 0.01) and CEC (r = 0.57, p ≤ 0.05), however it had the greatest effect
on the content of Ntotal (r = 0.76; p ≤ 0.001) and Ctotal (r =
0.85, p ≤ 0.001). The opposite effect of biochar was noted
in the case of fungi, a greater number of these microorga- nisms was determined for soils with the addition of MSB
biochar (Table 2).
The biological processes shaping soil fertility and pro-ductivity are mainly connected with the activity of soil microorganisms translating into the number of enzymes produced (Beheshti et al., 2018). Changes in enzyme activ
-ity reflect the trends in soil biochemical processes as well as
all transformations related to soil biology and its physical
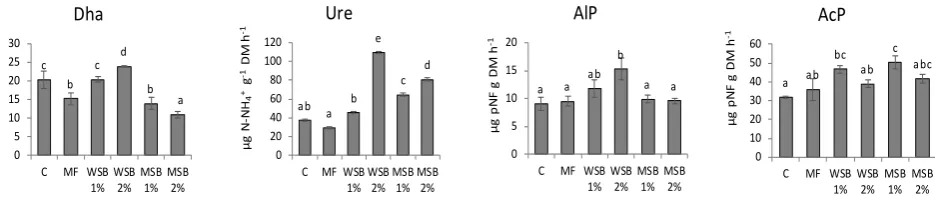
and chemical properties. The activity of each of the four
enzymes associated with the C, N and P cycles, analysed
in our study are shown in Fig. 1. The highest activity level of dehydrogenase (DhA), urease (Ure) and alkaline phos
-phatase (AlP) was observed in soil with a 2% addition of WSB. Compared to the MF treatment, the DhA activi-ty significantly increased only in treatments with a 1 and 2% addition of WSB (by 34 and 58%, respectively). The addition of MSB, especially at a 2% dose, significantly reduced the DhA activity. In the case of Ure, a significant (p ≤ 0.05) increase in the enzyme activity was observed
in each treatment amended with biochars – relative to the
amount of biochar applied. The Ure activity was mainly dependent on the C (r = 0.90, p ≤ 0.001) and N (r = 0.83, p ≤ 0.001) content in the soil (Table 3). The results obtained confirm the conclusions of other authors who observed
both the positive (Tian et al., 2016; Mierzwa-Hersztek et al., 2017; Vithanage et al., 2018) and negative (Lammirato
et al., 2011; Ameloot et al., 2013) impact of biochar on soil enzymatic activity.
As in the case of DhA, the AlP activity significantly
increased only in the soil amended with WSB, as opposed
to the results of the MF treatment (Fig. 1). In the case of
AcP, a more substantial positive effect was observed at the
lowest dose (1%) of both biochars and the activity of this enzyme increased by 30% and 40%, respectively. We also
demonstrated that a 2% addition of WSB and MSB biochar
decreased the activity of AcP by 17% on average compared to the soil with a 1% addition of these materials. In the Table 3. Spearman’s correlation coefficients between the selective soil chemical and biological properties (n=3)
Parameter B1 Mf 2 Act3 DhA Ure AlP AcP GMea BISF TEI
pH 0.49* -0.16 0.59* 0.58* 0.60** 0.70** 0.06 0.65** 0.77*** 0.72***
EC 0.28 -0.56 0.61** 0.15 0.43 0.32 0.35 0.47* 0.48* 0.39
CEC 0.27 -0.12 0.57* -0.35 0.61** -0.08 0.54* 0.31 0.58* 0.29
Ctotal 0.51* -0.18 0.76*** 0.85*** 0.90*** 0.33 0.49* 0.73*** 0.79*** 0.69**
Ntotal 0.58* -0.41 0.85*** 0.21 0.83*** 0.51* 0.46 0.79*** 0.76*** 0.85***
Bold values statistically significant at the: *p ≤ 0.05 level, **p ≤ 0.01 level, ***p ≤ 0.001 level. 1Bacteria, 2Mould fungi, 3Actinomyces.
c b
c d
b a
0 5 10 15 20 25 30
C MF WSB
1% WSB2% MSB1% MSB2%
µg
TP
F g
-1D
M h
-1
Dha
ab a b
e
c d
0 20 40 60 80 100 120
C MF WSB
1%WSB2%MSB1%MSB2%
µg
N
-N
H4 + g
-1
DM
h
-1 Ure
a a ab
b
a a
0 5 10 15 20
C MF WSB
1% WSB2% MSB1% MSB2%
µg
p
N
F g
D
M h
-1
AlP
a ab
bc ab
c abc
0 10 20 30 40 50 60
C MF WSB
1% WSB2% MSB1% MSB2%
µg
p
N
F g
D
M h
-1
AcP
study of Demisie and Zhang (2015), the application of oak
wood biochar and bamboo biochar at the same doses (1 and
2%) did not significantly increase the phosphatase activity. However, these authors found significantly higher values
of phosphatase activity in the analysed soils (from 115 to
149 µg pNPg-1 DM h-1). These differences may be due to the C and N content and the pH and CEC of the soil, as phos-phatases are very sensitive to changes in these parameters
(Paz-Ferreiro et al., 2012). This theory was also confirmed by the correlation analysis in our studies (Table 3).
The importance of using indexes to determine soil
qua-lity was already highlighted 10 years ago, among others, by Bastida et al. (2008). Multi-parameter indexes are recom -mended to assess the effect of the method of fertilization used on changes in the edaphic environment, because they are less sensitive to seasonal and spatial variations
(Paz-Ferreiro et al., 2012; Vithanage et al., 2018). The following three integrated indexes were used in our study: GMea,
BISF and TEI, taking into account the enzymatic activi-
ty of the analysed soils. The geometric mean of enzyme
activities (GMea) calculated in our study shows that the use of both types and doses of biochars significantly increased the soil enzymatic activity (Fig. 2). However, the applica -tion of WSB biochar was much more advantageous for the
soil. Lower GMea values and a significantly lower number of all microorganisms (Table 2) for soils with the addition
of MSB suggest that the use of this type of biochar has a much lower impact on the biological parameters of the
soil. This may be due to the lower content of nutrients in MSB, such as nitrogen, or their lower availability. The bio
-logical index of soil fertility (BISF) allows for the estimation
of the effect of fertilization on the quality of the soil, and
the integrated total enzyme activity index (TEI) allows for
a straightforward comparison between the combined enzy-
me activity and the quality of each soil sample. The obtained
values of BISF for soil from individual treatments ranged
from 87.5 (MF) to 150 (WSB 2%), and values of TEI from
3.10 (MF) to 5.52 (WSB 2%). The calculated BISF values, which take into account various biological and chemical parameters, and the TEI values confirmed that after the
addition of WSB the soil had significantly better fertility than the soil fertilized with MSB biochar. According to Tan
et al. (2014), TEI is usually positively correlated with the
content of C and N, which was also confirmed in our study (Table 3). The analysis of soil properties confirmed the more beneficial effect of WSB on the N content. This also
resulted in a reduced C:N ratio in treatments with WSB,
which undoubtedly promoted the intensified mineralization of organic substances and the release of mineral forms of N.
The values of GMea, TEI and BISF indexes also signifi
-cantly depended on soil pH.
Our results indicate that the interaction of many
fac-tors greatly influence the effect of biochar on the enzymatic activity of the soil and its microbiocenotic composition. Due to their different specific surface areas SBET, the size and diameter of pores, as well as chemical composition, the biochars used had different effects on soil properties, which was also observed by Tian et al. (2016) and Vithanage et al. (2018). However, there is still a lack of comprehensive
reports concerning the dynamics of changes and the effect of biochar addition on changes in the amount and activity
of soil microorganisms.
CONCLUSIONS
1. It was demonstrated that both the type and the dose of the biochars used had a significant effect on the biological activity of the soil. The response of the soil microorganisms differed in relation to the type of parameter tested.
2. The application of wheat and Miscanthus giganteus
straw biochars significantly affected the abundance of
microbial groups and the patterns of the microbial
commu-nity; a significant increase in the number of bacteria and
actinomycetes was observed after the application of wheat
straw biochar.
3. The type of biochar added had another significant
effect on soil enzymatic activity; the highest degree of activity was determined for soil with the addition of wheat
straw biochar.
a a
c d
b b
0 50 100 150 200 250 300 350
C MF WSB
1% WSB2% MSB1% MSB2%
%
BISF
b a
d e
cd c
0 1 2 3 4 5 6
C MF WSB
1% WSB2% MSB1% MSB2%
TEI
b a
d e
cd c
0,00 0,05 0,10 0,15 0,20 0,25 0,30 0,35 0,40
C MF WSB
1% WSB2% MSB1% MSB2%
GMea
4. The values of the biological index of soil fertility,
total enzyme activity and geometric mean of enzyme acti
vities indexes showed that the best soil quality resulted from a 2% addition of wheat straw biochar.
Conflict of interest: The Authors do not declare any
conflict of interest.
REFERENCES
Allef K. and Nannipieri P., 1995. Methods in applied soil micro-biology and biochemistry (enzyme activites). Academic Press, London, UK.
Ameloot N., Neve S.D., Jegajeevagan K., Yildiz G., Buchan D., Funkuin Y.N., Prins W., Bouckaert L., and Sleutel S., 2013. Short-term CO2 and N2O emissions and microbial properties of biochar amended sandy loam soils. Soil Biol. Biochem., 57, 401-410. https://doi.org/10.1016/j. soilbio.2012.10.025
Bastida F., Zsolnay A., Hernández T., and García C., 2008. Past, present and future of soil quality indices: a biological perspective. Geoderma, 147, 159-171. https://doi. org/10.1016/j.geoderma.2008.08.007
Beheshti M., Etesami H., and Alikhani H.A., 2018. Effect of different biochars amendment on soil biological indicators in a calcareous soil. Environ. Sci. Pollution Res., 1-10. https://doi.org/10.1007/s11356-018-1682-2
Demisie W. and Zhang M., 2015. Effect of biochar application on microbial biomass and enzymatic activities in degraded red soil. Afr. J. Agricult. Res., 10(8),755-766. https://doi. org/10.5897/ajar2013.8209
Gul S., Whalen J.K., Thomas B.W., Sachdeva V., and Deng H.Y., 2015. Physico-chemical properties and microbial responses in biochar-amended soils: mechanisms and future directions. Agric. Ecosyst. Environ., 206, 46-59. https://doi. org/10.1016/j.agee.2015.03.015
IBI, 2014. Standardized Product Definition and Product Testing Guidelines for Biochar that Is Used in Soil. http://www.bio -char-international.org/characterizationstandard
Khadem A. and Raiesi F., 2017. Responses of microbial perfor-mance and community to corn biochar in calcareous sandy and clayey soils. Appl. Soil Ecol., 114, 16-27. https://doi. org/10.1016/j.apsoil.2017.02.018
Lammirato C., Miltner A., and Kaestner M., 2011. Effects of wood char and activated carbon on the hydrolysis of
cello-biose by b-glucosidase from Aspergillus niger. Soil Biol. Biochem., 43, 1936-1942. https://doi.org/10.1016/j. soilbio.2011.05.021
Lošák T., Čermák P., and Hlušek J., 2012. Changes in
fertiliza-tion and liming of soils of the Czech Republic for the last 20 years. Arch. Agron. Soil Sci., 58, 238-242.
Liu X., Guo K., Huang L., Ji Z., Jiang H., Li H., and Zhang J., 2017. Responses of absolute and specific enzyme activity to consecutive application of composted sewage sludge in a Fluventic Ustochrept. PLoS ONE 12(5), e0177796. https://doi.org/10.1371/journal.pone.0177796
Mierzwa-Hersztek M., Gondek K., Klimkowicz-Pawlas A., and Baran A., 2017. Effect of wheat and miscanthus straw biochars on soil enzymatic activity, ecotoxicity, and plant yield. Int. Agrophys., 31, 367-375. https://doi.org/10.1515/ intag-2016-0063
Paz-Ferreiro J., Gascó G., Gutierrez B., and Mendez A., 2012. Soil biochemical activities and geometric mean of enzyme activities after application of sewage sludge and sewage sludge biochar to soil. Bil Fertil Soils, 48, 511-517. https:// doi.org/10.1007/s00374-011-0644-3
Tan X., Xie B., Wang J., He W., Wang X., and Wei G., 2014. County-scale spatial distribution of soil enzyme activities and enzyme activity indices in agricultural land: implica-tions for soil quality assessment. The Scientific World J., ID 535768, https://doi.org/10.1155/2014/535768
Tian J., Wang J., Dippold M., Gao Y., Blagodatskaya E., and Kuzyakov Y., 2016. Biochar affects soil organic matter cycling and microbial functions but does not alter microbial community structure in a paddy soil. Sci. Total Environ., 556, 89-9. https://doi.org/10.1016/j.scitotenv.2016.03.010 Thalmann A., 1968. Methods of dehydrogenase activity
determi-nation with triphenyltetrazoliumchlorid (TTC) (in German). Landwirtsch. Forsch, 21, 249-258.
Vithanage M., Bandara T., Al-Wabel M.I., Abduljabbar A., Usman A.R.A., Ahmad M., and Ok Y.S., 2018. Soil enzyme activities in waste biochar amended multi-metal contaminated soil; effect of different pyrolysis tempera-tures and application rates. Communications in Soil Science and Plant Analysis, 49(5), 635-643. https://doi.org/10.1080 /00103624.2018.1435795