Clark, J. and Manning, L. 2017. What are the factors that an opportunity sample of UK students insinuate as being associated with their wastage of food in the home setting? Resources, Conservation and Recycling, 130, pp.20‐30.
What are the factors that an
opportunity sample of UK students
insinuate as being associated with
their wastage of food in the home
setting?
by Clark, J. and Manning, L.
Copyright, Publisher and Additional Information: This is the author accepted manuscript. The final published version (version of record) is available online via Elsevier
Please refer to any applicable terms of use of the publisher.
DOI: https://doi.org/10.1016/j.resconrec.2017.11.005
1
What are the factors that an opportunity sample of UK students insinuate as being
1
associated with their wastage of food in the home setting?
2 3
Jessica Clark and Louise Manning1
4 5
Department of Food Science and Agri-food Supply Chains
6 7
Harper Adams University, Newport, Shropshire, TF10 8NB
8 9
(1) corresponding author [email protected]
10 11
Abstract
12
The aim of this research was to investigate the factors that influence student awareness and
13
behaviour associated with food waste. The study is exploratory in nature and the qualitative
14
research approach contextualises personal accounts of food waste awareness and behaviour.
15
Semi-structured interviews were undertaken with students (n=50) from 12 households, who
16
were enrolled at a UK university. Qualitative data was collected and thematically analysed
17
using Microsoft NVivo 11 and a thematic map developed to firstly postulate how students’
18
awareness and behaviour associated with food waste is influenced and secondly to support
19
further study in this area. In order to tackle the issue of students’ food waste, measures to
20
increase awareness of food waste and improving design of kitchen environments should be
21
adopted. However the latter is often not possible in short-term rented accommodation. The
22
research contributes to the existing area of research and provides additional evidence for the
23
factors that influence students’ food waste behaviour.
24
Keywords: food, waste, consequences, awareness, student, resources, behaviour
25
Highlights
26
• Fifty students interviewed in twelve households about their food waste practice.
27
• Multiple factors of influence including: habits, awareness, and social influences.
28
• Measures to increase awareness and improve kitchen design should be adopted.
29 30
1. Introduction
31 32
Global food waste is estimated to be 1.6 billion tonnes annually of which 1.3 billion
33
tonnes is edible with a value of $750 billion (FAO, 2017). This scale of food waste impacts
34
society, the environment and the wider economy, in a world that is already struggling to feed
2
the population. Global food production will need to increase by 50-70% to feed the 9.3 billion
36
people living on the planet by 2050, whilst natural resources are becoming ever more scarce
37
(Bond et al. 2013). Consequently, food supply chains need to become more sustainable from
38
farm to fork, including by reducing existing levels of personal food waste. Food safety scares
39
too can also have a major impact on supply chain food waste: for example, a Salmonella
40
warning caused 32% of American tomatoes to be unharvested in 2008 (Gunders, 2012).
41
Total United Kingdom (UK) household food waste levels increased from 7 million
42
tonnes in 2012, to 7.3 million tonnes of food in 2015 at a monetary value of £13 billion per
43
annum. Avoidable UK household food waste reduced by 21% between 2007 and 2012
44
(Smithers, 2017) then increased by 5.1% to 4.4 million tonnes in 2015 (Quested and Parry,
45
2016). Individuals may not realise the impact that food waste has on the economy, the
46
environment, and society often thinking because food is natural, and it simply rots into the
47
ground (Doron, 2013). Domestic food waste largely ends up in landfill sites (Quested and
48
Parry, 2011), where space is becoming increasingly scarce, especially as communities do not
49
want new landfill sites a given area, due to environmental and aesthetic concerns (Barr,
50
2004). When food is placed into landfill the resources associated with the food are lost
51
(Doron, 2013), including in the UK, 5,400 million cubic metres of water annually (Quested
52
and Parry, 2011). In addition, methane, a potent greenhouse gas, that is 23 times stronger in
53
terms of the environmental impacts than CO2, is produced when food starts to rot into the
54
ground (Thermelis and Vlloa, 2007), whilst 19 million tonnes of CO2 is produced when
55
manufacturing, distributing, storing and disposing of avoidable food waste (Doron, 2013).
56
Literature suggests two main motivators to encourage individuals to reduce food waste
57
namely environmental concerns (Doron, 2013) and the monetary value associated with
58
food waste (Lyndhurst, 2007; Graham-Rowe et al. 2014). These factors are important when
59
considering the policy campaigns that have been developed to influence personal behaviour.
60
Since 2009, a series of campaigns have been launched in the UK, by the government and
61
supermarkets, with the aim of trying to reduce food waste levels (Quested and Parry, 2016).
3
In 2005, the UK government launched the Courtauld Commitment, which is a voluntary
63
agreement between major suppliers, manufacturers and supermarkets to improve resource
64
efficiency and reduce waste. Subsequently, four stages of the agreement have been launched
65
with future targets for 2025 to reduce food and drink waste by 20% (WRAP, not dated). In
66
2007, the UK government ‘Love Food Hate Waste’ (LFHW) campaign aimed to reach two
67
audiences: firstly, the 15 million adults who are already aware, but need help in reducing the
68
amount they waste, and secondly the remaining population who were identified as not being
69
aware of food waste issues (Quested et al. 2012). It is difficult to determine the contribution
70
of such campaigns to reducing food waste, because other concurrent socio-economic issues,
71
can also play a part in food waste reduction. However recent research has suggested that
72
appropriately targeted campaigns are of value (Schmidt, 2016; Delley and Brunner, 2017).
73
The UK recession (2008 – 2012) caused food prices to rise by 14% whilst consumer income
74
stayed static (Quested and Parry, 2011). As households had less disposable income,
75
consumers started to pay more attention to perishable products like meat, as they could not
76
afford to waste food (Quested and Parry, 2011; Miller and Branscum, 2012). Arguably this
77
economic factor may have contributed to food waste reduction between 2007–2012, as
78
equally as the impact of the LFHW campaign.
79
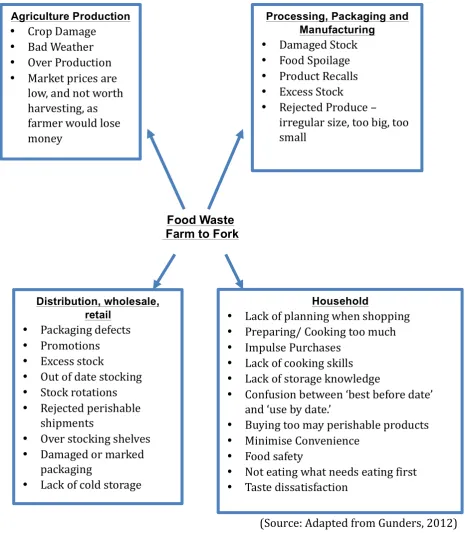
Food loss occurs at all stages of food production (Figure 1), but the further down the
80
supply chain the food travels from the farm, the more costly it becomes to waste food as
81
greater value has been added, both in monetary and environmental terms. This makes
82
consumers and food retailers the most impactful food wasters in cost, society and
83
environmental terms (Eriksson et al. 2015). Figure 1 illustrates the potential factors that
84
contribute to the loss of food at different stages along the food supply chain.
85
Take in Figure 1
86 87
The literature demonstrates clearly that food waste is a global problem and a national problem
88
too in the UK and that unless action is taken to engage individuals and encourage them to
4
modify their behaviour then the social, environmental and economic impact will continue
90
unchecked.
91
2. Food waste behaviour and its impact on the quantities of food wasted
92
Consumer food waste can be categorised into three different groups: avoidable,
93
possible avoidable and unavoidable (Quested and Johnson, 2009). Unavoidable food waste
94
includes inedible material that would not be consumed under normal conditions, for example,
95
egg shells, fruit stones or animal and fish bones. Possible avoidable food waste is the food
96
and drink material that some people eat, whilst others do not (Quested and Johnson, 2009:14).
97
Alternatively avoidable food waste is classed as any food and drink product that was once
98
edible, but now due to its current nature is no longer fit for consumption, such mouldy fruit
99
(Quested et al. 2012; Eriksson et al. 2015). Table 1 outlines over the time period between
100
2007 and 2015 the quantity of the three aforementioned categories of household food waste in
101
the UK.
102
Take in Table 1
103 104
The data shows a drop in avoidable food waste, but conversely a rise in unavoidable food
105
waste over the time period. Factors influencing the quantity of food waste at the retail level
106
that are within the scope of the business to address include: visual appearance of food at point
107
of sale, over ordering, baking too much, handling fresh produce incorrectly and undertaking
108
promotions on products that cause customers to over-buy when they are unlikely to consume
109
the product (Stenmarck et al. 2011). Customers favour choice with fully stocked shelves,
110
forcing supermarkets to over order and over stock, increasing the chances of food going out of
111
date (Stuart, 2009; Stenmarck et al. 2011; Wyman, 2014) Furthermore, when supermarkets
112
run promotions such as ‘buy one get one free’, consumers switch away from regularly
113
purchases, to promotional offers, causing a variance in demand and increasing the chance of
114
over purchase and subsequent spoilage (Quested et al. 2012; Wyman, 2014). Consumer
115
buying patterns depend on additional factors too such as the weather, season, offers and
5
moods (Stenmarck et al. 2011; Eriksson et al. 2015) and retailers need to consider this as part
117
of their customer offer in order to minimise food waste at retail level.
118
The ‘good provider’ describes individuals, who purchase large amounts of fruit and
119
vegetable and tend to overcook, as they feel they have failed if the family goes hungry, or
120
snacks on unhealthy food (Graham-Rowe etal. 2014; Quested and Luzecka, 2014; Mallinson
121
et al., 2016). ‘Food recipients,’ are those individuals who do not buy food for themselves and
122
live in the family home i.e. children and teenagers who, Graham – Rowe etal. (2014) argue,
123
are more likely to waste food, due to the lack of understanding of the monetary value of food.
124
Food waste in the family setting may also be in response to ‘children being fussy’. Parents
125
are more likely to follow use by dates1, as they are concerned with the microbial safety issues
126
surrounding food products (Quested and Luzecka, 2014).
127
The older generation, i.e. in their seventies and over, can be typed as the ‘waste
128
intolerators’. Theywaste 25% less food compared to the rest of the population. They lived in
129
households with no tolerance of food waste, using up all the scraps and leftovers during the
130
food rationing in the Second World War (Quested et al. 2013) and greater levels of education
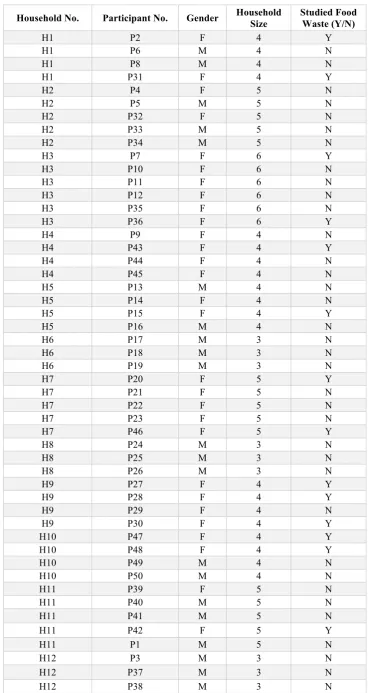
131
on food management and cooking (Godfray et al. 2010). This mindset has remained, even
132
though food is relatively cheaper than the past (Graham-Rowe et al. 2014). Conversely,
133
people lacking cooking skills and food storage knowledge are more concerned with the safety
134
risks involved with food, compared to those who do know how to cook and store food
135
correctly (Lyndhurst, 2007). The younger generation, i.e. aged 18-24, are said to be less
136
educated in terms of food, food storage and food waste, and scraps and leftovers are more
137
often thrown away due to them being perceived as being of little monetary value. Young
138
adults such as students, who have just moved out the family home, may not be able afford to
139
1The ‘best before’ date is associated with the quality (i.e. taste, texture, and aroma) and
6
waste food, so they should in theory have greater awareness of the monetary value of food
140
waste (Graham - Rowe et al. 2014). Conversely, other literature suggests that the younger
141
generation, aged 18-24, are the highest food wasters within society (Hamilton et al. 2005;
142
Lyndhurst, 2007; Principato et al. 2015; Mallinson et al. 2016). The literature highlighted a
143
duality in findings with regard to student behaviour and no previous literature has considered
144
UK students specifically. This presented as the research gap that this empirical work is
145
designed to address. This paper is structured as follows: firstly an introduction to the topic of
146
study. The methodology of the empirical study is then outlined followed by the results, and
147
analysis. Key themes are discussed and conclusions and recommendations provided for
148
further research.
149
3. Food waste and behaviours associated specifically with students
150
There have been a few studies on the topic of food waste and the younger generation
151
including Italian and Spanish students (Graham-Rowe et al. 2014; Quested and Luzecka,
152
2014; Principato et al. 2015; Mondéjar-Jiménez et al. 2016). Principato et al. (2015) in their
153
Italian study with students (n=230) found the greater knowledge students had of the issues
154
surrounding food waste, the greater the chance of changing behaviour. However, in the study
155
students struggled to identify the specific environmental, social and economic issues linked to
156
food waste. Conversely, Graham - Rowe et al. (2014) determined that with students the
157
monetary value of food waste was a motivator.
158
In a further study, 6% of students were confused between ‘best before,’ and ‘use by’
159
dates, and would throw the food away without a sensory evaluation (Principato et al. 2015).
160
Mondéjar-Jiménez et al. (2016) conducted an investigation to identify whether students in
161
Spain and Italy waste the same types of food. Table 2 shows the cultural difference in the
162
different types of food households waste on a weekly basis. For instance, on average Spanish
163
students wasted more white meat (14.75%) on a weekly basis than Italian students (7.36%).
164
Spanish students similarly wasted more convenience food (12.82%) per week on average
165
compared to Italian students in the study (2.94%). However, both countries, as with UK
7
households, waste more fruit, bread and vegetables than any other type of food (Caswell,
167
2008; Brown et al. 2014; Mondéjar-Jiménez et al. 2016).
168
Take in Table 2
169
The literature explored to provide context for this study has identified a number of
170
factors that may influence students’ food waste behaviour including: being time poor,
171
confused over duration dates and lacking awareness of the global issues related to food waste
172
Figure 2 provides a summary of these and other factors that influence students’ food waste
173
awareness, and behaviour.
174
Take in Figure 2
175
There is a body of literature on food waste in the school food service, and canteen setting
176
(Ryley et al., 1979; Nicklas et al., 2013; Cohen et al., 2014; Hanks et al., 2014; Liu et al.,
177
2016) and whilst this is not the focus of the study such studies indicate the challenges
178
associated with food waste and young people. Forty seven percent of 18-24 year olds in the
179
UK admit they lack knowledge when cooking and storing food in the kitchen (Sainsburys,
180
2016) and therefore are more likely to waste food when preparing, cooking and serving too
181
much. Universities in the UK are working with the LFHW campaign to help students when
182
they first move out of home, by giving advice on how to save money, gain greater skills in the
183
kitchen with simple recipes cards and advice on how to reduce food waste (Quested and
184
Luzecka, 2014), but students’ awareness may not necessarily translate into actual behavioural
185
action. Awareness is defined for the means of this research as an individual’s level of
186
knowledge, concern or interest in food waste and is a particular focus in this study.
187
4. Methodology
188
The aim of this research was to investigate the factors that frame student awareness and
189
behaviour associated with food waste. The study is exploratory in nature and the qualitative
190
data derived serves in terms of contextualising personal accounts of food waste awareness and
191
behaviour. The unit of analysis is therefore “the student”, although the rationale for the
192
research recognises that the student does not exist in isolation, but is also influenced by the
8
household in which they live in terms of both its facilities, and also the other individuals in
194
the household. Thus, in analysing the results it is important to consider that the units of
195
analysis are not independent as social factors at the household level may have an influence.
196
This issue of interdependence means that qualitative rather than quantitative methods were
197
used in this research.
198
The methodology outlined here cannot be considered to be grounded theory in its
199
purest sense as a literature review has been conducted prior to the data collection phase in
200
order to contextualise the research within existing knowledge (Cresswell, 2012), what is
201
important in developing theory and to formulate a research question which is of interest
202
namely:
203
What are the factors that an opportunity sample of UK students insinuate as being associated
204
with their wastage of food?
205 206
However, the methodology has rather than a forcing approach followed an emerging,
207
exploratory approach (Glaser, 1992) with the literature being used to position the research
208
rather than inform its design in an alternative positivist approach. Constructivist grounded
209
theory means that the researcher is not neutral and the reflexive researcher’s voice is thus
210
embedded within the methodology, through an active deliberation to prioritise primary data
211
analysis over and above the secondary data input via the literature (Ramalho et al., 2015).
212
4.1. Interview design
213
Semi-structured interviews were undertaken with students (n=50) who were enrolled
214
at a UK university living in 12 rented households, of between three and six people (Table 3)
215
to build a picture of the relationship between place, student awareness, behaviour and food
216
waste.
217
Take in Table 3
9
A limitation of the study is the use of self-reporting by students and self-reporting might not
220
correlate to actual behaviour so face-to face interviews rather than an on-line survey was used
221
to seek to partially mitigate this factor. Dai et al. (2015) propose that interviews are well
222
established qualitative methods suited to explore the importance of factors of influence where
223
these have a complex interaction providing validity to the data but not indicating their relative
224
contribution nor distribution across the whole population rather than the reproducibility of a
225
quantitative data collection approach.
226
227
228
229
The interviews were conducted between February-March 2017, with one interviewer and one
230
interviewee at a time to maximise comfort and to avoid stress, anxiety and discomfort, whilst
231
taking into consideration the participants’ body language as a means of improving the
232
researcher’s judgment on the response (Bryman and Bell, 2011). This approach also avoided
233
response bias where participants might change their statements as might have occurred if a
234
group interview approach had been used as individuals do not liked to be seen in a negative
235
light or as exhibiting the “wrong” social behaviour by peers (Edmunds, 1999). A relaxed
236
conversational approach was used, but still with an underlying purpose, direction and with
237
prepared high level questions to use as a prompt if needed (see Appendix 1). The interviews
238
were structured around six themes of potential influence that arose from the literature review
239
element of the methodology: buying habits, kitchen, duration dates, monetary value, social
240
consequences and environmental consequences. (This work included: Graham-Rowe et al.
241
2014; Principato et al. 2015; Quested and Luzecka, 2014; and Mondéjar-Jiménez et al. 2016).
242
All the interviews were recorded with the participant’s permission and lasted an
243
average of forty-five minutes. One pilot interview was conducted in order to refine and test
244
the semi-structured questions and to gain an understanding of the validity and reliability of the
245
data being collected (Saunders et al. 2012). No changes were made after the pilot interview so
246
it formed the first of the interviews undertaken. Before the interviews were conducted,
10
participants were required to read a brief containing details of the aim of the investigation, the
248
confidentiality of the results and a statement explaining that participants’ had the right to
249
withdraw at any point and any result would be removed from further consideration. If
250
participants agreed to continue, the consent form was signed (Ritchie and Lewis, 2013). To
251
ensure participant privacy and confidentiality, anonymous interview coding was in recording
252
and transcripts. Participants were coded with the number of the interview.
253
4.2. Interviewees and sampling procedure
254
The interviewees were identified through a sampling strategy to include households firstly
255
with a range of mixed gender and single gender either all male or all female households and
256
secondly households of different sizes (see Table 3). Recruitment was via opportunity
257
sampling.
258
4.3 Thematic analysis approach
259
Qualitative data was collected and transcribed for each interview. The interview transcripts
260
were coded to identify thematic categories associated with students’ awareness and behaviour
261
associated with food waste using NVivo version 11. Initial coding was undertaken and then
262
secondary, tertiary and fourth level ‘axial’ coding to identify connections between concepts
263
and organisation of these into higher order and lower order themes and to demonstrate
264
relationships between concepts at each coding stage (Bazely and Jackson, 2013). A thematic
265
map was developed to postulate how students’ food waste awareness and behaviour is
266
influenced and to inform further study and theory development in this area.
267 268
5. Results and Analysis
269
This results are considered and analysed by primary theme. Fifty eight percent of the
270
participants were females, 42% were males, and 72% of the participants had never formally
271
studied food waste at university. The full household demographics can be seen in Table 3.
272
4.1 Buying habits
11
Whether students cook and shop by themselves or as a household, is a key influence as to
274
whether a shopping list is written, in advance. 43% of students in the study, who cook by
275
themselves, do not write a shopping list, and 20% of students will only write a shopping list in
276
accordance to the size of the shop. Two example student comments are as follows showing
277
the variance in planning amongst the interviewees (P = participant number):
278
‘I just buy what I fancy when I am walking around the shop, I do not tend to follow a
279
shopping list, as [I] will never stick to it’ (P16).
280 281
‘If I am planning on doing a large shop, I will record down the essentials on my phone, but if
282
I was doing a small shop then no, as I can usually just about remember what I need’ (P31).
283 284
Thirty percent of students interviewed did write a weekly food shopping list, but 60% of those
285
students shop and cook as a household and therefore are more organised. One response
286
demonstrated this approach:
287
‘We do all sit down, do an inventory of the cupboards, freezer and fridge and write down
288
what we need, as there are more mouths to feed and food desires to meet.’(P24)
289 290
The literature demonstrates the value of pre-planning and then sticking to a list in order to
291
reduce food waste. Consumers are tempted by promotions and end up buying and wasting
292
more food than they actually need to (Quested et al. 2012). This was reinforced in this study
293
by 17% of students highlighting that they failed to follow a shopping list due to the temptation
294
of special offers. 22% of students interviewed stated they would buy foods on specials offer,
295
knowing that they might not ever use the product. This could explain why in previous studies
296
students spend 6% more on weekly shops than the older generation (Mondéjar-Jiménez et al.
297
2016), because they are more easily influenced by such offers. Indicative statements made
298
supporting this argument in this study included the following:
299
‘… I think its great value for my money, but when it sits in my cupboard for a long period of
300
time, I will throw them away, even if it’s still in date’ (P33).
301 302
‘I should follow a shopping list and try and stick to it, but I always get tempted by promotions
303
and discounts. For example, XXXX is closing down, and everything is reduced and half price,
304
but XXXX prices are so expensive especially for the quality. Anyway, as soon as I saw
305
everything reduced, I went a bit crazy and brought nearly the whole shop, as I thought I was
12
saving money. But my housemate pointed out to me that I did not really save much money, as
307
YYYY is still cheaper than XXXX discounted prices. So I got tricked there’ (P23).
308 309
Thus buying habits are a key behaviour that can influence student’ food waste.
310 311
5.2 Types of food wasted and influence of kitchen facilities
312 313
Analysis of the results of the interviews highlights that 38% of students stated that they cook
314
too much food; 32% did not use the food in time; 18% purchased too much food and 12%
315
were influenced by duration dates. When asked what types of food were thrown away58% of
316
students stated they wasted vegetables. This was for three main reasons: 17% of students
317
stated they buy too many varieties of vegetables on a weekly basis; 25% of students cook too
318
much quantity; and 58% of the students do not use the vegetables up in time before they
319
deteriorated e.g. through mould growth. Fruit was the second most wasted food product for
320
28% of students for two main reasons: 28% of students stated they buy too much on a weekly
321
basis and 72% of students do not use the fruit in time. Milk was the third product stated to be
322
wasted most often by 20% of respondents followed by pasta and potatoes both identified by
323
12% of respondents. In this primary research, none of the students stated bread was a source
324
of waste and the pattern of food waste in terms of the type of food was different to the other
325
student studies in the literature where fruit, vegetables and bread were the top three sources of
326
food waste as food wasted once a week (Caswell, 2008; Brown et al. 2014;
Mondéjar-327
Jiménez et al. 2016 see Table 4).
328
Insert Table 4
329 330
Thirty-one percent of food waste is attributed to households cooking and preparing too much,
331
and throwing away the left overs, instead of freezing or making it do for another meal
332
(Quested et al. 2012). Consequently appropriate portion size is important (Graham-Rowe et
333
al. 2014). The students in this study identified lack of freezer space as a factor that had a
334
direct impact on the level of food waste. 20% of students stated they spent more on their
335
weekly food bill, due to limited freezer space and having to for example:
13
‘[buy] smaller packets of food, like 2 chicken breast and not six, which is a lot more
337
expensive’ (P32).
338 339
‘I like a bargain when I see one, especially going out of date meat, as it can be really
340
expensive, but sometimes I am unable to buy it, as there is no freezer room available and I
341
know I won’t eat it during the week as I have other food to use up’ (P1).
342 343
‘...sometime I cook too much curry but there is enough for another meal, but I do not have the
344
room to freeze it, which means I have to have it the next day but I always fancy something
345
else, rather than leftovers. So the leftovers do eventually end up in the bin’ (P34).
346 347
The lack of appropriate kitchen facilities therefore influences behaviour. One respondent
348
explained
349
‘I have noticed, within our communally shops, [communal shopping as a household] we
350
waste less, as we always make sure whatever needs using in the fridge is used up first.
351
Compared to when we do our lunches separately, more food is thrown away, as individuals
352
will eat what they fancy rather than what needs using up. For example, my housemate had a
353
full bag of lettuce in the fridge that was just on turning point, but was still ok to eat, but it
354
needed using ASAP, but instead of making a sandwich or a salad, she chose to walk into town
355
and bought a XXXX [sandwich from a shop], as she couldn’t be bothered to make any lunch.
356
Then the next she day complained that her salad had gone off’ (P36).
357 358
Indeed, 46% of students in the study said that what they preferred to eat on a given food
359
occasion overcame their thoughts on the need to eat leftovers. This concurred with previous
360
research on consumption of leftovers by Lyndhurst, (2007).
361
5.3 Student awareness of duration dates
362
Research suggests that 13% of consumers believe food packaging has a role in the home, but
363
lack awareness of how packaging keeps produce fresh for longer, prevents dehydration and
364
provides valuable information on storage and cooking (Plumb et al. 2013). Principato et al.
365
(2015) suggest that those who have greater food knowledge, have a better chance to change
366
food waste behaviour. The primary research identified that half of the students interviewed
367
(50%) knew the difference between the two types of duration date coding. 22% of the
368
students interviewed did not know the difference between the two duration date systems and
369
28% of students acknowledged the ‘use by’ dates refers to the safety of the food product, but
370
had no understanding of the ‘best before’ date. Forty-six percent of students in the study will
371
throw away meat on the ‘use by’ date, due to their knowledge of increased risk of food
14
poisoning. At the same time these students do not follow the duration dates on fresh produce,
373
as they perceive there is a lower food safety risk.
374
‘I do not trust food after the duration dates on packaging, especially meat as I have had food
375
poisoning several times.’ (P14)
376 377
‘Depends on what it is. I do not follow dates of fruit and vegetables, as they will never give
378
you food poisoning, due to the risk of food poisoning. But on dairy products and meat I try
379
and make sure the food product is used in time, otherwise it goes in the bin as I do not want to
380
risk getting ill.’ (P32)
381 382
For 22% of students, this behaviour was identified as being down to parental influence as
383
shown in the next two indicative quotes:
384
‘I adopt all my cooking skills from my parents, and parents have always said do not eat meat
385
after the duration dates, due to the safety and increased risk of getting food poisoning’ (P20).
386 387
‘My parents have always told me to waste food when it comes to the use by date, especially
388
meat products, due to the risk of food poisoning. So I usually bin meat and dairy products on
389
the use by date, but things like vegetable I will just keep until they have started to turn
390
mouldy’ (P22).
391 392
This theme shows the link between an individual’s awareness and their associated food
393
behaviour.
394 395
5.4 Student awareness of monetary value of food waste
396
Thirty two percent of students questioned stated they were more inclined to waste fruit and
397
vegetables than other food items, as they believed them in terms of monetary value as being
398
cheap and readily available. On the other hand, the same proportion of students were less
399
inclined to waste meat.
400
‘…..You can go to XXXX and buy a bag of carrots for 40p, which, if you end up wasting them,
401
you are only wasting 40p which is not going to break the bank’ (P25).
402 403
‘If I knew the exact total amount of the monetary value of the food I waste I waste was, then
404
probably yes. But as the same food is so cheap today, you can pick up a bag of vegetables for
405
under a £1, so I am probably not wasting huge amounts of money’ (P34).
406 407
The awareness factors identified by the respondents that they used when considering the
408
monetary value of food waste was firstly that food was cheap;
409
‘if I was going to waste anything, I would waste the vegetables as they are the cheapest
410
component of a meal’ (P10).
411
15
12% of the respondents said it was difficult to visualise the monetary value of food waste
413
(concurring with Principato et al., 2015);
414
‘as the money has already gone out the bank account when the products are purchased in the
415
supermarkets…. it does not matter if the products are thrown in the bin...’ (P9).
416 417
28% of the students interviewed believed money was only wasted when huge portions of
418
food were thrown away in one sitting.
419
‘I know you are wasting money every time you throw food away, but when I waste small
420
amounts, like a handful of peas, then no I don’t believe you are, or it never crosses my mind.
421
As it is only worth 10p or something’ (P46).
422 423
‘Even though I am very conscious about the price of food when I go shopping, when I waste
424
food it never crosses my mind that wasting food is wasting money, as you only waste little bits
425
here and there, you are never wasting whole meals’ (P41).
426 427
Many interviewees failed to comprehend the accumulative monetary value of food waste
428
and were surprised how the value accrued over a monthly or on a yearly basis.
429
‘Wow, I have never thoughts about how much it all adds up to, and £162 is a lot of money for
430
throwing away in a year, as I could do so much more with that money, rather than just
431
throwing it in the bin’ (P32).
432 433
‘….I only waste small amounts of food. Maybe around £5 a week….. Wow £25 a month and
434
roughly £300 a year is a lot of money wasted of food waste. I have never thought about it like
435
that, as the £300 is not taken straight out of your account as a hump sum. Also you do not
436
even see the monetary value of food waste coming out of my account, as it is a part of your
437
grocery shop’ (P5).
438 439
‘I honestly didn’t think £5 a week was a lot, as I only waste small portions of cheap food here
440
and there. But when you put it like that I am wasting huge amounts of money that could be
441
better spent. Also when I waste food, I never perceive it as wasting money, as the money has
442
already left your bank account’ (P20).
443 444
These indicative comments demonstrate a lack of awareness of the impact of food waste and a
445
disconnect between the monetary impact associated with their levels of personal food waste.
446
Some respondents stated that saving money in itself was not necessarily a motivator to waste
447
less food:
448
‘Maybe if I run out of money.’ (P10)
449 450
‘Yes I guess it would be if I had no money…’ (P22)
451 452
‘If food becomes more expensive then yes.’ (P25)
16
The financial threshold that was a motivator to save money also varied between students and
455
for some saving two pounds a week was a motivator where for others it was not. The notion
456
of the influence of monetary value as a motivator for behavioural change with food waste is
457
worthy of further study as here the impact is unclear.
458
5.5 Student awareness of the environmental impact of food waste
459
The research indicates that students have a mixed degree of awareness of the environmental
460
consequences of food waste. Overall, 61% of students were conscious of the environmental
461
implications, especially those who had studied food topics as party of their university course.
462
Twenty-three percent of respondents in the study agreed with P1 that ‘Food is natural so
463
surely it just rots down into the ground’ supporting the findings of Doron (2013). Similarly,
464
22% of students concurred that ‘Food packaging ending up in landfills instead of being
465
recycled’ (P44) was the biggest environmental issue relating to food waste.
466
5.6 Student awareness of the social impact of food waste
467
The negative social impact of food waste are that if food is wasted this influences the balance
468
between supply and demand causing food prices to rise impacting those on a low income. 469
Conversely if surplus food is identified, collected and distributed to those who are food
470
insecure this can have a positive impact towards their lives both personally and at the
471
community level. An example of such social impact are the replacement of free school meals
472
during school holidays where parents cannot afford the cost of the lunch. As with
473
environmental impact, the social impact of food waste was not a strong motivator for the
474
students that were interviewed to influence behaviour. Fifty-four percent of respondents
475
lacked awareness and struggled to identify the social cost of food waste and only 14% firmly
476
associated the social implications of food waste behaviour with wasting food. Just under a
477
quarter of students mentioned people living in poverty or charities helping those in need, but
478
with a greater proportion believing that the world will not run out of food. Individual
479
indicative comments included:
17
‘The world population is expected to expand dramatically, but world food production will
481
have to increase by 40% to meet this demand. But also the fact there are thousands of families
482
and children in poverty who cannot afford food’ (P36).
483 484
‘Maybe in the very long term, vegetables may go back to seasonal, and with increased climate
485
change, there may be a shortage like we are seeing in Spain at the moment, but we will never
486
run out of food as there is always technology and 3D printing’ (P10).
487 488
‘I honestly do not know, they do say food production will have to increase to meet the
489
growing demand, but I personally do not think we will. I mean look how readily available it is
490
today and so much food is produced by technology. Maybe with the current climate change,
491
and food .. shortages, we may go back to seasonal produce, instead of all year round fruit and
492
vegetables. But the world will never run out of food’ (P23).
493 494
‘….technology forever increasing, like the development of 3D printers, and will save us if we
495
were going to run out of food’ (P26).
496 497
‘… there may be a shortages of fresh produce…..and fresh produce will become more
498
seasonal. But no, I don’t think the world will ever run out of food, have you seen how much
499
food is on the supermarket shelves and how much we import ’(P6).
500 501
Respondents highlighted some degree of optimism that technology would prevent food
502
shortages, but as a consequence of climate change, one third of respondents (32%) stated that
503
fresh produce would become more seasonal.
504
5.7 Primary motivators that influence food waste
505
In this study, not one student highlighted the environment as a primary motivator to
506
change food waste behaviour concurring in part with the work of Principato et al. (2015). The
507
world running out of food was identified as a factor of influence by one in ten of the
508
respondents in this study. The lack of motivation associated with social or environmental
509
concerns meant that for 34% of respondents saving money was the primary, albeit limited
510
motivator, especially when as a result of the interview process, they became more aware of
511
the monetary impact of their behaviour. The students interviewed could roughly estimate the
512
monetary value of their level food waste within a given week. Respondents were more
513
inclined to waste fruit and vegetables, due to their perception that they were of little monetary
514
value, but were less inclined to waste meat, as it was seen to be the most expensive part of
515
any meal.
18
After saving money, being more educated on the monetary value of food waste and a
517
rise in food price were identified as motivators to change behaviour. 16% of respondents said
518
that being too busy was a barrier to changing behaviour and reducing food waste. Sources
519
such as Quested and Luzecka (2014) suggest that the younger generation implied being too
520
busy and having more important priorities to worry about than changing food waste
521
behaviour. Additional factors were suggested in the interviews as potential ways to motivate
522
students to waste less food including: reduced pack size, single duration dates rather than the
523
current system of multiple duration codes, and improved food safety. Some of the
524
respondents’ indicative comments that underpin this summary of findings are collated (Table
525
5).
526
Take in Table 5
527 528
There was a full second, third and fourth level axial coding undertaken (Table 6) that
529
informed the development of a thematic map (Figure 3). The thematic map takes the six
530
themes of buying habits, kitchen facilities, student awareness of duration dates, monetary
531
value, environmental impacts and social impacts and adds a seventh theme of knowledge of
532
food in its wider sense.
533
Take in Table 6 and Figure 3
534 535
The thematic map that emerges from the synthesis and analysis of the primary data
536
explores the interconnection between factors of influence and student awareness and
537
behaviour associated with food waste found in the research. Figure 3 reflects the seven
538
superordinate factors of influence towards students’ food waste behaviour, and sub-ordinate
539
factors that influence student awareness such as parental or household influence, and
540
awareness of monetary, environmental or social impact. The implications of the findings of
541
this study are now discussed.
542
5. Discussion
19 544
Previous literature has considered both plate waste in the food service setting (Cohen et al.,
545
2014; Falasconi et al., 2015) and also individual households in the household level setting, the
546
unit of analysis for this study. Students were identified are most likely to waste food when
547
preparing, cooking and serving too much food leading food waste campaigns to focus solely
548
on tools such as recipe cards when trying to educate students (Quested and Luzecka, 2014).
549
However, the thematic map developed through this study demonstrates multiple, complex and
550
nuanced influences behind students’ food waste behaviour when purchasing, preparing,
551
cooking and serving their own food. At one level a lack of freezer space, students eating what
552
they fancy rather than making use of leftovers, not creating or following a shopping list, the
553
temptation of special offers in store and then not using food up in time, all influence
554
behaviour. The level of awareness of multiple duration dating systems and what they mean in
555
terms of food safety also are factors of influence. The students who have been raised by food
556
safety conscious parents have adopted the same food waste behaviour habits. Therefore the
557
influence of parents’ food waste behaviour on their children’s food waste behaviour later in
558
life is worthy of further study.
559
There are some limitations to this study in terms of the sample group being students
560
and thus this limits wider generalisation to the whole population. The sampling strategy was
561
based on a convenience approach, but this has provided a thematic map worthy of further
562
research using a quantitative methodology that has greater validity in terms of the inference
563
that can be drawn.
564
Four barriers were noted in this work and others that influence awareness or behaviour
565
associated with food waste: being too busy or having more important priorities (see too
566
Quested and Luzecka, 2014); believing money is only wasted when huge portions of foods
567
are thrown away in one sitting; not being able to visualise the monetary value of food waste
568
as part of the overall grocery bill and finally that cheap food is so readily available. For
569
students in this study, there was limited cognitive connection between reducing personal food
20
waste today in order to reduce the degree of food crisis in the future or indeed the impact of
571
food waste on the climate. In fact this study would suggest that for the respondents sampled
572
there is little worry or concern for the environmental and social consequences of food waste
573
now or for future generations. This may in part be due to a lack of awareness, but also it could
574
be as a result of other priorities being seen as more important or more pressing, returning to
575
notions of being too “busy”. This suggests that there is a cognitive filtering occurring where
576
food waste as being seen as less important or more distant compared with other more
577
immediate concerns and this is worthy again of further study to identify how to make food
578
waste less cognitively distant as a concern for young people.
579
Steg and Vlek (2009) considered the factors that promote or inhibit environmental
580
behaviour namely perceived cost and benefit, moral and normative concerns and effect. They
581
note too that availability of facilities and intra-personal factors play a role such as habits also
582
a feature of this work. This research shows that individual levels of awareness actually
583
mediate the influence of these factors and as a result the environmental behaviour that is
584
exhibited. Steg and Vlek (2009) suggest that environmental behavioural change can be driven
585
by informational strategies, and structural strategies that reward good behaviour and punish
586
bad behaviour. This was not a research objective for this study but in future research the use
587
of incentives could be considered as well as developing the methodology to overcome the
588
limitations described above.
589
6. Conclusions
590
This research has clearly demonstrated there are multiple influencers of students’ food
591
waste behaviour making the issue a complex one to effectively tackle. Lack of awareness of
592
the economic, environmental and social costs of food waste and an attitude of being ‘too busy
593
to care’ also play a part. As a result, it is vital to address student food waste from multiple
594
angles, including when students first come to university creating wider awareness of the
595
personal, environmental and social impact of food waste. Communication and policy tools
596
aimed at the young need to reflect these factors and also recognise that in short-term rented
21
accommodation the facilities that the students have in terms of kitchen space, especially
598
freezer space can limit behavioural options. Future research should look to expand this study
599
to encompass a larger sample size of students.
600 601
References
602
Barr, S. 2004. What we buy, what we throw away and how we use our voices – Sustainable
603
household waste management in the UK. Sustainable development, 1st February, 32-44.
604 605
Bazely, P. Jackson, K. 2013. Qualitative data analysis with Nvivo. London: Sage.
606 607
Bond, M. Meacham, T. Bhunnoo, R. Benton, T.G. 2013. Food waste within global food
608
systems. A Global Food Security report. [Online]. Global Food Security. Available from:
609
http://www.foodsecurity.ac.uk/assets/pdfs/food-waste-report.pdf 2. [Accessed 1st December
610
2016].
611 612
Brown, T., Hipps, N.A., Easteal, S., Parry, A. Evans, J.A., 2014. Reducing domestic food
613
waste by lowering home refrigerator temperatures. International Journal of Refrigeration, 40,
614
246-253.
615 616
Bryman, A. Bell, E. 2011. Business research methods. 3rd ed. Oxford: Oxford University
617
Press.
618 619
Caswell, H. 2008. Britain’s battles against food waste. Nutrition Bulletin, 33(4), 331-335.
620 621
Cohen, J.F.W., Richardson, S., Parker, E., Catalano, P.J., Rimm, E.B., 2014. Impact of the
622
New U.S. Department of Agriculture School Meal Standards on Food Selection,
623
Consumption, and Waste. Am. J. Prev. Med. 46, 388-394.
624 625
Creswell, J. 2012. Qualitative inquiry and research design: Choosing among five
626
approaches. Los Angeles, CA: Sage.
627
Dai, Y.C. Gordon, M.P.R. Ye J.Y. Xu, D.Y. Lin, Z.Y. Robinson, N.K.L. Woodard, R. Harker,
628
M.K. 2015, Why doorstepping can increase household waste recycling. Resources,
629
Conservation and Recycling, 102, 9-19
630 631
Defra. 2011. Guidance on the application of date labels to food. [Online]. Defra. Available
632
from:https://www.gov.uk/government/uploads/system/uploads/attachment_data/file/69316/pb
633
132629-food-date-labelling-110915.pdf. [Accessed 18th December 2016].
634 635
Delley, M. Brunner, T.A., 2017. Foodwaste within Swiss households: A segmentation of the
636
population and suggestions for preventive measures. Resources, Conservation and Recycling,
637
122, 172-184.
638 639
Doron. 2013. Waste Not, Want Not: How Fairness Concerns Can Shift Attitudes to Food
640
Waste. Fabian Society. Available from:
http://www.fabians.org.uk/wp-641
content/uploads/2012/05/Fabian_Waste_Pamphlet_5.12_web.pdf [Accessed 25th September
642
2016].
643 644
Edmunds, H. 1999. The focus group research handbook. Lincolnwood: NTC Business Books.
22
646
Eriksson, M., Strid, I. Hansson, P.A., 2016. Food waste reduction in supermarkets–Net costs
647
and benefits of reduced storage temperature. Resources, Conservation and Recycling, 107,
648
73-81.
649 650
Falasconi, L., Vittuari, M., Politano, A., Segrè, A., 2015. Food Waste in School Catering: An
651
Italian Case Study. Sustainability 7, 14745-14760.
652 653
FAO (Food Agriculture Organisation) 2017, Food wastage,: Key facts and fingers, Available
654
from: http://www.fao.org/news/story/en/item/196402/icode/ (Accessed 1st December 2016)
655 656
Glaser, B. (1992). Basics of grounded theory analysis. Mill Valley, CA: Sociology Press.
657 658
Godfray, H.C.J., Beddington, J.R., Crute, I.R., Haddad, L., Lawrence, D., Muir, F.F., Pretty,
659
J., Robinson, S., Thomas, S.M. Toulmin, C. 2010. Food security: The challenge of feeding 9
660
Billion people. Science, 327 (5967), 812-818.
661
662
Graham-Rowe, E., Jessop, D.C. Sparks, P., 2015. Predicting household food waste reduction
663
using an extended theory of planned behaviour. Resources, Conservation and Recycling, 101,
664
194-202.
665 666
Graham-Rowe, E., Jessop, D.C. Sparks, P., 2014. Identifying motivations and barriers to
667
minimising household food waste. Resources, Conservation and Recycling, 84, 15-23.
668 669
Gunders, D. 2012. Wasted: How America is losing up to 40 percent of its food from farm to
670
fork to landfill. Natural Resources Defence Council, 28 August, pp.1-26.
671
672
Hamilton, C. Denniss, R. and Baker, D.G. 2005. Wasteful consumption in Australia.
673
Australia: Australia Institute.
674 675
Hanks, A.S., Wansink, B., Just, D.R., 2014. Reliability and accuracy of real-time visualization
676
techniques for measuring school cafeteria tray waste: validating the quarter-waste method. J.
677
Acad. Nutr. Diet. 114, 470-4.
678 679
Kosseva, M. and Webb, C. eds., 2013. Food industry wastes: assessment and recuperation of
680
commodities. Academic Press.
681 682
Liu, Y., Cheng, S., Liu, X., Cao, X., Xue, L., Liu, G., 2016. Plate Waste in School Lunch
683
Programs in Beijing, China. Sustainability 8, 1288.
684 685
Lyndhurst. 2007. Food Behaviour Consumer Research: Quantitative Phase. [Online]. WRAP.
686
Available from:
687
http://www.wrap.org.uk/sites/files/wrap/Food%20behaviour%20consumer%20research%20q
688
uantitative%20jun%202007.pdf. [Accessed 28th November 2016].
689 690
Mallinson, L.J., Russell, J.M. Barker, M.E., 2016. Attitudes and behaviour towards
691
convenience food and food waste in the United Kingdom. Appetite, 103, 17-28.
692 693
Miller, C.K. Branscum, P., 2012. The effect of a recessionary economy on food choice:
694
implications for nutrition education. Journal of Nutrition Education and Behaviour, 44(2),
695
100-106.
23
Mondéjar-Jiménez, J.A., Ferrari, G., Secondi, L. Principato, L., 2016. From the table to waste:
698
An exploratory study on behaviour towards food waste of Spanish and Italian youths. Journal
699
of Cleaner Production, 138, 8-18.
700 701
Nicklas, T.A., Liu, Y., Stuff, J.E., Fisher, J.O., Mendoza, J.A., O'Neil, C.E., 2013.
702
Characterizing lunch meals served and consumed by pre-school children in Head Start. Public
703
Health Nutr. 1-9.
704 705
Plumb, A. Downing, P. and Parry, A. 2013. Consumers attitudes towards food waste and food
706
packaging. [Online]. WRAP, Available from:
707
http://www.wrap.org.uk/sites/files/wrap/Report%20-708
%20Consumer%20attitudes%20to%20food%20waste%20and%20packaging_0.pdf.
709
[Accessed 5th December 2016].
710 711
Principato, L. Secondi, L. Pratesi, C.A. (2015). Reducing food waste: an investigation on the
712
behaviour of Italian youths. British Food Journal, 117(2), 731-748.
713
714
Quested and Parry. 2016. Household Food Waste in the UK, 2015. [Online]. Wrap. Available
715
from:
716
http://www.wrap.org.uk/sites/files/wrap/Household_food_waste_in_the_UK_2015_Report.pd
717
f. [Accessed 18th January 2017].
718 719
Quested, T. and Luzecka, P. 2014. Household food and drink waste: A people focus. [Online].
720
WRAP. Available from:
http://www.wrap.org.uk/sites/files/wrap/People-721
focused%20report%20v6_5%20full.pdf. [Accessed 10th November 2016].
722 723
Quested, T.E., Marsh, E., Stunell, D. Parry, A.D., 2013. Spaghetti soup: The complex world
724
of food waste behaviours. Resources, Conservation and Recycling, 79, 43-51.
725 726
Quested, T., Ingle, R. and Parry, A. 2012. Household food and drink waste in the United
727
Kingdom 2012. [Online]. WRAP. Available from:
728
http://www.wrap.org.uk/content/household-food-and-drink-waste-uk-2012. [Accessed 16th
729
October 2016].
730 731
Quested, T. and Parry, A., 2011. New estimates for household food and drink waste in the
732
UK. [Online]. WRAP. Available from:
733
http://www.wrap.org.uk/sites/files/wrap/New%20estimates%20for%20household%20food%2
734
0and%20drink%20waste%20in%20the%20UK%20FINAL%20v2%20(updated%207thAugus
735
t2012).pdf. [Accessed 3rd October 2016].
736
737
Quested, T. and Johnson, H. 2009. Household food and drink waste in the UK. [Online].
738
WRAP. Available from:
739
http://www.wrap.org.uk/sites/files/wrap/Household_food_and_drink_waste_in_the_UK_-740
_report.pdf. [Accessed 16th October 2016].
741 742
Ramalho, R., Adams, P., Huggard, P. and Hoare, K., 2015, September. Literature review and
743
constructivist grounded theory methodology. In Forum: Qualitative Social Research16, 3.
744
Freie Universität Berlin.
745 746
Ritchie, J. and Lewis, J. 2013. Qualitative research practice, a guide for social science
747
students and researcher. London: Sage.
24
Ryley, J., Daniels, S., Glew, G., 1979. Portion Sizes, Preparation and Cooking Yields, and
750
Plate Waste in School Meals. Int. J. Food Sci. Nutr. 33, 170-178.
751 752
Sainsbury’s, 2016. Modern life is rubbish, Lifting the lid of food waste habits in Britain today.
753
[Online]. Sainsbury’s. Available from:
http://www.j-754
sainsbury.co.uk/media/3366413/Modern%20Life%20is%20Rubbish%20Sainsburys%20Repo
755
rt.pdf. [Accessed 1st November 2016).
756 757
Saunders, M., Lewis, P. and Thornhill, A. 2012. Research methods for business students. 6th
758
ed. Harlow: Pearson.
759 760
Schmidt, K., 2016. Explaining and promoting household food waste-prevention by an
761
environmental psychological based intervention study. Resources, Conservation and
762
Recycling, 111, 53-66.
763 764
Smithers. 2017. UK throwing away £13bn worth of food each year, latest figure show.
765
[Online]. The Guardian. Available from:
766
https://www.theguardian.com/environment/2017/jan/10/uk-throwing-away-13bn-of-food-767
each-year-latest-figures-show. [Accessed 10th January 2017].
768
769
Stenmarck, A., Jensen, C., Quested, T., Moates, G., Buksti, M., Cseh, B., Juul, S., Parry, A.,
770
Politano, A., Redlingshofer, B. Scherhaufer, S., 2016. Estimates of European food waste
771
levels. [Online]. Fusion. Available from:
http://www.eu-772
fusions.org/phocadownload/Publications/Estimates%20of%20European%20food%20waste%
773
20levels.pdf. [Accessed 10th October 2016].
774 775
Steg, L. and Vlek, C., 2009. Encouraging pro-environmental behaviour: An integrative review
776
and research agenda. Journal of environmental psychology, 29(3), 309-317.
777 778
Stenmarck, Å., Jörgen Hanssen, O., Silvennoinen, K., Katajajuuri, J.M. Werge, M., 2011.
779
Initiatives on prevention of food waste in the retail and wholesale trades. [Online]. Swedish
780
Environment Research Institute. Available from:
781
http://www.ivl.se/download/18.343dc99d14e8bb0f58b75fc/1445517505356/B1988.pdf
782
[Accessed 10th October 2016].
783 784
Stuart, T. 2009. Waste – Uncovering the global food scandal. London: W.W. Norton and
785
Company.
786 787
Themelis, N.J. Vlloa, P.A. 2007. Methane generation in landfills. Renewable energy, 32(7),
788 1243-1252. 789 790 791 792
WRAP. Not dated. The Courtauld Commitment. [Online]. WRAP. Available from:
793
http://www.wrap.org.uk/node/14507. [Accessed 29th October 2016).
794 795
Wyman. 2014. Reducing food waste, how retailers can help? [Online]. Marsh and McLennan
796
Companies. Available from:
http://www.oliverwyman.com/content/dam/oliver-797
wyman/global/en/2014/jul/OW_Reducing_Food_Waste.pdf. [Accessed 3rd October 2016].
798 799
Young, W., Russell, S.V., Robinson, C.A. Barkemeyer, R., 2017. Can social media be a tool
800
for reducing consumers’ food waste? A behaviour change experiment by a UK retailer.
801
Resources, Conservation and Recycling, 117, 195-203.
25 803