Web Ecology 7: 1–10.
Shoulder height is considered a reliable indicator of age for African elephants that grow throughout their lifetime (Lindeque and van Jaarsveld 1993, Shrader et al. 2006b). Many techniques have been used to estimate elephant age, including back length (Laws 1969, Croze 1972), posterior foot print (Western 1983), progressive molar growth (Laws 1966), as well as characteristics identifiable through direct observation (Moss 1996). Among these latter, body size, appearance of jaws (at ca two-three yr old) and their growth, markings that arise with older age (ears turning outwards, snout elongation, etc.), and shoulder height (Laws 1966, Douglas-Hamilton 1972, Laws et al. 1975,
Jachmann 1988, Lee and Moss 1995) have been fre-quently used in population studies of these mammals.Currently, the majority of studies on elephants still depend on the assessment of body size to reconstruct the age structure of wild populations (Wittemyer 2001, Morgan and Lee 2003).
My aims in this paper are (i) to compare two alternative and simple models (one based on the employment of a linear regression method, and the other based on digital photo-grammetry and laser rangefinder (Shrader et al. 2006a) to evaluate their performance with estimates of ele-phant heights in the field, and (ii) to validate these models
How tall is an elephant? Two methods for estimating elephant
height
Francesca Della Rocca
Della Rocca, F. 2007. How tall is an elephant? Two methods for estimating elephant height. – Web Ecol. 7: 1–10.
Shoulder height is a reliable indicator of age for African elephants (Loxodonta africana), and is therefore an important parameter to be recorded in field studies of population ecology of these pachyderms. However, it can be somewhat difficult to estimate with precision the shoulder height of free-ranging elephants because of several reasons, in-cluding the presence of drops and vegetation cover and the potential dangerousness of approaching them in the wild. Here I test two alternative models for estimating shoul-der height of elephants. In both models, the equipment needed to generate the height estimates is minimal, and include a telemeter and a digital photo-camera furnished with an x16 zoom. The models are based respectively on a linear regression approach and on a geometric formula approach, and put into a relationship the linear distance between the observer and the animal, the number of pixels of an elephant silhouette as taken from digital photos, and the absolute height of the animal. Both methods proved to have a very small measurement error, and were thus reliable for field estimates of ele-phant shoulder heights. The model based on a geometric formula was used to estimate the shoulder height distribution of an elephant population in a savannah region of West Africa (Zakouma National Park, Chad). I demonstrated that Zakouma elephants were among the tallest populations in Africa, with growth rates being highest throughout the first five years of life.
by using a field study of a population of African elephants (Loxodonta africana) from Zakouma National Park, Chad (West Africa). These techniques are especially valuable be-cause require only a few simple instruments (for instance, a digital camera to take elephant pictures and an optical range-finder to measure the distance from the elephant to the camera), and are therefore very useful in logistically dif-ficult contexts as those that ecologists usually experience in most African countries.
Material and methods
Model I: a linear regression approach
The application of this method requires the employment of two instruments: (i) a telemeter for evaluating the linear distance between the observer and the target animal, and (ii) a digital camera furnished with an x16 zoom. The model allows directly relate two variables: the linear dis-tance between the observer and the target animal and the number of pixels relative to the silhouette of the photo-graphed animal. By knowing these two variables, it is pos-sible to accurately estimate the body size of the target el-ephant.
Structure and calibration
Five cardboard elephant silhouettes of known height (50, 100, 150, 200, and 250 cm), and with a grey coloration similar to the natural coloration of African elephants, were photographed with a digital camera from different dis-tances, increasing by two-by-two m steps each time. At each distance step, the elephant silhouette was also shot by a Canon MVX 150i television camera, with a fixed ×16 zoom. The shooting procedure was done at a site inside urban Rome (Circo Massimo). This site was selected as a trial site because it was the only area in Rome with open grassy structure and regular distributed tree coverage at the bor-ders, i.e. the conditions that naturally occur in an African savannah. The trials were conducted at midday, with a sunny weather and terse sky.
A 100-m wire was placed along a straight line and fixed at the extremities through two pickets. At one of the ex-tremities, the observed was positioned together with his photographic equipment. Along the wire, starting at a dis-tance of 40 m from the observer, all the spots situated at successive distance intervals of two m were registered. The elephant silhouettes of all sizes were shot every two m start-ing at a distance of 40 m from the observer, and were also photographed at every distance interval. Thus, a total of 31 digital photos were done for each silhouette. At each dis-tance interval, the linear disdis-tance between the observer and the silhouette was also measured by the telemeter. The minimum distance of 40 m from the observer was selected because it is the minimum distance from which a whole silhouette of 50 cm height was wholly visible inside the photo-camera, and therefore included into a single digital photo.
A database was created for each silhouette, including (i) the real distance, (ii) the distance measured by the teleme-ter, (iii) the digital photo, and (iv) the time code of the photo into the tape. Each photo was cut out using Adobe Photoshop, and its corresponding number of pixels was calculated. In order to estimate a measure of variability in this count, this operation was repeated ten times, and a table was built for each photo with ten independent counts of the number of pixels of each silhouette.
A regression model was then built, with X being the distance and Y the number of pixels.
Model II: a geometric approach
Structure and calibration
My geometric approach is similar to that described by Shrader et al. (2006a). A formula related to the digital im-age of an elephant was used to estimate the height of an individual in cm (Fleury and Mathieu 1956). The formula uses three variables: (i) the distance from the elephant to the camera, (ii) the size of elephant image in pixels, and (iii) the focal length of the digital video-camera (Fig. 1).
The model was calibrated using a cardboard elephant silhouette of known height placed at different distances
(these silhouettes are of the same size than those used for Model I calibration). To correct for the rangefinder’s error, each distance was measured both by the rangefinder and by a measuring tape (in cm). A picture of the cardboard silhouette was taken at each distance starting at 40 m up to 100 m (31 distance classes of two m each).
Estimating the height of the elephants in Zakouma National Park, Chad
Model II was used for estimating the height distribution of African elephants in the Zakouma National Park, Chad. The park (ca 305000 ha) is located in S-E Chad and is included in the Salamat and Guéra prefectures, between 10°34´ and 11°03´ N and 19°21´ and 20°00´ E (Fig. 2).
The study area is fairly flat and reaches its highest point (415 m asl) near the village of Zakouma. The Eastern part of the Park is crossed by rivers running from N to S, among which the Bahrs Korom, Biheda, Djourf, Rossé, Sagma, and Salamat rivers are the most important. The climate is typically Soudano-Sahelian (Aubréville 1950) with seasonal rainfall from March to November estimated in 853 mm yr–1 at Zakouma station for the 1996–1998 period (Dejace 2002). The vegetation varies according to
the rainfall gradient: Acacia seyal Del. savanna is dominant in the north, but is replaced by Combretaceae savannah (Combretum glutinosum Perr.) in the central part. The southern part of the park is mostly Caesalpiniaceae savan-nah (Afzelia africana Smith) (Calenge et al. 2002).
Unlike many other parks across Western and Central Africa, the Zakouma National Park still offers strong and healthy populations of many mammals such as elephants, buffaloes (Syncerus caffer), giraffes (Giraffa cameloparda-lis), roans (Hyppotragus equines), greater kudu (Tragelap-hus strepsiceros) and lions (Panthera leo), as well as of many other animals such as reptiles and birds (Dejace et al. 2000).
The elephant population was estimated to be 4351 ± 1354 individuals, being the Chad’s largest. A recent study of movement patterns suggested that this population spends the main part of the dry season inside the Zakouma National Park. Elephants are primarily concentrated in the Eastern part of the park during the dry season, and move into the neighbouring areas soon after the arrival of the first rains (Maillard et al. 2001; Dolmia and Cornelis 2004). However, the ecology of the Zakouma elephants is still poorly known, and is currently under study by the au-thor for the fulfilment of her Ph.D.
Between January and April 2004, 1228 free-ranging el-ephants were observed and videotaped. Next, 767 individ-uals were identified from digital images. Sex was deter-mined for adult individuals by head shapes and genitalia (Moss 1996). For many newborn and young individuals it was impossible to determine their sex due to vegetation cover; these individuals were grouped into the “undeter-mined” category.
Each elephant was photographed in the field using a digital video-camera (Canon MVX150i) with a fixed focus distance. The distance from the video-camera to the ele-phants was recorded using an optical range-finder (Bush-nell Yardage Pro Legend). The distance from the elephant ranged between 40–70 m depending on visibility condi-tions and elephant approachability.
From the digital images, each elephant shoulder height was measured in pixels as the height from the top of the shoulder blade to the ground (Fig. 3). To calculate shoul-der height, I included in the analysis only those photo-graphs with elephants on completely open ground, i.e. where the vegetation cover did not hinder the accurateness of my estimates. Individual reconnaissance was based on the identification of unique features characterizing each animal, for instance the size and shape of tusks and the characteristic patterns of the ears (Douglas Hamilton 1972), and further confirmed by the use of an appropriate software (Petriccione et al. 2006).
Age was estimated from shoulder height by applying a recent model of growth curve (Shrader et al. 2006b) de-rived from the general Von Bertalanffy growth curve: hi = hb+ (H∞– hb)(1– ekt), where hi is the shoulder height, hb is the shoulder height at birth, H∞ is the asymptotic shoulder
height, k is a constant determining the rate of growth and t is the age of an individual (Hanks 1972). The functions, relative to males and females, were: hi = 104.7 + (312.0 – 104.7)(1 – e–0.069x) for males, and hi = 97.6 + (231.6 – 97.6)(1 – e–0.146x) for females.
These functions allowed for the extrapolation of age up to an age of 14 yr for females and up to an age of 25 yr for males. After these ages, it is inaccurate to use the Von Ber-talanffy growth curve, and hence I used the visual assess-ment method prescribed by Moss (1996). It consists in identifying the morphological peculiarities of each indi-vidual. Indeed, in older males head gets larger across the forehead and at the base of the tusks, giving the head a more hour-glass appearance from a front view as he gets older. Other characteristics used by Moss’ method are the size of the head in relation to the body and the thickness of the neck and trunk. In older females tusk circumference and length increase as females get older. Overall appear-ance is also an aid. Older females get bonier around the shoulders and head, and the tops of their ears fold down more and appear to be positioned lower in relation to the head and shoulders than those of younger females. Indeed, the standard deviations of the ages estimated for elephants from their shoulder heights increased with increasing shoulder height in this study. Standard deviations in-creased markedly and attained values higher than five at shoulder heights > 215 cm for females (Fmax test for equality of variances F2, 99 = 16.83, p < 0.01). For males, the standard deviations changed at a more gradual rate, and exceeded a value of 5 at shoulder height higher than 290 cm.
All individuals were classified into eight age categories: 0–1 yr (newborn), 2–5 yr (young1), 6–10 yr (young2), 11–15 yr (subadult1), 16–20 yr (subadult2), 21–35 yr (adult1), 36–50 yr (adult2), and > 50 yr (adult3).
Statistical analyses were done with SPSS (version 11.0) software, all tests being two-tailed and alpha set at 5%. I employed parametric tests when the data distribution sat-isfied the criteria of normality and homoscedasticity.
Results and discussion
Model I
The mean number of pixels was significantly different among the various distances (one-way ANOVA: F30, 279 = 28318.63, p < 0.0001), meaning that despite the small size of the distance intervals (two m), it was sufficient to get a number of pixels significantly different at the various dis-tance classes.
Potential errors in the measurements are linked to two independent sources: the human error in measuring the pixel size on the digital images (i.e., during the cutting out operation of the silhouette from the surroundings of the photo), and the error due to the fact that each photo tends to be less well-defined at longer distances, thus introducing some noise in the pixel exact counts. However, this latter source of error is already taken into consideration in the regression line. On the other hand, the human error was Fig. 3. The arrow indicates the shoulder height of a male elephant
estimated by doing ten independent replicates of the same measurement for each distance interval. The means and dispersion measures for each of these distance classes are reported in Table 1. The mean error in the number of pix-els was 0.1687 (range 0–0.3145, n = 31, SD = 0.068, SE = 0.0122), and in cm was 0.08 (range 0–0.1367, n = 31, SD = 0.0321, SE = 0.0006), thus being practically impercepti-ble. This was also confirmed by a one-way ANOVA on the various replicates (F9, 300 = 0.000406, p = 1), and with an inter-classes correlation index showing a very high repeata-bility of the data (model: r = s2a/(s2+s2a), r = 931.7362/ (0.380287+931.7362) = 0.9995). It is therefore possible to conclude that for the application of model I only the mean values for each group should be used.
For generating the data function, only the measure-ments taken by the telemeter are used, with X being the distance and Y being the ratio elephant silhouette/number of pixels (in cm). This index was repeated five times for each distance, and thus for each distance a table was built where under the column Y the five different index values are indicated, and under the column X the associated dis-tance values. Then, a regression function was obtained
from this table. In my case, the regression equation was Y = 0.007164x – 0.007211 ± 0.00876096.
Model II
Potential errors in the measurements are linked to two independent sources: the rangefinder error and the human error in measuring the pixel size on the digital images. The rangefinder error was estimated by comparing the dis-tance from the cardboard silhouette in cm measured manually with the tape to the distance in cm obtained by the optical rangefinder (Fig. 4). On average, the range-finder measurements were 55 cm greater than the manual tape measurements which would result in an error of 0.924 cm in shoulder height estimations.
The human error was estimated by taking ten replicate measurements in pixels on the same photo for 31distance classes. On average, the difference between the various measurements on the same photo image was of 0.16 pixels corresponding to an error of +0.0057 cm in shoulder height estimation. Thus, the human error in measuring Table 1. Mean and dispersion measures for the human error in the measurement of the number of pixels included in a cardboard elephant silhouette at the various distance intervals considered in this study. Symbols: D40 = distance of 40 m, etc.
Distance n Mean –95% +95% Min Max SD SE
conf. int. conf. Ind.
D40 10 177.0 176.6 177.3 176 178 0.4 0.1
D42 10 169.1 168.3 169.8 167 170 0.9 0.3
D44 10 160.8 160.4 161.1 160 161 0.4 0.1
D46 10 154.9 154.1 155.6 153 156 0.9 0.3
D50 10 141.6 141.2 141.9 141 142 0.5 0.1
D52 10 138.6 138.0 139.1 138 140 0.6 0.2
D54 10 131.9 131.4 132.3 131 133 0.5 0.1
D56 10 128.3 127.8 128.7 128 130 0.6 0.2
D58 10 124.2 123.8 124.5 124 125 0.4 0.1
D60 10 120.4 120.0 120.7 120 121 0.5 0.1
D62 10 117.7 117.3 118.0 117 118 0.4 0.1
D64 10 113.5 112.9 114.0 112 114 0.7 0.2
D66 10 108.7 108.3 109.0 108 109 0.4 0.1
D68 10 106.0 105.6 106.3 105 107 0.4 0.1
D70 10 105.1 104.6 105.5 104 106 0.5 0.1
D72 10 102.2 101.7 102.6 101 103 0.6 0.2
D74 10 99.2 98.7 99.6 98 100 0.6 0.2
D76 10 99.5 99.1 99.8 99 100 0.5 0.1
D80 10 91.2 90.6 91.7 90 92 0.7 0.2
D82 10 90.5 89.9 91.0 89 91 0.7 0.2
D84 10 86.9 86.4 87.3 86 88 0.5 0.1
D86 10 81.2 80.7 81.6 80 82 0.6 0.2
D88 10 80.3 79.9 80.6 80 81 0.4 0.1
D90 10 79.8 79.4 80.1 79 80 0.4 0.1
D92 10 79.9 79.6 80.1 79 80 0.3 0.1
D94 10 76.8 76.3 77.2 76 78 0.6 0.2
D96 10 75.1 74.8 75.3 75 76 0.3 0.1
D98 10 73.2 72.8 73.5 73 74 0.4 0.1
the elephant height from the digital images was irrelevant (one-way ANOVA: F 9, 300 = 0.00, p = 0.98, ICC = 0.9995).
Comparing the two methods
For brevity, in order to evaluate the performance of the two methods in characterizing the shoulder height of el-ephants, I present here only the comparisons for the small-est and the largsmall-est elephant silhouettes (Table 2). The aver-age differences were very small (up to ca 3 cm out of 250 cm in the largest silhouette!). This demonstrates that the two methods not only provided very similar results, but also gave confident estimates of the actual elephant shoul-der height. Therefore, they can be certainly used for field studies of these pachyderms. I used a relatively cheap cam-era-technology (priced ca 400 €), and with a better equip-ment the accurateness of the estimates should have been even much better. The mean error measurements for all the silhouette sizes are given in Table 3.
Fig 4. T-test comparing manually tape measured distances and rangefinder distances from the elephant cardboard silhouette.
Table 2. Comparison of performance of the two methods used for the estimation of shoulder height of differently sized elephant silhouettes (50 cm and 250 cm tall).
No. of Distance Y Height by Height by
pixels (m) function geometric
formula
50 cm silhouette
177.0 40 0.2 49.4 49.5
169.1 42 0.2 49.6 49.7
160.8 44 0.3 49.4 49.5
154.9 46 0.3 49.9 49.8
152.0 48 0.3 51.1 51.0
141.6 50 0.3 49.6 49.5
138.6 52 0.3 50.6 50.4
131.9 54 0.3 50.0 49.8
128.3 56 0.3 50.5 50.2
124.2 58 0.4 50.6 50.4
120.4 60 0.4 50.8 50.5
117.7 62 0.4 51.4 51.0
113.5 64 0.4 51.1 50.8
108.7 66 0.4 50.5 50.2
106.0 68 0.4 50.8 50.4
105.1 70 0.4 51.9 51.4
102.2 72 0.5 51.9 51.5
99.2 74 0.5 51.8 51.3
95.2 76 0.5 51.1 50.6
93.0 78 0.5 51.2 50.7
91.2 80 0.5 51.5 51.0
90.5 82 0.5 52.4 51.9
86.9 84 0.5 51.6 51.0
81.2 86 0.6 49.4 48.8
80.3 88 0.6 50.0 49.4
79.8 90 0.6 50.8 50.2
79.9 92 0.6 52.0 51.4
76.8 94 0.6 51.1 50.5
75.1 96 0.6 51.0 50.4
73.2 98 0.6 50.8 50.2
71.0 100 0.7 50.3 49.7
250 cm silhouette
429.8 82 3.0 249.3 246.7
420.2 84 2.9 249.8 247.0
409.2 86 2.9 249.1 246.3
399.5 88 2.8 248.9 246.0
90 90 2.7 248.6 245.7
384.7 92 2.7 250.7 247.7
375.7 94 2.6 250.2 247.2
359.8 96 2.6 244.8 241.7
359.8 98 2.2 250.0 246.8
352 100 2.5 249.6 246.4
Estimating the height of African elephants in
Zakouma National Park, Chad
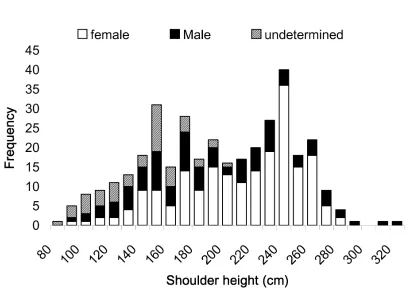
During the study period, 352 individuals were photo-graphed for calculation of shoulder heights: 317 females with their calf and 35 adult males. The shoulder height distribution is given in Fig. 5. The minimum shoulder height observed was 79.4 cm, as other African populations
(Amboseli: Lee and Moss 1995; Murchison Falls: Laws et al. 1975). However, at Zakouma the adult females reached the height of 279.5 cm, thus being among the tallest populations currently known (Fig. 6). For the adult males, the maximum shoulder height was 323.4 cm, being sig-nificantly taller than females.
Table 3. Mean error measurements for shoulder height estimates of elephant silhouettes according to models (statistical and geometrical).
Silhouettes Y function Error function Y formula Error formula
(cm) (cm) (cm) (cm) (cm)
50 50.82 0.82 50.47 0.47
100 98.92 –1.08 98.18 –1.82
150 148.77 –1.23 147.43 –2.57
200 200.64 0.64 198.49 –1.51
250 249.16 –0.84 246.19 –3.81
Fig. 6. Maximum shoulder height observed in different populations of African elephants. Numbers above the bars indicate the maxi-mum height values. Black bars represent males, and white bars represent the females. ANP = Amboseli National Park; KNP = Kruger National Park; LV = Luangwa Valley; MF = Murchinson Falls; ENP = Etosha National Park; BZ = Basle Zoo; QENP = Qeen Elisabeth National Park; DZ = Diksie Zoo; ZNP = Zakouma National Park; HNP = Hwange National Park.
life. Between birth and five yr age, Zakouma elephants grew from a mean height of 79.4 cm to 168.5 cm, with an overall increase of approximately 89 cm and a mean growth rate of 17.82 cm yr–1. The body growth of females started to slow down by the age of 15, when the male growth rate was still high: between ten to 15 years age, mean male growth per yr was approximately 7.15 cm. Male growth started to slow down after the age of 25 (Fig. 8).
Conclusions
I compared the results of two easy to use models that can be useful to calculate the shoulder height of free-ranging elephants from a known distance. The Model I, based on a
With Model II it was possible to obtain accurate age estimations for the Zakouma elephants aged up to ten yr for females and 20 yr for males. After this age, if we add the estimation errors to the real measure obtained from the two methods (estimation of size and estimation of age from the size), we come up with an estimation that is likely higher than the yearly growth rate, and this impedes to guarantee accurate age estimation. Therefore, after these ages it is advisable to subdivide the populations in age
classes and to rely on other morphological parameters, es-pecially for individuals older than 20 yr (Moss 1996).
A potentially relevant aspect of my study is that these methods can be easily applied to other savannah animals such as lions, rhinos, buffaloes, zebras, and giraffes in Afri-ca and elsewhere. Obviously, it will be necessary to reAfri-calcu- recalcu-late the measurement errors to avoid introducing biases in the analyses.
Acknowledgements – I thank Dr. A. Ortolani for insightful
guid-ance over the research period, for helping me during the field and the laboratory work, and for reading over a early draft of this manuscript. I am also indebted to Prof. L. Boitani for support and encouragement, Dr. Louis Arranz (Director of the Zakouma National Park) and the authorities of the Chad government for authorizations to work in the Park, and C. Cacioppo, L. Massaro, and D. Petriccione for helping me during the silhouette trials and elephant identification. This study was partially supported by the Ministry for the Public Education of Italy.
References
Aubréville, A. 1950. Flore forestiére Soudano-Guinéenne. – So-ciétés d’Editions Géographiques, Maritimes et Coloniales, Paris.
Fig. 7. Age distribution of African elephants as estimated by shoulder height for 352 identified individuals at Zakouma National Park, Chad.
Calenge, C., Maillard, D., Gaillard et al. 2002. Elephant damage to trees of wooded savanna in Zakouma National Park, Chad. – J. Trop. Ecol. 18:599–614.
Croze,H. 1972. A modified photogrammetric technique for as-sessing age-structure of elephant populations and its use in Kidepo National Park. – E. Afr. Wildl. J. 10: 91–115 Douglas-Hamilton, I. 1972. On the ecology of the African
ele-phant. PhD thesis, University of Oxford.
Dejace, P. 1995. Rapport d’activité du parc national de Zakou-ma, 1993–1995. – Ministère de l’environnement et du tour-isme, Tchad.
Dejace, P., Gauthier, L. and Bouché, P. 2000. Les populations des grands mammifères et d’ autruches du Parc National de Zak-ouma au Tchad: statuts et tendances évolutives. – Rev. Ecol. (Terre Vie) 55: 305–320.
Dolmia, M. and Cornélis, D. 2004. Dynamique spatiale des élé-phants du Parc National de Zakouma: premiers résultats d’une étude en cours. – Revue Canopées 2004: 22–24. Fleury, P., and Mathieu, J.P.1956. Images optiques. – Paris,
Ey-rolles.
Hanks, J. 1972. Growth of the African elephants (Loxodonta
afri-cana). – E. Afr. Wildl. J. 10: 251–272
Haynes, G. 1991. Mammoths, Mastodons and Elephants. – Cambridge Univ. Press.
Jachmann, H. 1988. Estimating age in African elephants: a revi-sion of laws’ molar evaluation technique. – Afr. J. Ecol. 26: 51–56.
Lang, E.M. 1980. Observations on growth sod molar change in the African elephant. – Afr. J. Ecol. 18: 217–234.
Laws, R.M. 1966. Age criteria for the African elephants. – E. Afr. Wildl. J. 4: 1–37
Laws, R.M. 1969. The Tsavo Research Project. – J. Reprod. Fert., Suppl. 6:495–531
Laws, R.M., Parker, I.S.C. and Johnstone, R.C.B. 1975. Ele-phants and their habitats: The ecology of eleEle-phants in North Bunyoro, Uganda. – Clarendon Press.
Lee, P.C. and Moss, C.J. 1995. Statural growth in the African elephant (Loxodonta africana). – J. Zool. (Lond.) 236: 29– 41.
Lindeque, M. and Van Jaarsveld A.S. 1993. Post natal growth of elephants Loxodonta africana in Ethosha National Park, Na-mibia. – J. Zool. (Lond.) 229: 319–030
Maillard, D., Calenge, C., Jacobs, T. et al. 2001. The Kilometric Index as a monitoring tool for populations of large terrestrial animals: a feasibility test in Zakouma National Park, Chad. – Afr. J. Ecol. 39: 306–309.
Morgan, B.J. and Lee, P.C. 2001. Forest elephant (Loxodonta
af-ricana cyclotis) stature in the Réserve de Faune du Petit
Loan-go, Gabon. – J. Zool. (Lond.) 259: 337–344.
Moss, C. J. 1996. Getting to know a population. – In: Kangwa-na, K. (Ed.), Studying elephants, African Wildlife Founda-tion, Nairobi, pp. 58–74.
Petriccione, D., Ardovini, A., Cinque, L. et al. 2006. Computer-aided wild elephant identification. – In: Abstracts of the ISBE 2006, Tours, pp. 264.
Short, R.V. 1969. Notes on teeth and ovaries of an African ele-phant (Loxodonta africana) of known age. – J. Zool. (Lond). 158: 421–425.
Shrader A.M., Ferriera, S.M., and van Aarde, R.J. 2006a. Digit-al photogrammetry and laser rangefinder techniques to measure African elephants. – South Afr. J. Wildl. Res. 36: 1–7.
Shrader, A.M., Ferreira, S.M., McElveen, M.E. et al. 2006b. Growth and age determination of African savanna elephants. – J. Zool. (Lond). 2006: 1–9.
Western, D., Moss, C. J. and Georgiadis, N. 1983. Age estima-tion and populaestima-tion age structure of elephants from foot-print dimensions. – J. Wildl. Manage. 47: 1192–1197. Wittemyer, G. 2001. The elephant population of Samburu and