ISSN: 2456-1878
www.ijeab.com Page | 200
Using of Landsat Images for Land Use Changes
Detection in the Ecosystem: A Case Study of the
Senegal River Delta
M. A. Toure
1, M. L. Ndiaye
2, V. B. Traore
3, G. Faye
4, B. Cisse
5, A. Ndiaye
1, C. T.Wade
61Laboratory of Climatology and Environmental studies (LCE), UCAD, Dakar, Senegal 2
Laboratory of Education and Research in Geometrics (LERG), UCAD, Dakar, Senegal
3Laboratory of Hydraulics and Fluid Mechanics (UCAD), Dakar, Senegal
4 Laboratory of geomorphology, UCAD, Dakar, Senegal
5Department of Management and Water Resources Planning, Dakar, Senegal 6Pathways to Resilience in Semi-arid Economies (PRISE), Senegal
Abstract—Land use changes study is an essential step for
the monitoring and assessment of ecosystems. In Senegal River delta, ecosystem has experienced significant changes from 1970 to nowadays. Several natural and anthropic factors are at the origin of these modifications. The aim of this paper is to reconstruct the history of land use in the Senegal River delta and detect these changes. For this, Landsat images acquired in 1972 (MSS), 1984 and 1988 (TM), 1999 and 2006 (ETM) and 2014 (OLI) are used to make the diachronic study. We have first conducted a pretreatment of the image (relating to the geometrical and radiometric correction and the equalization of the histograms), calculated of pseudo-ACP bands and NDVI, classified and validated the images and finally detected changes by individual classification method. The results obtained, broadly show significant changes in terms of areas gain for the land plants (231%), growing areas (95%) and aquatic vegetation (75%). This dynamic is at the expense of saline lands, dune surfaces and the water areas. Interesting perspectives for authorities and decision makers in precise management of the ecosystem in the Senegal River delta are offered as well.
Keywords—Remote sensing, Land-use change, Climate change and variability, Landsat images, anthropic ecosystems of Delta, Senegal
I. INTRODUCTION
Remote sensing is one of the best innovations for inventory and monitoring of the environment at the planetary scale; it has considerably grown in recent decades with the improvement of databases (satellite images in medium, high and very highresolution), tools (software) and data processing techniques. It enables management of the earth's surface changing and studying the dynamic phenomena that affect ecosystems [1]. Land
ISSN: 2456-1878
www.ijeab.com Page | 201
changes in the Senegal River delta by remote sensing approach. The latter is widely used in this area for inventory and monitoring of available resources by choosing Landsat images. In general, due to their repetitive acquisition, analysis of multi-temporal images provides an additional dimension to the potential applications of Remote sensing [1]. Landsat images are subject of numerous studies in many areas at world scale [8-9-10-11-12-13-14-15].Their temporal resolution dating about 40 years, explains popular choice for understanding environmental issues. In this study, we will proceed by diachronic approach or multidate to map changes in the River Senegal delta from 1970 to nowadays. With the wide range of imaging instruments of Landsat, we have chosen the images acquired in 1977 (MSS), 1988 (TM), 1999 (ETM), 2006 (ETM) and 2014 (OLI).
II. MATERIALS AND METHODS
Landsat images were collected using 05 periods, corresponding to the 1970's, 1980's, 1990's, 2000's and 2010' showing in (Table 1). The images were downloaded from the USGS website. The basic premise in using remote sensing data for change detection is that changes in land cover must result in changes in radiance values and changes in radiance due to land cover change must be large with respect to radiance changes caused by other factors [16]. These 'other' factors include (1) differences in atmospheric conditions, (2) differences in Sun angle (3) differences in soil moisture and (4) phenological state [(16) ; (17)]. The impact of these factors may be partially reduced by selecting the appropriate data. For example, Landsat data belonging to the same time of the year may reduce problems from Sun angle differences and vegetation phenology changes (18). So, anniversary or near-anniversary satellite image is important. For this reason, we have selected the images acquired in the same month, that is to say in November, except the image of MSS in September 1977, for reasons related to poor quality of the images from October to December of the same year.
Table.1 : Characteristics of Landsat images used for this study
Satellite
Type of the Sensor
Acquisition Date
Spatial resolution
(m)
Number of bands Landsat
3 MSS Sept. 1977 60 4 Landsat
5 TM Nov. 1984 30 6 Landsat
5 TM Nov. 1988 30 6
Landsat
7 ETM+ Nov. 1999 30 7 Landsat
7 ETM+ Nov. 2006 30 7 Landsat
8 OLI Nov. 2014 30 11
2.1 Study area
ISSN: 2456-1878
www.ijeab.com Page | 202
in halophytes and training Acacia nilotica. Delta belongs to the Sahelian climate field [23], characterized by a highly variable rainfall characterized by large deficits most pronounced of which are at the origin of the great drought recorded during the late 1960s and early 1970 [24]. The demographic point of view, the delta as the entire Sahel is growing. Indeed, with a growth rate of
3.4%, the population of delta Password bhts 517,663 in 2002 to 631,025 in 2015 bhts [25]. This growing population is putting significant pressure on environmental resources (water, soil, vegetation, wildlife, etc.). Indeed, the combined effect of climate variability and the high human pressure leads to major changes in the ecosystems of the delta.
Fig.1 : Location of the Senegal River delta
2.2 Image pre-processing
Geometric precision, atmospheric correction, radiometric calibration, normalization of histograms and eliminating the redundancy of multispectral images, are all elements necessary for a successful change detection study. Geometric correction is necessary for relating terrain surface information to ground coordinates by removing distortions from sensor geometry. Most of the distortion is due to earth rotation [26]. USGS provides Landsat images that have already been orthorectified and corrected to the right coordinate system [27]. So Landsat images are geometrically corrected and geo-coded in the overall system Universal Transverse Mercator (UTM) using the image 2014 as a reference. The root mean square (RMS) is everywhere less than ½ pixel. For the resampling of images, we used the nearest neighbor. The multi-temporal images are acquired in different atmospheric conditions. These differences can mask real gold exchange make similar land cover Appears to-have changed [10]. Therefore to correct the effects of the atmosphere on the images, we conducted an atmospheric correction applied to all images. The images also suffered a radiometric calibration. The radiometric correction is performed in two steps, the absolute calibration at the receiving stations and relative calibration [28]. The radiance and the reflectance information derived from Landsat bands make comparison between images possible. The image DN value was
ISSN: 2456-1878
www.ijeab.com Page | 203
2 and 3 are selected for each image, the higher the NDVI for the classification stage.
Table.2 : Cumulative percentage of variance components retained
Main components Information content
MSS 1977 % TM 1988 % ETM+ 1999 % ETM+ 2006 % OLI 2014 %
1 94,924 95,658 94,121 95,025 95,856
2 3,203 2,101 3,532 2,568 2,332
3 1,521 1,523 1,441 1,554 1,512
4 0,352 0,656 0,776 0,754 0,211
5 0,053 0,091 0,081 0,061
6 0,011 0,039 0,018 0,023
7 0,005
Total 100 100 100 100 100
2.3. Image classification
Supervised classification and maximum likelihood classifier have been used to detect the different land cover types. The classification operation main objective to achieve as closely as possible the mapping from pixels of the spectral value and texture of the different pixels of the image [32]. This is the individualization of different spatial entities selected for this study through an automatic classification method based on spectral similarities, and even spatial geometry. In this present study, we selected six [6] relatively homogeneous samples in line with the land use units (biotope) targeted; it comes to water, the dunes, the growing areas, aquatic vegetation, continental vegetation and the salty land (tans). Maximum likelihood classification was applied for the classification step by using equal prior probabilities For Each class signature.
2.4. Accuracy assessment
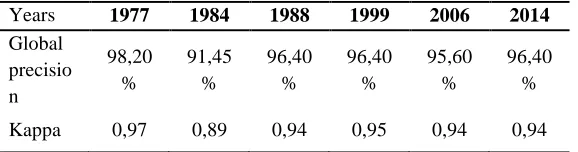
Accuracy assessment is very important for understanding the developed results and employing these results for decision-making [17]. The confusion matrix used to assess the quality of classification, by comparing the results of the classification with field data. It determines the pixel confusions made during the classification. The evaluation of our results from confusion matrices, allows us to see that Kappa indices and accuracy measures for 06 cards, indicate that the classifications are good (Table 3).
Table 3 : Overall Accuracy and Kappa different classifications
Years 1977 1984 1988 1999 2006 2014
Global precisio n
98,20 %
91,45 %
96,40 %
96,40 %
95,60 %
96,40 %
Kappa 0,97 0,89 0,94 0,95 0,94 0,94
2.5 Change detection
Automatic change detection methods, usually applied with medium resolution imagery, imply the comparison
of geometrically compatible multi -temporal images on a pixel by pixel basis. Many methods have been proposed for the detection of changes in land use from satellite images [1-17-33]. Among these methods we have used in the "classification based" approach which is also a direct approach. The Post-Classification Comparison Change Detection Involves classifying the rectified image from two Time Periods separately, and defining the value of each class in the classification [27]. The evaluation of changes is made on the results of the classification on a pixel-by-pixel basis using a table of statistics using a transition matrix. Analysis of transition matrices gives us the spatial and temporal changes in soil use changes the
Senegal River delta between 1977-1988, 1988-1999,
1999-2006 and 2006-2014. Changes maps were made using these transition matrices that describe and locate the various types of changes.
III. RESULTS AND DISCUSSION 3.1. Description of land use classes
The detection of the dynamic noted in the delta concerns different ecosystems units, which we synthesized through the following table.
Table 4 : Description of landscape units in the Senegal River delta
Theme Description
Waters
ISSN: 2456-1878
www.ijeab.com Page | 204 Dunes
They are made by all the sandy formations furniture, fixed or semi-fixed. This is indeed ogoliennes dunes (dominant in the southeastern part), bright coastal dunes (the language of barbarism) and yellow dunes (MakaDiama, etc.).
Salted Lands
They are located in the floodplain of the river and its tributaries, the surrounding lakes, estuary and interdunes. These areas during the rainy season receive rainwater from the annual flood. Once the standing water is removed, the salt was dissolved forms crystals and deposits on the soil surface. In the delta, the land is a neutral salinity sodium chloride-sulphateand magnesium of marine origin [34-35].
Growing areas
They consist of irrigated crops, wet, flood recession and market gardening;
Aquaticvegetation It is composed by mangroves and
aquatic plants.
Continental vegetation
It consists of savannah formations, steppe formations and reforested areas.
3.2. Land use map
The area occupied by the different classes of land cover have evolved continuously over the spatiotemporal map from 1977 to 2014 and this according to the conditions in the middle of study. The resulting maps of remote sensing processing (Figure 3) allow taking stock of land use on the said period. The fact is that the most common classes of the study area correspond to the dune vegetation and mainland. They occupy about 60% of the area of the study area, against 40% for the remaining classes. In general, the visual analysis of 05 cards, plus the statistical results (Table 5) and graph (Figure 2) are seen the following changes for each class considered: i) a decline of dune areas between 1977 and 2006, then increased until 2014; ii) a decline in area occupied by water and saline lands; iii) an increase of aquatic and land plants and growing areas. Knowledge of types of transitions is needed to understand the process that led to the current state of land use in the study area. For this, through the post-classification approach based on comparison of independent classes, we have crafted maps of changes in order to locate the types of changes and measure their areal extent.
Table.5 : Areas occupied by the different habitats units delta 1977-2014
Fig.2 : Evolution of the areas of land use units between 1977 and 2014
0 20000 40000 60000 80000 100000 120000 140000 160000 180000 200000
Dune Water Salted land Aquatic vegetation Continental vegetation Growing area
Area (ha)
E
cos
ys
te
m
u
n
it
s
ISSN: 2456-1878
www.ijeab.com Page | 205 Fig.3 : Map of land cover conditions in the delta of Senegal
3.3. Detection of land use changes between 1977 and 2014
The land use change in the Senegal delta ecosystem results in the conversion and / or modification of a biotope class to another. The amendment refers to the changes taking place in the same group or within a same category of land use; example in our case, aquatic vegetation that becomes continental vegetation or vice versa. As against the conversion refers to the passage of a land use category to another; example in this case, continental vegetation which becomes growing area or vice versa. As opposed to the conversion and modification, there are unchanged or stable classes, that is
ISSN: 2456-1878
www.ijeab.com Page | 206 Fig 4 : Map of changes in the ecosystem of the Senegal River delta between 1977 and 2014
3.3.1. Changes detection between 1977 and 1988
The change between 1977 and 1988 is reflected in the transformation of land use units. Indeed, the waters recorded a 9.7% loss, converted into aquatic vegetation (4.1%), cultivated area (3.3%) and buries salt (2.2%) (Table 6). The regression of the waters between 1977 and 1988 is represented spatially by water converted very visible in the bowl of Djoudji. She also obtained a gain of 5% on other land cover units. As for the salty land, 98.6% of the area did not undergo change. This unit is characterized by high stability during this period. However, small changes are observed, with a rate of change of the order of 1.4%. The aquatic vegetation in its evolution, executes notorious mutations, with nearly 21.8% of its area converted, crop area (11.8%) in water (6.5%), the salt land (2.4%) and land plants (0.9%). Aquatic vegetation converted locates in the northern part and southwest of the delta. Continental vegetation, also known major changes, with a stability rate equals 25.7%. Indeed, 74.3% of its extent are transformed into crop area (23.7%), salt land (21.8%) and a small (16.4%). The area’s most important cultural progression rate with 240.2% between 1977 and 1988. The rate more or less stable low (59.5%) reflects the changing nature of this class. However, 40.5% of its surface have mutated into barrenness (16.6%), water (9.7%), aquatic vegetation (9.1%) and continental vegetation (3.8%). Class assigned to the dune marks a regression of 15% of its extent. It has
a stable of about 71%. His converted area (28.1%) is allocated as follows, 13.8% in salty soil, 12.1% in continental vegetation and 1.7% in crop area.
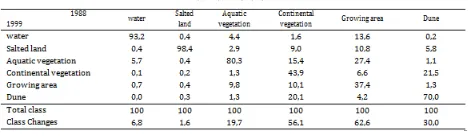
Table 6 : Evolution of land use rate units between 1988 and 1999
3.3.2. Changes detection between 1988 and 1999
ISSN: 2456-1878
www.ijeab.com Page | 207
decline of around 1.3% of their area. Aquatic vegetation knows the biggest change between 1988 and 1999, with a 151.4% class difference. The overall conversion rate was 19.7%, including 9.8% in growing areas, 4.4% water, 2.9% saline lands and 1.3% in mainland dune vegetation each.
Table.7 : Evolution of land use rate units between 1988 and 1999
3.3.3. Changes detection between 1999 and 2006
The analysis of the dynamics of the Senegal River delta ecosystems between 1999 and 2006 shows a marked change of areas of certain landscape units as presented in Figure 3 and Table 8. The water class registers a change rate of 47.4 % distributed between classes, salt land (26.1%), growing area (12.9%), aquatic vegetation (4.4%) and land plants (3.7%). These changes are mainly located in the estuary just outside of the Senegal River, three creeks and bowl of Ndiael. The salt land unit loses 98.6% of its area, fully converted to crop land (98.1%). Much of this change is located in the north-central delta, around the irrigated perimeters. After this unit is the class of aquatic vegetation that knows a -27.7% decline. Its total area having undergone a change is estimated at 50.0%, mostly converted into continental vegetation (17.4%), the growing area (15.3%) and salt land (14.3%). These changes are visible in the vicinity of three backwaters between Lampsar and Maka-Diama and south of the basin of Djoudji. For the mainland vegetation, she experienced a conversion rate of 65.7%, with 53.2% posted in dune and 10.8% in salt land and growing area. These changes are mainly the dune areas southeast of the delta, specifically around the village of Amar Fall Gade, west in the Maka-Diama and southwest to the top of the village of BaoGniling. The class of the growing area known significant changes, 57.8% of its surface is converted into continental vegetation (23.1%), aquatic vegetation (16.7%), the salt land (15.5% ) and dune (2.0%). As to the dune class, it records a drop of -5.4%, which at an estimated rate of change to 34.0%. This proportion, mainland vegetation occupies the largest share at 18.6%, followed by the class of the salt land with 13.4%. These changes are visible in the scraps of land east of the city of St. Louis, in the resort of Leybar, and southern areas.
Table 8 : Changing land use rate units between 1999 and 2006
3.3.4. Changes detection between 2006 and 2014
Aware of this period the most significant changes concern the increase in, water, salted land, aquatic vegetation and dune; and the regression for the rest. The waters are experiencing significant stability, with a rate of 93.6%, against a low rate of change (6.4%). These changes concern, their conversion into aquatic vegetation (3.2%), in salt land (1.7%) and growing area (1.5%). However, they recorded growth of their area of 2.3% over the period 2006-2014. On salty land, they experience a significant increase in their area. But, about 35.2% of their area has undergone a change. This change is mainly related to its change in dune (18.9%) and its conversion into land plants (8.0%) and growing area (6.6%). On the aquatic vegetation, it registers a change rate of 31.5%. Major transfers concern the growing area (16.4%), salty land (6.7%) and Mainland vegetation (5.6%). The dune class knows an increase of 29.3%. But nevertheless, 11.1% of its surface is converted into land plants (6.6%) and growing area (1.3%), and amended in salt land (3.0%).
The continental vegetation shows a significant evolution of its area under its stability estimated value to 34.4%. Much of the area is converted dune (27.7%), followed by salt land class (21.1%), growing areas (13.5%). And only 3.2% of land area is varied aquatic vegetation. In general, the land plants fell by 36.3% of its area during this period. In a context of land degradation, land of crops experiencing an impressive drop in their area, converted as a whole in salted land. Dune areas are also experiencing an increase in their areal extent of 29.3%. But 29.3% of area has undergone a change of state. It is distributed as follows: 6.6% continental vegetation, salty lands 3.0% and 1.3% growing areas.
ISSN: 2456-1878
www.ijeab.com Page | 208 IV. CONCLUSION
This study enters within the framework of the characterization and valorization of the anthropized ecosystems of the Senegal River Delta. Landsat images acquired in 1972 (MSS), 1984 and 1988 (TM), 1999 and 2006 (ETM) and 2014 (OLI) are used to make the diachronic study. We have first conducted a pretreatment of the image (relating to the geometrical and radiometric correction and the equalization of the histograms), calculated of pseudo-ACP bands and NDVI, classified and validated the images and finally detected changes by individual classification method. This has helped to locate, characterize and quantify land cover changes. Supervised classification based on maximum likelihood has consolidated our analysis on these changes. Analysis of the observed changes has shown significant changes in landscape units between 1977 and 2014. These concern on the one hand, the decline of farmland, dunes and aquatic vegetation; and secondly, an increase of the remaining classes.Salted land recorded a decline between 1977 and 1988 (-22.72%), 1988 and 199 (-43.25%) and 2006 and 2014 (-84.08%). By cons between 1999 and 2006, the salted land recorded an increase of 38.58%. The dunes were down during the first two periods with -8.60% and -20.08% respectively; and an increase in the last two periods, 1.72% and 0.69%. For the vegetation classes, the most important changes are related to the progression of the continental vegetation between 2006 and 2014 (63.28%). Growing areas are on the increase throughout the study period.
V. ACKNOWLEDGMENT
We would like to sincerely thank IED Africa (Innovation Evironment Developement) for funding this study that enter in the frame work of the PRISE project (Pathways to Resilience in Semi-arid Economies).
REFERENCES
[1] Mas J. F., 2000.A review of the techniques and methods of the change detectionwithremotesensing Canadian Journal of RemoteSensing / Journal Canadien de télédétection Vol. 26(4), pp. 349-369. [2] Lambina E. F., Turnerb B. L., Geista H. J., Agbolac
S. B., Angelsend A., Brucee J. W., Coomesf O. T., Dirzog R., Fischerh G., Folkei C., George P.S., Homewoodk K., Imbernonl J., Leemansm R., Lin X., Morano E. F., Mortimorep M., Ramakrishnanq P.S., Richardsr J. F., Skaness H., Steffent W., Stoneu G. D., Svedinv U., Veldkampw T. A., Vogelx C., Xuy J. 2001, The causes of land-use and land-cover change : moving beyond the myths. Global Environmental Change, vol. 11, pages 261–269.
[3] Lefebvre A. 2011, Contribution of the texture for image analysiswithveryhigh spatial resolution. Application to the change detection in peri-urbanareas,thesis, Department of Geography, University of Rennes II, Bretagne, p 284.
[4] Thompson R. S. et al. (1999). Atlas of Relations Between Climatic Parameters and Distributions of Important Trees and Shrubs in North America. U.S. Geological Survey, Professional Paper 1650, part A and part B.
[5] Lambin E. F., Strahler A.H., (1994), Change-vector analysis in E.F. multitemporalspace : a tool to detect and categorize land-cover change processes using high temporal-resolution satellite data. Remote Sensing of Environment, vol. 48, pages 231–244, 1994.
[6] Mckee J. K., Sciulli P. W., Fooce C. D., Waite T. A. (2004), Forecasting global biodiversity threats associated with human population growth. Biological Conservation, 115, pp. 161–164.
[7] CSE 2010. Conditions and trends evaluation of the forestecosystems and its services in Senegal, Final Report Centre for Ecological Monitoring, 244P. [8] Hartvich F., Koskinen K., Pellikka P. 2001, Change
detection of urban areas using multitemporal Landsat TM satellite data in Turku, Finland, Presented at the Nordic GIS Conference, Helsinki, 8-10 October 2001.
[9] Hoang K. H., Bernier M. et Villeneuve J-P. 2008, Land use changes in Câu River basin (Vietnam). Diachronicapproach test, RemoteSensing Journal, vol. 8, n° 4, p. 227-236
[10]Berberoglu S., Akin A. 2009, Assessing different remote sensing techniques to detect land use/cover changes in the eastern Mediterranean, International Journal of Applied Earth Observation and Geoinformation 11, 46–53.
[11]Zhang, Q., Wang, J., Peng, X., Gong, P., Shi, P. 2002, Urban built-up land change detection with road density and spectral information from multi-temporal Landsat TM data. Int. J. Remote Sens. 2002, 23, 3057–3078.
[12]Zhang Q., Ban Y. 2010, Monitoring impervious surface sprawl using tasseled cap transformation of landsat data, In: Wagner W., Székely, B. (eds.): ISPRS TC VII Symposium – 100 Years ISPRS, Vienna, Austria, July 5–7, 2010, IAPRS, Vol. XXXVIII, Part 7A.
ISSN: 2456-1878
www.ijeab.com Page | 209
[14]Park K. P., Um D. Y. 2015, Change Detection of Urban Areas in Seoul using Landsat Satellite Images, Advanced Science and Technology Letters Vol.100 (Architecture and Civil Engineering, pp.131-134 [15]Ndiaye M. L. 2015, Land use changes detection and
geomaticmodeling by multicriteriaevaluation for mapping of the vulnerable areas to flooding, Master, Option GIS and RemoteSensing, Mohammed V University / Craste_LF, 139 p.
[16]Jenson, J. R. 1983, Urban/suburban land use analysis. Manual of Remote Sensing, Vol. 2, second edition (Falls Church, Virginia: American Society of Photogrammetry), pp: 1571-1666.
[17]Lu D., Mausel, P., Brondízio, E., Moran, E.,2004, Change detection techniques, International Journal of RemoteSensing, 25:12, 2365-2401
[18]Singh A. 1989, Review Article Digital change detection techniques using remotely-sensed data, International Journal of Remote Sensing, Vol. 1, N° 6, 989-100.
[19]Cissé B. 2011, Les eaux de drainage des périmètres irrigues du Delta du fleuve Senegal : Systèmes d’évacuation et qualité des eaux. Thèse de Doctorat, Géographie UCAD. 310 p.
[20]Brusq J. Y. 1980.Studysoilbowls of LampsarValley (Region of Senegal river. Report. ORSTOM / SAED. 114 p.
[21]A. Ndiaye 2004. Fluvial dynamics and morpho-sedimentaryevolution of the estuary of the Senegal River after the impoundment of Diama dam. thesis. Sedimentaryenvironments. Geosciences. Cheikh AntaDiopUniversity of Dakar. 104 p.
[22]Barusseau JP 2009. Explanatory Notice of Senegalgeologicalmapat 1/500 000, northwestleaves, northeast and southwest. " Direction of Mines and Geology. Dakar-Senegal. 61 p.
[23]P. Sagna 2005. Climatedynamics and itsrecentdevelopments in the western part of West Africa, Volume I and II, 786 p.
[24]Sultan B. 2011. The study of variations and climate change in West Africa and itssocietal impact. HDR University Pierre and Marie Curie. France. 137 p. [25]ANSD2014, Final report RGPHAE 2013, 416 p. [26]Gibson P. and Power C. H. 2000, Introductory
Remote Sensing, digital image processing and application, published by Routledge 249p
[27]Yang, X., and Lo, C. P. 2002, Using a time series of satellite imagery to detect land use and land cover changes in the Atlanta, Georgia metropolitan area. International Journal of Remote Sensing, 23, 1775– 1798
[28]Prol-ledesma R. M., Uribe-Alcantara M. and Diaz-Molina, O.2002, Use of cartographic data and
Landsat TM images to determine land use change in the vicinity of Mexico City.International Journal of Remote Sensing, 23, 1927–1933.
[29]Chander G., Markham B., L., Helder D., L., 2013, Summary of current radiometric calibration coefficients for Landsat MSS, TM, ETM+, and EO-1 ALI sensors, Remote Sensing of Environment 113, 893–903
[30]Caloz R. and C. Collet 2001 Numerical traitement of remote sensing image. Remote sensing Pulled Silkscreen -Vol. 3, University Press of Quebec, 381p. [31]Bonn F., and Rochon C. 1996. Précis de la télédétection, Volume 2 Applications Thématiques, ¨Presse de l’Université du Québec / AUPELF, 633 p. [32]EB Dieye, Diaw AT, Diatta CS, DE Wispealare G. 2008. Spatial evolution of the mangrove of the Saloum estuary (Senegal) between 1972 and 1999 : Methodologicalapproach by RemoteSensing. Science and Technology Journal 2008, Vol . 6 No. 1, Faculty of Science and Technology, UCAD, Dakar, 36-48. [33]Hussain M., Chen D., Cheng A., Wei H., Stanley D.
2013, Change detection from remotely sensed images: From pixel-based to object-based approaches, ISPRS Journal of Photogrammetry and Remote Sensing 80, 91–106
[34]J. Y. Rent 1989 Saltedsoils of the lowvalley of the Senegal River : Characterization, distribution and evolutionunderculture.ORSTOM, Studies and PhD, Paris, France, 137 p.