The Thirty-Third AAAI Conference on Artificial Intelligence (AAAI-19)
TallyQA: Answering Complex Counting Questions
Manoj Acharya, Kushal Kafle, Christopher Kanan
Chester F. Carlson Center for Imaging ScienceRochester Institute of Technology {ma7583, kk6055, kanan}@rit.edu
Abstract
Most counting questions in visual question answering (VQA) datasets are simple and require no more than object detection. Here, we study algorithms for complex counting questions that involve relationships between objects, attribute identifi-cation, reasoning, and more. To do this, we created TallyQA, the world’s largest dataset for open-ended counting. We pro-pose a new algorithm for counting that uses relation networks with region proposals. Our method lets relation networks be efficiently used with high-resolution imagery. It yields state-of-the-art results compared to baseline and recent systems on both TallyQA and the HowMany-QA benchmark.
Introduction
Open-ended counting systems take in a counting ques-tion and an image to predict a whole number that an-swers the question. While object recognition systems now rival humans (He et al. 2016), today’s best open-ended counting systems perform poorly (Kafle and Kanan 2017b; Chattopadhyay et al. 2017). This could be due to an inability to detect the correct objects or due to an inability to reason about them. To address this, we distinguish betweensimple
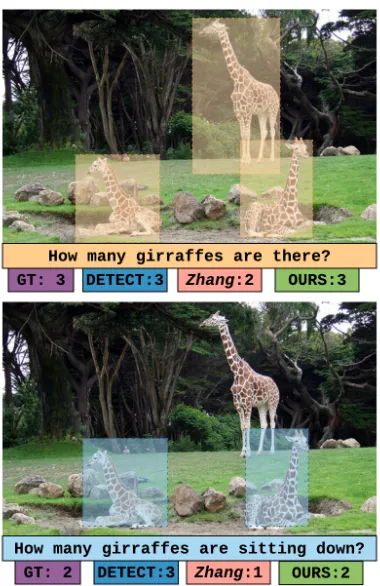
andcomplexcounting questions (see Fig. 1). Simple count-ing questions only require object detection, e.g., “How many dogs are there?” Complex questions require deeper analysis, e.g., “How many dogs are eating?”
Open-ended counting is a special case of visual ques-tion answering (VQA) (Antol et al. 2015; Malinowski and Fritz 2014), in which the goal is to answer open-ended questions about images. The best VQA systems pose it as a classification problem where the answer is predicted from convolutional visual features and the question (Kafle and Kanan 2017a). While this succeeds for many question types, it works poorly for counting (Kafle and Kanan 2017b; Chattopadhyay et al. 2017). Recently, better results were achieved by using region proposals generated by object de-tection algorithms (Trott, Xiong, and Socher 2018; Zhang, Hare, and Pr¨ugel-Bennett 2018). However, datasets mostly contain simple counting questions, as shown in Table 1. Due to their rarity, complex questions need to be analyzed sepa-rately to determine if a model is capable of answering them.
This paper makes three major contributions:
Copyright c2019, Association for the Advancement of Artificial Intelligence (www.aaai.org). All rights reserved.
Figure 1: Counting datasets consist mostly of simple ques-tions (top) that can be answered solely using object detection. We study complex counting questions (bottom) that require more than object detection using our new TallyQA dataset.
1. We describe TallyQA, the largest open-ended counting dataset. TallyQA is designed to study both simple tions that require only object detection and complex ques-tions that demand more. It is now publicly available. 2. We propose the relational counting network (RCN), a new
3. We show that RCN surpasses state-of-the-art methods for open-ended counting on both TallyQA and the HowMany-QA benchmark.
Related Work
VQA Datasets & Counting
Popular VQA datasets contain a significant number of count-ing questions, e.g., about 7% in COCO-QA (Ren, Kiros, and Zemel 2015), 10% of VQA1 (Antol et al. 2015), 10% of VQA2 (Goyal et al. 2017), and 10% of TDIUC (Kafle and Kanan 2017b). There are also counting specific VQA datasets. CountQA (Chattopadhyay et al. 2017) was created by importing question-answer (QA) pairs from the validation split of VQA1 and COCO-QA. This small dataset has only 2,287 test QA pairs. Recently, HowMany-QA (Trott, Xiong, and Socher 2018) was created by importing QA pairs from Visual Genome and VQA2, and it is considered the gold standard for open-ended counting. As shown in Table 1, com-plex questions are scarce in these datasets. Simple questions can be solved using solely an object detection algorithm, so they do not appropriately test a system’s ability to answer arbitrary counting questions, including those requiring rea-soning or attribute recognition. Our new dataset, TallyQA, is designed to evaluate both simple and complex counting questions, enabling these and other capabilities to be appro-priately evaluated. Note that we have limited our discussion to natural language VQA systems which pose different chal-lenges compared to VQA on synthetic datasets, which are often designed for specific purposes (Johnson et al. 2017; Kafle et al. 2018; Zhang et al. 2016).
Algorithms for Open-Ended Counting
Open-ended counting systems take as input a “How many ...?” question and an image and then output a count. This is a VQA sub-problem. For counting, there are two general approaches. The first involves inferring the count directly in an end-to-end framework operating on high-level CNN features. The second approach is to detect object bounding boxes or region proposals, and then aggregate question relevant bounding boxes. While there are many direct methods, over the past year region-based schemes for open-ended counting have been studied.
Direct Methods. State-of-the-art VQA systems train a clas-sifier to predict the answer from the image and question. Typ-ically, image features are encoded using a CNN that was pre-trained on ImageNet, and questions are encoded using a recurrent neural network (RNN). Many innovations involve different ways of combining image and question features (Lu et al. 2016; Fukui et al. 2016; Ben-younes et al. 2017; Kafle and Kanan 2016), modular networks (Andreas et al. 2016), data-augmentation (Kafle, Yousefhussien, and Kanan 2017) among many others.
Direct methods perform poorly at counting forreal-world
image datasets. In Kafle and Kanan (2017b), three state-of-the-art VQA algorithms were compared to baselines on TDIUC’s counting questions. The best performing method, MCB, achieved 51% accuracy, which was only 6% better
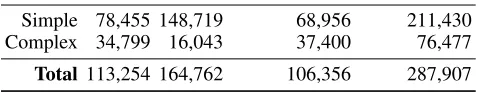
VQA2 TDIUC HowMany-QA TallyQA (Us)
Simple 78,455 148,719 68,956 211,430 Complex 34,799 16,043 37,400 76,477
Total 113,254 164,762 106,356 287,907
Table 1: The number of counting questions for previous VQA datasets compared to TallyQA dataset.
than an image-blind (question-only) model. This was true even though most of TDIUC’s counting questions are simple. This suggests these methods are primarily exploiting scene and language priors. For VQA2, the best method (Teney et al. 2017) of the CVPR-2017 VQA Workshop challenge achieved 69% overall, but only 47% accuracy on number questions, most of which are counting.
We hypothesize that the inability of VQA algorithms to count is due to the way their architectures are designed. These systems operate on image embeddings computed using a CNN. Mean pooling and weighted mean pooling (attention) operations may destroy information that can be used to deter-mine how many objects of a particular type are present.
Counting Specific Systems. While counting has long been studied for specific computer vision problems (Zhang et al. 2015; Dalal and Triggs 2005; Wang and Wang 2011; Ryan et al. 2009; Ren and Zemel 2017), only recently has open-ended counting in natural scenes been studied. Chat-topadhyay et al. (2017) studied open-ended counting in typi-cal scenes, and they evaluated three counting-specific meth-ods: DETECT, GLANCE, and SUBITIZE. DETECT is built on top of an object detection algorithm, which was Fast R-CNN (Girshick 2015) in their implementation. DETECT works by finding the first noun in a question and then match-ing it to the closest category the detection algorithm has been trained for (e.g., COCO objects). GLANCE uses a shallow multi-layer perceptron (MLP) to regress for specific object counts from a CNN embedding, with the appropriate out-put unit chosen based on the first noun. SUBITIZE involves breaking the image into a grid, extracting image embeddings from each grid location, aggregating information across grids using an RNN, and then predicting the count for every class in the dataset. Although none of these methods are capable of handling complex questions, all of them outperformed MCB, which was a state-of-the-art VQA model.
(a) Train (b) Test-Simple (c) Test-Complex
Figure 2: Histogram of answer counts for each of the three splits of TallyQA.
Both Trottet al. and Zhanget al. operate on region propos-als and loosely based on the idea of filtering out irrelevant boxes based on the question,i.e. selecting a subset of question relevant region proposals. However, successfully determining which boxes should be counted for a given question often requires comparing it with other object proposals (required for duplicate detection, comparative and positional reason-ing, etc.), and the background (for modeling context, finding relative size, etc.). Since neither of these algorithms performs any relational or comparative reasoning between the boxes, they may have an impaired ability to answer complex ques-tions. Here, our RCN model applies relational reasoning to object-object and object-background pairs, giving it a more robust capability to answer complex and relational questions. Indeed, our experiments show that RCN outperforms other models on complex questions.
The TallyQA Dataset
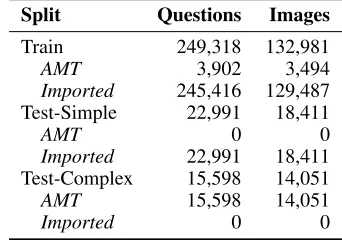
Complex counting questions are rare in existing datasets. This prompted us to create TallyQA. TallyQA’s test set is split into two parts: Test-Simple for simple counting ques-tions and Test-Complex for complex counting quesques-tions. We gathered new complex questions using Amazon Mechani-cal Turk (AMT), and imported both simple and complex questions from other datasets. Table 1 shows the total num-ber of questions in TallyQA compared to others, and it has over twice as many complex questions. The number of ques-tions in the train and test sets by source is given in Table 2. Fig. 4 shows example images and questions. Test-Simple and Test-Complex contain images from only Visual Genome, and Train has images from COCO and Visual Genome.
Collecting New Complex Questions
To gather new complex questions, we developed targeted AMT tasks that yielded 19,500 complex questions for 17,545 unique images. These tasks were designed to fight the biases in earlier datasets, where simple counting questions were pre-dominantly asked (Kafle and Kanan 2017a). TallyQA’s im-ages are drawn from both COCO and Visual Genome, which provides more variety than COCO alone. About 800 unique annotators provided QA pairs. For all tasks, annotators were not allowed to submit obviously simple questions, e.g., “How manyx?” and “How manyxin the photo?” We manually
Split Questions Images
Train 249,318 132,981
AMT 3,902 3,494
Imported 245,416 129,487
Test-Simple 22,991 18,411
AMT 0 0
Imported 22,991 18,411
Test-Complex 15,598 14,051
AMT 15,598 14,051
Imported 0 0
Table 2: Number of questions and images in TallyQA.
checked AMT questions to ensure they were complex, and we removed poor quality questions.
We endeavored to ensure non-zero complex questions were
difficult, e.g., “How many men are wearing glasses?” is not difficult if all of the men in the image are wearing glasses. To do this, annotators were told to ask questions in which there were counter examples, e.g., to ask “How many men are wearing glasses?” only if it had an answer greater than zero, and the contrary question “How many men arenotwearing glasses?” had an answer greater than zero.
We created a separate task to generate hard complex ques-tions with zero as the answer. Annotators were asked to make questions about objects with attributes not observed in the image, e.g., asking the question “How many dogs have spots?” when there was a dogwithoutspots in the image. Similar examples were shown to annotators before annotation.
Importing Questions from Other Datasets
TallyQA also contains questions imported from VQA2 and Visual Genome. A similar approach was used to cre-ate HowMany-QA (Trott, Xiong, and Socher 2018) and TDIUC (Kafle and Kanan 2017b). We imported all ques-tions beginning with the phrase “How many...” with answers that were whole numbers between 0–15. Following Kafle and Kanan (2017b), for VQA2, we required that 5 of the 10 anno-tators give the same answer. Although these questions were generated by humans, as seen in Table 1, most are simple.
gen-erated for COCO images using its semantic annotations. The creators used a variety of templates to introduce variation in the questions and used heuristics to avoid answer ambiguity. All template generated questions from TDIUC are simple. In addition to templates, we used their method for making “absurd” questions to create both simple and complex zero count questions. To do this, we first find the objects absent from an image based on its COCO annotations. Then, we randomly sample the counting questions from the rest of the dataset that ask about counting these objects.
Classifying Simple and Complex Questions
The Test-Complex dataset was made using only new, hu-man vetted complex questions from AMT. Because simple questions are common in existing datasets like VQA2, we used imported questions to make Test-Simple. To do this, we developed a classifier to determine if a question was simple. Our simple-complex classifier is made from a set of lin-guistic rules. First, any substrings such as “...in the photo?” or “...in the image?” were removed from the question. Then, we used SpaCy to do part of speech tagging on the remaining substring. It was classified as simple if it had only one noun, no adverbs, and no adjectives, otherwise it was deemed com-plex. This will classify questions such as “How many dogs?” as simple and “How many brown dogs?” as complex.
Every question classified as simple by our rules will be correct (i.e., the false positive rate is zero), making it suit-able for creating Test-Simple, but it may sometimes classify simple questions as complex (i.e., the false negative rate is non-zero). For example, the question “How many men are wearing red hats to the left of the tree?” would be classified as complex by our classifier. However, if there was only a single person in the image then it is not truly a complex question, despite the apparent complexity. These kinds of questions are rare and our simple-complex classifier works robustly, but it is possible that it will underestimate the number of simple questions and overestimate the number of complex when used to characterize a dataset. For this reason, we only use human-vetted questions in TallyQA’s Test-Complex set.
Dataset Splits & Statistics
TallyQA is split into one training split (Train) and two test splits: Test-Simple and Test-Complex. Using our simple-complex classifier, Train was found to have 188,439 simple and 60,879 complex questions. The number of questions in each split is given in Table 2. The test splits are comprised exclusively of Visual Genome imagery, and no images in the test splits are used in training.
A New Framework for Complex Counting
Our RCN model, depicted in Fig. 3, is formulated as a modi-fied relation network (RN) (Santoro et al. 2017) that can rea-son about the nature of relationships between image regions. RCN uses the questionQto guide its processing of a list ofnforeground region proposals,O ={o1, o2, . . . , on}, andm
background regions,B ={b1, b2, . . . , bm}, withoi ∈RK
andbj∈RK. Formally, our RCN model is the combination
of two RN sub-networks, i.e.,
Count(O, B, Q) =hγ(RN(O, O)⊕RN(O, B)), (1)
where⊕denotes concatenation,RN(O, O)represents the RN that infers the relationship between foreground regions,
RN(O, B)represents the RN responsible for inferring the relationship between each foreground and background region, andhγ is a neural network with parametersγthat predicts the final count.
The RN for predicting the relationship between foreground proposals in the context of questionQis given by
RN(O, O) =fφ1
X
i,j
gθ1(oi, oj, sij, Q)
, (2)
wherefφ1andgθ1 are neural networks with parametersφ1 andθ1, respectively, that each output a vector, and the
vec-torsij encodes spatial information about thei-th andj-th proposals. Like the original RN model, the sum is computed over alln2pairwise combinations. Similarly, the RN for pre-dicting the relationship of each proposal to the background is given by,
RN(O, B) =fφ2
X
i,j
gθ2(oi, bj, sij, Q)
, (3)
wherefφ2andgθ2 are neural networks with parametersφ2 andθ2, respectively, that output vectors. RCN has two major
innovations over the original RN approach.
The original RN used raw CNN feature map indices as re-gions. This worked well for CLEVR, but this approach works poorly for real-world VQA datasets that require processing at higher resolutions (e.g., VQA2). RCN overcomes this prob-lem by using region proposals. As input, the original RN model used thed2elements in ad×dconvolutional feature map, which were each tagged with their spatial coordinates. This means it computedd4 pairwise relationships. For
re-cent direct VQA methods, a CNN feature map is typically
14×14, meaning that 38,416 comparisons would be needed per counting query. In contrast, RCN’s proposal generator produces only 31.12 foreground regions and 16 background patches per image, so only31.122+ (31.12×16) = 1466
comparisons are made, on average. By using proposals, RCN reduces the number of comparisons by a factor of 26 and scales to real-world imagery, whereas the original RN model used lower resolution imagery and was only evaluated on CLEVR (Johnson et al. 2017), a synthetic dataset that has simple geometric shapes and a plain background.
Figure 3: Our RCN model computes the relationship between foreground regions as well as the relationships between the these regions and the background to efficiently answer complex counting questions. In this example, the system needs to look at the relationship of each giraffe to each other and with the water (background).
the background can help answer complex counting questions, which often involve attributes of background objects or rela-tionships between objects and background entities.
Internally, RCN uses the spatial relationship between re-gionsoiandoj to help predict the count. Usingsij is crit-ical to ensuring each object is counted only once during prediction, and it enables RCN to learn to do non-maximal suppression to cope with overlapping proposals. The spatial relationship vector is given by
sij=
`i, `j, ξij, IoUij, IoUij
Ai
,IoUij Aj
, (4)
where`iand`jencode the spatial information of each pro-posal individually,AiandAj are the area of proposals,ξij is the dot product between each proposal’s CNN features to model how visually similar they are, and IoUij is the intersection over union between the two proposals. The vec-tor`i =
xmin
W , ymin
H , xmax
W , ymax
H ,
xmax−xmin
W ,
ymax−ymin
H
, where(xmin, xmax)and(ymin, ymax)represent the top-left and bottom-right corners of proposali, andW andHare the width and height of the image, respectively.
Training & Implementation Details
The questionQis embedded using a one layer GRU that takes as input pre-trained 300-dimensional Glove vectors for each word in the question (Pennington, Socher, and Manning
2014) and outputs a vector of 1024 dimension. The GRU used in all models are regularized using a dropout of 0.3.
For foreground proposals, we use the boxes and CNN features produced by Faster R-CNN (Ren et al. 2015) with ResNet-101 as its backbone. The Faster R-CNN model is trained to predict boxes in Visual Genome, which contain a wide variety of objects and attributes. This approach for gen-erating proposals was pioneered by Anderson et al. (2018), and has since been used by multiple VQA systems.
For the background patches, we extract ResNet-152 fea-tures from the entire image before the last pooling layer and then apply average pooling over these features to reduce them to a4×4grid. Each of these 2048-dimensional vectors rep-resents a112×112pixel background region. In RCN,gθ has three hidden layers andgφhas one hidden layer, which each consist of 1024 rectified linear units (ReLUs). The out-puts of these networks are then concatenated and passed to
hγ, which has one hidden layer with 1024 units and ReLU activation. The softmax output layer treats counting as a clas-sification task, and it is optimized using cross-entropy loss. RCN is trained using the Adam optimizer with a learning rate of7e−4and a batch size of 64 samples.
Experiments
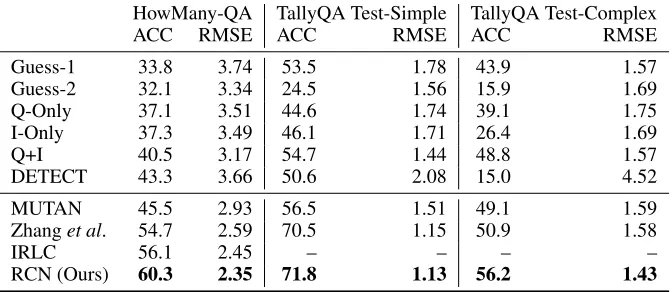
HowMany-QA TallyQA Test-Simple TallyQA Test-Complex
ACC RMSE ACC RMSE ACC RMSE
Guess-1 33.8 3.74 53.5 1.78 43.9 1.57
Guess-2 32.1 3.34 24.5 1.56 15.9 1.69
Q-Only 37.1 3.51 44.6 1.74 39.1 1.75
I-Only 37.3 3.49 46.1 1.71 26.4 1.69
Q+I 40.5 3.17 54.7 1.44 48.8 1.57
DETECT 43.3 3.66 50.6 2.08 15.0 4.52
MUTAN 45.5 2.93 56.5 1.51 49.1 1.59
Zhanget al. 54.7 2.59 70.5 1.15 50.9 1.58
IRLC 56.1 2.45 – – – –
RCN (Ours) 60.3 2.35 71.8 1.13 56.2 1.43
Table 3: Performance breakdown on TallyQA and Howmany-QA datasets using accuracy (%) and RMSE.
Models Evaluated
We compare RCN against two state-of-the-art models specif-ically for open-ended counting: Zhang, Hare, and Pr¨ugel-Bennett (2018) and IRLC (Trott, Xiong, and Socher 2018). We also compare against MUTAN (Ben-younes et al. 2017), one of best direct VQA methods. Lastly, we compare RCN to six baseline counting models:
1. Guess-1: Answer 1 for all questions. 2. Guess-2: Answer 2 for all questions.
3. Q-Only: An image-blind MLP model with a hidden layer of 1024 units that uses only the question. The question features are obtained from the last hidden layer of the same RNN architecture used by our RCN model. 4. I-Only: A question-blind MLP that has one hidden layer
with 1024 units.
5. Q+I: An MLP with 1024 hidden units that uses both image and question features.
6. DETECT: DETECT is an upgraded version of the method from (Chattopadhyay et al. 2017). The main difference is that we use the more recent YOLOv2 (Redmon and Farhadi 2017) method instead of Fast R-CNN. DETECT extracts the first noun from the question. It then finds the most semantically similar category that YOLOv2 was trained on to that noun based on word similarity, and then it outputs the total number of YOLOv2 boxes produced for that category.
MUTAN, I-Only, and Q+I use ResNet-152 features. Q-Only, I-Only, Q+I, MUTAN, Zhanget al. , and RCN all use cross-entropy loss and treat counting as a classification problem. Before evaluation, the output of all models was rounded to the nearest whole number and constrained to be within the range of values in the datasets.
Results
Results for all methods on HowMany-QA and both of TallyQA’s test sets are given in Table 3. Following earlier work (Chattopadhyay et al. 2017; Trott, Xiong, and Socher 2018; Zhang, Hare, and Pr¨ugel-Bennett 2018), we compute both accuracy and RMSE. RMSE captures that larger errors should be penalized more heavily.
Test-Simple Test-Complex ACC RMSE ACC RMSE
RCN – No Background 69.4 1.18 51.8 1.50 RCN – Full 71.8 1.13 56.2 1.43
Table 4: Performance on TallyQA using accuracy (%) and RMSE showing the advantage of using background relation-ships compared to a version of RCN that omits them.
HowMany-QA. HowMany-QA is made by combining counting questions from VQA2 and Visual Genome, so good performance on it serves as a surrogate for good performance on VQA2. HowMany-QA is the best-known dataset for open-ended counting. RCN, IRLC, and Zhanget al. all use identi-cal region proposals and CNN features.
RCN obtains the highest accuracy on HowMany-QA, outperforming IRLC, which was the best-known result. Zhanget al. achieves the third-highest accuracy. Kim, Jun, and Zhang (2018) used the Zhanget al. method to answer VQA2’s counting questions. Although they achieved only third best overall in the CVPR 2018 VQA2 Workshop Chal-lenge, they won for number questions.
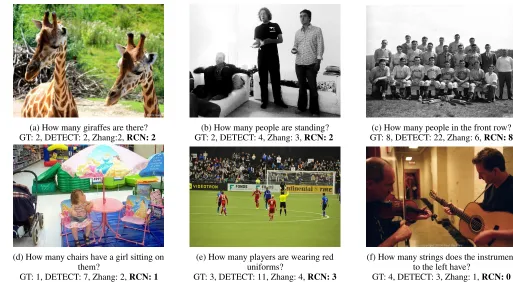
TallyQA. Example outputs for TallyQA are shown in Fig. 4. IRLC’s authors were unable to share code with us, so we could not test IRLC on TallyQA. Zhanget al. uses the same Faster R-CNN region proposals and CNN features as RCN.
For Test-Simple, RCN achieves the best accuracy, with Zhang et al. performing only slightly worse. On Test-Complex, RCN also achieves the highest accuracy. The next best method is again Zhanget al. , but there is a greater gap between the two models. This may be because Zhanget al. does not have an explicit mechanism for relational reasoning between objects and backgrounds, potentially impairing its ability to identify duplicates and compare attributes from different image regions.
Consistent with our claim that complex questions require more than detection, DETECT is the worst performer on Test-Complex. DETECT performs better on Test-Simple, but there is still a large gap between it and RCN.
(a) How many giraffes are there? GT: 2, DETECT: 2, Zhang:2,RCN: 2
(b) How many people are standing? GT: 2, DETECT: 4, Zhang: 3,RCN: 2
(c) How many people in the front row? GT: 8, DETECT: 22, Zhang: 6,RCN: 8
(d) How many chairs have a girl sitting on them?
GT: 1, DETECT: 7, Zhang: 2,RCN: 1
(e) How many players are wearing red uniforms?
GT: 3, DETECT: 11, Zhang: 4,RCN: 3
(f) How many strings does the instrument to the left have?
GT: 4, DETECT: 3, Zhang: 1,RCN: 0
Figure 4: Example model outputs on TallyQA. While other models fail at positional reasoning questions (e.g. Fig. 4c), RCN can infer an object’s relative position to other objects. Since RCN is based on region proposals, it struggles when proposals do not align with question relevant objects (Fig. 4f).
Table 4, this hurts performance for both simple and complex questions showing the value of the background model.
Positional Reasoning Questions. Since RCN uses object-based relational reasoning, we expect it to outperform other methods for positional reasoning questions. To study this, we filtered out positional reasoning questions from TallyQA’s Test-Complex set using common qualifiers such asleft, right, top, up, bottom, near, on, in, and then we measured accuracy for Zhanget al. and RCN. We found that RCN outperformed Zhanget al. ’s model by 6.38% absolute for these questions, which further demonstrates RCN’s efficacy.
Performance Without Location Features
To assess the impact of using the spatial location informa-tion of each proposal, we conducted an experiment in which we removed the location features sij given to RCN. For HowMany-QA, removing location caused a 5.4% decrease in accuracy (absolute). For TallyQA, it caused a decrease of 2.8% accuracy (absolute) for Test-Simple and 2.4% accuracy (absolute) for Test-Complex.
Comparison with the Original RN
The original RN model uses raw CNN feature maps, rather than region proposals. Running the original RN model on HowMany-QA, it achieved 3.46 RMSE and about 20% less accuracy (absolute) than RCN. RCN likely achieves better performance due to its improved architecture and due to using region proposals.
Visualizing RCN
To visualize RCN’s inference process, we modified Grad-CAM (Selvaraju et al. 2017). Grad-Grad-CAM is a technique that, for a given prediction, generates a coarse heat map based on the gradient flow in the final convolutional layers. To adapt Grad-CAM to RCN, it is necessary to derive scores for each proposal. To do this, we first find the pairwise object-background scorescore(oi, bj)using the gradient obtained at layergθ2. We then assign a score to each proposal using score(oi) = maxi,jscore(oi, bj). Scores for all proposals are then scaled from 0 to 1 and visualized on the original image. Examples are shown in Fig. 5.
Discussion
(a) How many people are wearing long dresses?
(b) How many people are sitting on a horse?
(c) How many people are wearing glasses?
(d) How many people have a hat? (e) How many players are wearing red? (f) How many white cows are there?
(g) How many dogs are sleeping in the image?
(h) How many street lights are to be seen behind this man?
(i) How many of the planes are on the ground?
Figure 5: Modified Grad-CAM visualizations show where RNC is looking to make predictions. The importance of each object proposals is proportional to the color intensity of the bounding boxes.
We found that region based methods, such as RCN, IRLC, and the Zhanget al. model have better results compared to direct methods, e.g., MUTAN (Ben-younes et al. 2017). However, all of these region based models, including ours, are not based on actualnameableobjects butobject proposals, which range from 10–100 in number for each image and can consist of many non-object regions and overlapping boxes. Intelligently pruning/refining of these proposals may improve performance of these systems. We tried simple non-maximal suppression to prune out the overlapping boxes for RCN, but it did not improve performance. We believe this to be due to the relational capacities of RCN which can learn to ignore duplicate or similar boxes based on the features and positions of the boxes more intelligently than off-the-shelf non-maximal suppression.
Conclusions
In this paper, we distinguished between simple and com-plex open-ended counting questions in VQA, where simple questions could be correctly answered using object detection alone. To do this, we created TallyQA, the world’s largest
dataset for open-ended counting using VQA, which will be made publicly available. We also described the RCN frame-work and showed that it can effectively answer both simple and complex counting questions compared to baseline mod-els and state-of-the-art approaches for open-ended counting. RCN combines region proposals with relationship networks, enabling them to be efficiently used with high-resolution im-agery. We found that RCN worked especially well compared to others on complex questions. Our work better defines the issues with open-ended counting, and sets the stage for future work on this problem.
Acknowledgments
We thank Robik Shrestha for useful discussions. The lab thanks NVIDIA for the donation of a GPU, and we thank Alexander Trott for assistance with HowMany-QA.
References
attention for image captioning and visual question answering. InCVPR.
Andreas, J.; Rohrbach, M.; Darrell, T.; and Klein, D. 2016. Learning to compose neural networks for question answering. InNAACL.
Antol, S.; Agrawal, A.; Lu, J.; Mitchell, M.; Batra, D.; Zit-nick, C. L.; and Parikh, D. 2015. VQA: Visual question answering. InICCV.
Ben-younes, H.; Cadene, R.; Cord, M.; and Thome, N. 2017. Mutan: Multimodal tucker fusion for visual question answer-ing. InICCV.
Chattopadhyay, P.; Vedantam, R.; RS, R.; Batra, D.; and Parikh, D. 2017. Counting everyday objects in everyday scenes. InCVPR.
Dalal, N., and Triggs, B. 2005. Histograms of oriented gradients for human detection. InCVPR.
Fukui, A.; Park, D. H.; Yang, D.; Rohrbach, A.; Darrell, T.; and Rohrbach, M. 2016. Multimodal compact bilinear pooling for visual question answering and visual grounding. Girshick, R. 2015. Fast R-CNN. InICCV.
Goyal, Y.; Khot, T.; Summers-Stay, D.; Batra, D.; and Parikh, D. 2017. Making the V in VQA matter: Elevating the role of image understanding in visual question answering. InCVPR. He, K.; Zhang, X.; Ren, S.; and Sun, J. 2016. Deep residual learning for image recognition. InCVPR.
Johnson, J.; Hariharan, B.; van der Maaten, L.; Fei-Fei, L.; Zitnick, C. L.; and Girshick, R. 2017. Clevr: A diagnostic dataset for compositional language and elementary visual reasoning. InCVPR.
Kafle, K., and Kanan, C. 2016. Answer-type prediction for visual question answering. InCVPR.
Kafle, K., and Kanan, C. 2017a. Visual question answering: Datasets, algorithms, and future challenges.CVIU.
Kafle, K., and Kanan, C. 2017b. An analysis of visual question answering algorithms. InICCV.
Kafle, K.; Cohen, S.; Price, B.; and Kanan, C. 2018. DVQA: Understanding data visualizations via question answering. In
CVPR.
Kafle, K.; Yousefhussien, M.; and Kanan, C. 2017. Data augmentation for visual question answering. InINLG. Kim, J.-H.; Jun, J.; and Zhang, B.-T. 2018. Bilinear attention networks. arXiv preprint arXiv:1805.07932.
Lu, J.; Yang, J.; Batra, D.; and Parikh, D. 2016. Hierarchical question-image co-attention for visual question answering. InNIPS.
Malinowski, M., and Fritz, M. 2014. A multi-world ap-proach to question answering about real-world scenes based on uncertain input. InNIPS.
Pennington, J.; Socher, R.; and Manning, C. 2014. Glove: Global vectors for word representation. InEMNLP.
Redmon, J., and Farhadi, A. 2017. YOLO9000: better, faster, stronger. InCVPR.
Ren, M., and Zemel, R. S. 2017. End-to-end instance seg-mentation with recurrent attention. InCVPR.
Ren, S.; He, K.; Girshick, R.; and Sun, J. 2015. Faster R-CNN: Towards real-time object detection with region pro-posal networks. InNIPS.
Ren, M.; Kiros, R.; and Zemel, R. 2015. Exploring models and data for image question answering. InNIPS.
Ryan, D.; Denman, S.; Fookes, C.; and Sridharan, S. 2009. Crowd counting using multiple local features. In Digi-tal Image Computing: Techniques and Applications, 2009. DICTA’09., 81–88. IEEE.
Santoro, A.; Raposo, D.; Barrett, D. G.; Malinowski, M.; Pascanu, R.; Battaglia, P.; and Lillicrap, T. 2017. A simple neural network module for relational reasoning. InNIPS. Selvaraju, R. R.; Cogswell, M.; Das, A.; Vedantam, R.; Parikh, D.; Batra, D.; et al. 2017. Grad-cam: Visual explana-tions from deep networks via gradient-based localization. In
ICCV.
Teney, D.; Anderson, P.; He, X.; and Hengel, A. v. d. 2017. Tips and tricks for visual question answering: Learnings from the 2017 challenge.arXiv preprint arXiv:1708.02711. Trott, A.; Xiong, C.; and Socher, R. 2018. Interpretable counting for visual question answering. InICLR.
Wang, M., and Wang, X. 2011. Automatic adaptation of a generic pedestrian detector to a specific traffic scene. In
CVPR.
Zhang, C.; Li, H.; Wang, X.; and Yang, X. 2015. Cross-scene crowd counting via deep convolutional neural networks. In
CVPR.
Zhang, P.; Goyal, Y.; Summers-Stay, D.; Batra, D.; and Parikh, D. 2016. Yin and yang: Balancing and answering binary visual questions. InCVPR.