Econometric Modeling of The Educational Institution For
Human Development and Forecast of Development
in 2019–2023
Akmal Alimjonovich Salimov
Independent researcher at the National University of Uzbekistan
Introduction
Along with the structural shifts in the development of economic relations, the systemic evolution of human potential is accompanied by an increase in the role of non-material production. Funding of intellectual resources remains the basis of sustainable economic development. In turn, sustainable economic growth requires the creation of favorable conditions for the functioning of human capital. In this regard, it is especially important to explore the trends, content and elements of human capital development and transformation based on innovation in vocational education. Innovation in higher education, development of science and technology make human capital a factor of economic growth. It has helped develop and implement the 4th technological curriculum in advanced economies in developed countries and has led the transition to a highly industrially-developed economy. In advanced countries, the knowledge economy and information society have begun to emerge.
Today, higher education institutions should be focused on providing quality higher vocational education on the basis of innovation. The modern high school, which is a direct source of extensive recruiting, has a strategic impact on the transformation
of human capital and identifies the opportunities and prospects for
its intensive development through the use of innovation. However, unlike most developed countries, the Uzbekistan Higher Educational Institution was not considered as important research and innovation centers. In Uzbekistan, development of education can not be considered a science-based development, but only in the context of education and science can create a network of research institutes in these two important areas of social life. This will help to increase the investment climate in the regions due to the innovative orientation of education and also technology transfer.
Education or health within the human capital theory is an object of investment to increase labor productivity to increase production of goods and services on the one hand and, on the other, to increase employee earnings. For people who support the concept of human development, the key to economic development is the human being. It acknowledges that human capital plays a
central role in increasing labor productivity, but defines the goal
of creating an economic and social environment that promotes the development and utilization of each individual’s potential. Increasing human potential can lead to higher incomes and economic productivity.
In the early years of independence, the Law “On Education” and
the “National Program of Personnel Training” were adopted, aimed at the elimination and radical reform of the education system, including the existing system of higher vocational education.
Literature review
As you know, the economic growth promotes the development of human potential and, in particular, raising the level of education of the population in one or another country. At the same time, education is a factor in spontaneous economic growth and the formation of national wealth. For example, Edison Denison was born in 1929-1982. an increase in the average employee retirement rate indicates that per capita income in the United States is at least a quarter of a decline. [1]
The new growth theories (Lucas, 1988: 3-42; Romer, 1987: 16-201, Romer, 1990: 71-102) recognize that productivity increases due to internal factors related to human capital. These factors are also the driving force of capital increase.
According to other theories, the current economic growth is mainly determined by the scope and content of research and development activities (R & D). However, ITTKI ultimately depends on the development of human capital. Growth patterns, which are crucial to human capital, show that education provides more effective use of “positive exogenous factors” within the production process. Thus, education-level differences can be attributed to the inequality in income between rich and poor countries or regions. However, economic growth in Japan, the United States, and the West European countries has been growing for centuries in a relatively fast growing world of capital accumulation. In the theory of economic growth, which is crucial to the RIT, the
expansion of scientific and technical knowledge is promoting labor
productivity and other productive factors. The key ingredients of these models are that long-term growth rates are largely determined by investment in R & D. This, of course, will lead to the successful
development of firms that have invested in these investments.
However, human capital plays an important role in this growth. Systematic use of knowledge in science is based solely on
achievements in the field of education. It is a requirement for
highly skilled workers and engineers who have advanced skills needed to carry out relevant research and have the ability to apply modern knowledge. The mechanisms of higher education’s social and economic development are not clear, and accurate estimation of this contribution is unacceptable to the staff of the World Bank Institute. Thus, education plays a special role in human factors and social productivity. The investment network of this spiritual Abstract
The article also outlines the prospects of econometric modeling of education in the republic and development prospects for 2019-2023. The impact of the increase in expenditures from the state budget on the development of the general education and higher education system has been influenced by the increase in GDP.
Keywords
production is a unique, high-quality source of experience that can not be included in other activities. [2]
Assessment of the situation in the development of science in higher education requires an international comparison of a number of indicators. It is possible to positively assess the participation of
entrepreneurship in science financing in Uzbekistan. That is,
the existence of certain relationships between enterprises and universities that carry out research results will help to create an effective technology transfer technology. In low-quality human capital, investments in hi-tech industries do not change. The
experience of other countries shows that, first and foremost, the
culture and capacities of the majority of the population in the education system are the basis for human capital formation. Education directly affects economic development through the following components:
1. Introduction of scientific discoveries, innovation projects, modern technologies. The efficiency of using all types of resources
in production can only be substantially enhanced by the inclusion
of scientific discoveries in the modern technological process.
Various theories of economic growth indicate that sustainable economic growth can only be achieved through innovative economic development;
2. Workforce quality and its classification. Social investment,
especially in the development of education and health, is a major barrier to economic growth.
If there is a lack of professional professionals in production, we
can not attract new and highly accurate technologies in this field.
The source of knowledge, the qualitative, the so-called “cradle”
for training qualified personnel, becomes an important factor in
introducing innovations. Education provides a high level of use
of new technologies, the efficiency, competitiveness, innovative
attractiveness and security of the national economy.
Again, it is obvious that the amount of investment needed to develop human resources and to improve the quality of education should be higher than the capital investment directed to the production of goods and services. In this regard, Malaysia, Mauritius, South Korea, and Singapore are examples of progressive efforts to form an advanced education system at the early stages of development. 3. The basics of environmental protection, the prevention of pollution, the introduction and practical application of knowledge of biological diversity, ecological culture promotion. Countries that are paying close attention to these problems prevent the effects of industrial and agrarian policies that waste resources and pollute the environment.
4. Influence of industry, agriculture, transport, production and
service sector on transition from traditional production to high technologies.
Uzbekistan has all the capabilities to prevent the world from falling behind most of the world’s GDP indicators. First of all, this can be achieved through deepening reforms by increasing the
investment climate in the financial sector, the material industries,
and the manufacturing infrastructure that serves them. But for this
purpose, first of all, it is necessary to carry out significant reforms
in the social sphere of the country. This sector needs to focus on a
large number of investment, primarily in the education system. Investing in the education sector is not a sudden, but a long-term consequence. The larger the scale of this effect, the more
difficult the task will be. It is difficult to calculate the effectiveness
of national investment in the education sector. In this case, the effectiveness of education-oriented investment will be evident in all aspects of the economy and in the social sphere at different times and at different times. Also, spending on education can not have expected economic outcomes due to certain subjective reasons. Here are the reasons for this:
- Serious errors in the incorrectly chosen policy of the country. For example, to accelerate the development of industries related to the extraction of extractive industry, high-liquidity raw materials, without the proper support of high-tech industries and services. This can negatively affect the long-term interests of the national economy. As a result, the increase in the level of education of the population of the country is not the same as in the economic sphere,
and the decline of qualified personnel. Insufficient development of science, high-tech industries, lack of funding, lack of financial
incentives and innovation activities in the country can lead to
the loss of qualified specialists and scientists. In this case, large
amounts of money spent for the training of specialists will be appropriated by other countries capable of offering favorable
conditions for scientific, innovation and production activities;
- Incompatibility of the educational process with the needs of employers. As a result, graduates of educational institutions are unable to apply the knowledge gained during the learning process and can not adapt the advanced foreign experience to local conditions;
- The low quality of educational institutions, the high level of corruption in them, and consequently the decline in the quality of training and the lack of knowledge of the graduates.
In other words, if the quality of work is determined by false knowledge, radical transformation of this quality is more expensive than modern education and the creation of a qualitative new work on the basis of other workers. Investments will only return after a certain period of time. The amount and quality of human capital depends primarily on the mentality, education level, knowledge and health of the population. It is possible to get a great deal from investment in education, science and health, not in investments in the short term, but in the mentality formed over centuries. Labor, its quality and productivity are an important part of human capital. Quality of work, in turn, is determined by the quality of life and quality of life of the population. Different methodological approaches are used to calculate the value of human capital (Table 1).
T. Shults studies human capital as re-production of labor, regardless of their source of income (family budgets, current production costs, public expenditure for social purposes, etc.). The results of such investments are investments in people’s ability to work, their creative activity in society, protection of people’s lives and health. T. Shults has the necessary characteristics of the human capital development, has the ability to update and reproduce.
Table 1 : Methodological approaches to human capital assessment
№ Basic Approaches Purpose
1. T. Shults's approach to the labor force as an accumulated expenditure
2. A. Smith's approach to education
expenditures as an investment acknowledges that the person who has been trained by working and spending time can be compared to another machine. 3. V.Petti, A.Marshall’s views They propagandize the idea of human capital accumulation, professionalism, and
experience on labor productivity 4. S.G.Strumilin, L.Dublin’s
Discount Method Education investment will be economically profitable. 5. E.Denison’s economic turnaround
approach to human investments It determines that 3/5 of the variables in income earnings are linked to the effectiveness of the learning process. 6. Dj. Kendrik’s “continuous
inventory” is a cost-effective way to calculate the value of human capital
labor force leakages, retraining, professional development, healthcare and others until they reach the age of maturity and occupy a certain specialty in the human capital investment in family and society. The foundation included housing, long-term consumer goods, goods in households, research and development.
7. G. Becker’s human capital concept The use of innovative resources due to the cutting edge technology determines the
low efficiency.
8. M. Fridmencha is a monetarized
interpretation of human capital it looks like human capital as an alternative to money. 9. P.Gregori and DjCholzhez and the
Russian Institute for Economic Situation and Public Health Monitoring
The method of salary classification has been developed based on the knowledge gained
during the course.
10. Dj. Minser’s method of assessing the continuity of education and workforce in human capital
that the worker is dependent on the total number of years of general education, vocational training and age.
11. K. B. Malligan and X. P. Methodology for evaluating the total human capital reserves under Martin’s index system
the level of employee earnings depends on the amount of human capital they have accumulated.
12. Fraskat Methodology of the US
National Science Foundation The period between the implementation of the ISTI and the period of reimbursement in the human capital accumulated as a reserve of knowledge and experience. 13. World Bank’s methodology accumulated knowledge and other components of human capital. It includes science,
education, culture and arts, health and information. 14. Discount method used to estimate
the value of human capital offered by Universal Bank analysts
The value of the gross national wealth is calculated on its value. Then the amount deducted from the value of land, mineral resources, forest and river resources, production capital and other assets. As a result, the human capital remains.
15. Authoring Approach Improving state mechanisms aimed at creating conditions for greater returns from human capital investments, in particular for general secondary and higher education, on the basis of GDP impact.
Source: author`s development
In addition to raising human capital skills, it also recognizes the value of training, education and training of new workers. Despite the many approaches to calculating the amount of capital formation, the importance of the education system in human capital accumulation is undoubtedly large. By investing in education, the individual relies on a single standard of education based on information on taxes, wages and salaries, education costs. A classmate of political economics, learning costs as capital investment, considers that a person who has been educated through extensive work and time can be compared to another machine. The
idea of influencing human capital, professionalism and experience
on labor productivity is described in the works of classics and neoclassical economics by V.Petti and A.Marshall.
Different theoretical and empirical aspects of the economic benefit
of education investments are based on the method of discounting by the Russian researcher S.G.Strumilin and the English L.Dublin. Dj. Kendrik offered a cost-effective way to calculate the value of human capital - a method of calculating the investment of human
capital based on statistical data. This methodology was convenient for the USA, which has broad and reliable statistical data. Dj. Kendrick has invested in human capital investments into labor force labor, retraining, upgrading, healthcare, and others until they have reached the age of maturity and occupy a certain specialty. The foundation included housing, long-term consumer goods, goods in households, research and development.
Institute of Monitoring of Labor and Employment of the Institute for Economic Situation and Public Health of K.Sabirjanova and D. Nesterova, are based on the knowledge gained from the education process. [4]
Dj. Minser’s works include the evaluation of human capital education and continuity of labor activity. Based on the US 1980s statistics, Dj. Minser has found that human capital productivity is dependent on the number of years of general education, vocational training and age of the worker [5]. The method of measuring the stock of gross human capital is derived from indices using the works of K. Malligan and X.S.Martin [6] .They indicate that the level of employee earnings depends on the amount of human capital accumulated. Researchers about textile production capacity were investigated in works of young economist Tursunov B.O. [7-15]
Research Methodology
The study used induction and deduction, analysis and synthesis, systematic approach to economic phenomena and processes, econometric modeling methods.
Analysis and results
The main purpose of the research is to create a regression and correlation model of the impact of education expenditures on the
state budget, which is a factor influencing the growth of GDP in
our country, and to forecast the model. Moreover, the impact of the state budget on pre-school education, public education, secondary vocational education, and higher education expenditures on the growth of the country’s GDP is a multi-factor regression and correlation econometric modeling and prediction of this model. Simple and multi-factor regression and correlation econometric model based on the data of 2010 - 2018 years. We use Eviews 9, which is widely used in econometrics, to create these models.
Before creating an econometric model, we select the variables. In the usual regression and correlation econometric model, the GDP
(Y) in our country and the factor influencing it were defined as
the cost factor (Xi) for the state budget. We describe the impact of the factor affecting GDP on the following simple regression and correlation econometric formula.
Yi=β0+ β1Хi +εi(1)
In addition to the usual regression and correlation econometric model, the most important factor in the creation of multi-factor regression and correlation econometric model is the cost of pre-school education (X1), public education cost (X2), secondary speciCreating a simple regression and correlation economical model above (1) is performed in practice by using the “least squares” (Ordinary small squares). The results of this simple regression and correlation economical model analysis are shown in Table 2 below.
The following multi-factor regression model has been developed for the above calculationsalized vocational education (X3) and Higher Education Costs (X4), have a multi-factor regression and correlation econometric formula.
Y=β0+ β1 Х1 + β2 Х2 + β3 Х3+ β4 Х4 +ε(2)
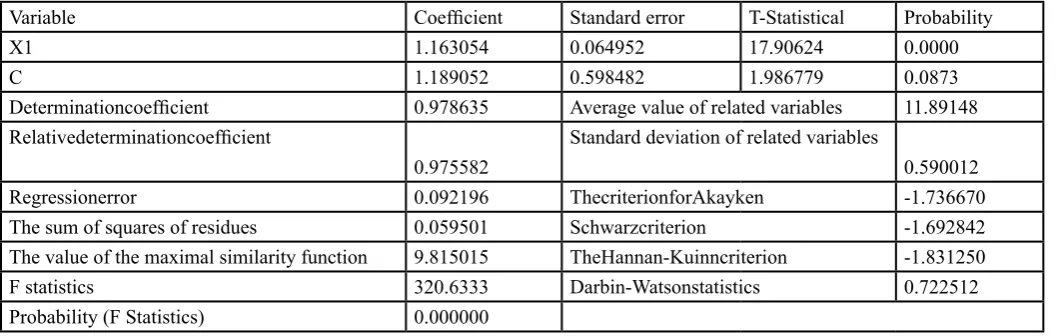
Creating a simple regression and correlation economical model above (1) is performed in practice by using the “least squares” (Ordinary small squares). The results of this simple regression and correlation economical model analysis are shown in Table 2 below.
The following multi-factor regression model has been developed for the above calculations.
ln=1.189052+ 1.163054lnX1+ε
Table 2 :Results of simple regression and correlation analysis based on Eviews software Results of simple regression and correlation analysis based on Eviews software
Relatedvariable: Y
Method: Thesmallestsquares Date: 02/17/19 Time: 23:24 Information: 2010-2018
Variable Coefficient Standard error T-Statistical Probability
X1 1.163054 0.064952 17.90624 0.0000
C 1.189052 0.598482 1.986779 0.0873
Determinationcoefficient 0.978635 Average value of related variables 11.89148
Relativedeterminationcoefficient
0.975582
Standard deviation of related variables
0.590012
Regressionerror 0.092196 ThecriterionforAkayken -1.736670
The sum of squares of residues 0.059501 Schwarzcriterion -1.692842 The value of the maximal similarity function 9.815015 TheHannan-Kuinncriterion -1.831250
F statistics 320.6333 Darbin-Watsonstatistics 0.722512
Probability (F Statistics) 0.000000
Souce: Eviews has been prepared by the author.
Regression analysis of the data in Table 1 shows that the calculated variable GDP (Y) is the cost of the education system (X1)
independent of the calculated budget. The shifted coefficient of coefficients showed how well the model was fitted to the data. As the correlation coefficient is closer to the extent that it is dependent on the change in GDP that varies depending on the cost of education
The coefficient of coefficient generated in the model illustrates that 97.5 percent of GDP (Y) is dependent on education costs, which
are considered to be models. The remaining 2.5% are dependent on other unaccounted factors. The cost of education, calculated as
the factor affecting GDP (Y), is determined at the 5% coefficient of the coefficient. The cost of the regression model (X1) is likely to be less than one percent of the P-value, which means that the coefficient affects the GDP change. Created regression model Fischer’s
F-Statistics The probability of the P-value is less than 0.05, indicating that the variable and independent variables affect the variable GDP. We carry out a diagnostic analysis to determine the suitability of the model being modeled. First, we check the presence of auto corrosion problems in the residues of the model. Autocorrelation in the remains is determined by the Breach-Godfrey test (Table 3).
Table 3 : Breach-Godfrey motor vehicle test results
F-statistics 2.296273 Probability F (4.3) 0.2603
Tracking * R-squared 6.784178 Probability. chi-square (4) 0.1477
Based on the Breuche-Godfrey test, it was found that there was no autocorrelation among the remnants. Because the Chi-square probability is greater than 0.10, zero hypothesized residues show that the acceptance of the hypothesis that there is no autocorrelation. After the brewing-godfreyautorecroduction test, we perform a geterosclerical test of the remnants. Geteroskedastic test is determined by the Breus-Pagan-Godfrey test (Table 4).
Table 4 : Breach-Pagan-Godfrigeteroskedastic test result
F-statistics 2.461056 Probability F (1.7) 0.1607
Tracking * R-squared 2.341124 Probability. chi-square (1) 0.1260 Explaining the total square sum 1.175357 Probability. chi-square (1) 0.2783 Souce: Eviews has been prepared by the author.
Based on the results of the Breus-Pagan-Godfrihysteroscytetal test, there was no evidence that there were any heteroscedastic oscillations among the residues. Because the Chi-square probability is greater than 0.10, the zero hypothesis indicates that the remnants accept the hypothesis that there is no hieroglycaseal vibration. That is, the remnants of the embedded model have gomoskedastic oscillations. Diagnostic tests suggest that the presence of autocorrelation on residues of the model and the residual oscillation of the residual gomoskedastic means predict the model.
Discussion results
In sum, it should be noted that the 1% increase in the cost of the education system will lead to an increase in GDP by 1.16%. Investments
in the education system provide GDP growth. As regards the GDP (Y) and factors influencing the development of a multi-factor
regression model, the cost of preschool education (X1), public education cost (X2), secondary vocational education (X3) and higher education expenditure (X4) , but due to multicollinearity problem, a multi-factor regression model was created that reduced the cost of elementary education (X1) and higher education expenditures (X4) (Table 5).
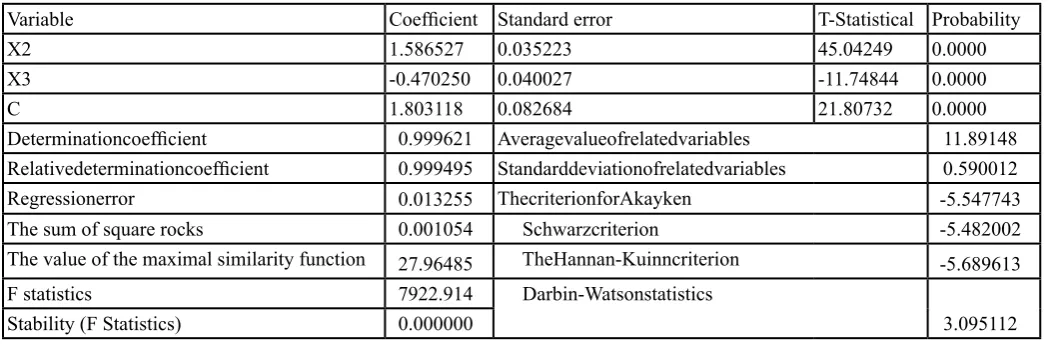
Table 5: Results of multi - factor regression and correlation analysis based on Eviews software Relatedvariable: Y
Method: Thesmallestsquares Date: 02/17/19 Time: 23:24 Information: 2010-2018 NumberofTrains: 9
Variable Coefficient Standard error T-Statistical Probability
X2 1.586527 0.035223 45.04249 0.0000
X3 -0.470250 0.040027 -11.74844 0.0000
C 1.803118 0.082684 21.80732 0.0000
Determinationcoefficient 0.999621 Averagevalueofrelatedvariables 11.89148
Relativedeterminationcoefficient 0.999495 Standarddeviationofrelatedvariables 0.590012
Regressionerror 0.013255 ThecriterionforAkayken -5.547743
The sum of square rocks 0.001054 Schwarzcriterion -5.482002
The value of the maximal similarity function 27.96485 TheHannan-Kuinncriterion -5.689613 F statistics 7922.914 Darbin-Watsonstatistics
3.095112 Stability (F Statistics) 0.000000
The following multi-factor regression model has been developed for the above calculations.
ln=β0+ 1.586527ln Х2 + -0.470250ln Х3 +ε
The coefficient of coefficient generated in the model illustrates that 99% of GDP (Y) is related to the cost of public education (X2)
and the cost of secondary vocational education (X3), which are modeled factors. The remaining 1 percent is based on other factors that are not accounted for. The cost of public education and the cost of secondary vocational education, which is the factor affecting
GDP (Y), were determined at the 5% coefficient of the coefficient. The cost of public education expenditure (X2) and the cost of
secondary vocational education (X3) for the regression model is less than the probability of the P-value of 0.05, indicating that these
coefficients influence GDP growth. Stored regression model Fischer F Statistics F The probability of the P value is less than 0.05, indicating that the cost of public education (X2) and secondary specialized vocational education (X3) are influenced by variable
GDP dependent factors. We carry out a diagnostic analysis to determine the suitability of the model being modeled. First, we check the presence of auto corrosion problems in the residues of the model. Autocorrelation of the residues is determined by the Breach-Godfrey test (Table 6).
Table 6 : Breach-Godfri autocorrelation test
F-statistics 1.332726 Probability F (4.3) 0.3601
Tracking * R-squared 3.599016 Probability. chi-square (4) 0.1654 Souce: Eviews has been prepared by the author.
Based on the results of the Breuche-Godfrey test, the findings revealed no autocorrelation. Because the Chi-square probability is
greater than 0.10 and the hypothesis that the zero hypothesis does not have the autocorrelation of residues. Following the Breukh-Godfrey auto-cure test, we perform a glaucoma test. Geteroskedastic test is determined by the Breus-Pagan-Breukh-Godfrey test (Table 7).
Table 7 : Breach-Pagan-Godfri geteroskedastic test result
F-statistics 0.664416 Probability F (1.7) 0.5487
Tracking * R-squared 1.631841 Probability. chi-square (1) 0.4422 Explaining the total square sum 0.541821 Probability. chi-square (2) 0.7627
Souce: Eviews has been prepared by the author.
Based on the Breer-Pagan-Godfree heteroskelectric findings, it is established that there is no gynecoskedasticity among the residues.
Because the Chi-square probability is greater than 0.7627, ie greater than 0.10, indicating that zero hepase residues will accept heteroskedastic hypothesis. That is, the remnants of the embedded model have gomoskedastic oscillations. Diagnostic tests suggest that the presence of autocorrelation on residues of the model and the residual oscillation of the residual gomoskedastic means predict the model.
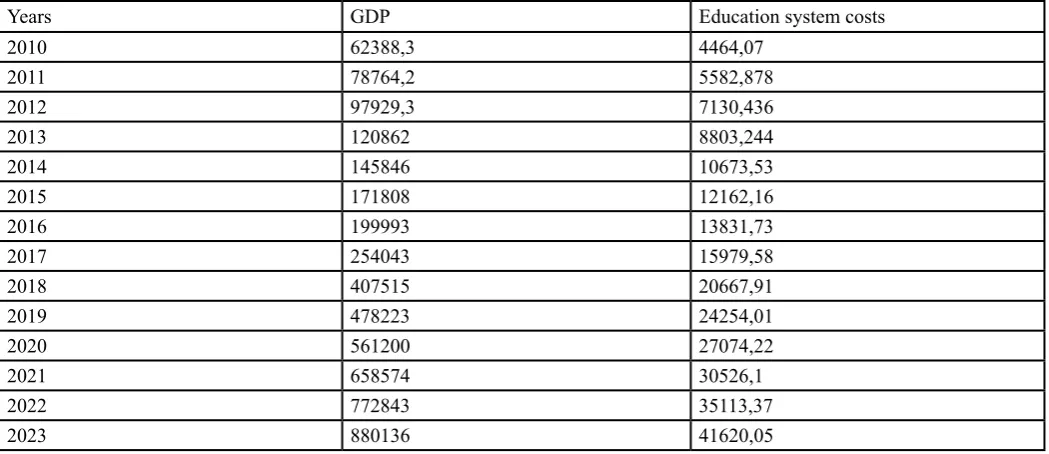
In sum, the growth of public education expenditures by 1 percent leads to a decrease in GDP by 1.58 percent, and the cost of secondary vocational education by one percent - to 0.47 percent of GDP. Using the simple multi-factor regression model above, we forecast the years on GDP (Table 8).
Table 8 : Impact of growth of GDP on growth of GDP forecast for 2019-2023, billion sums [16]
Years GDP Education system costs
2010 62388,3 4464,07
2011 78764,2 5582,878
2012 97929,3 7130,436
2013 120862 8803,244
2014 145846 10673,53
2015 171808 12162,16
2016 199993 13831,73
2017 254043 15979,58
2018 407515 20667,91
2019 478223 24254,01
2020 561200 27074,22
2021 658574 30526,1
2022 772843 35113,37
Conclusions
The survey identified the projected GDP growth and growth of
education expenditures for 2019-2023 by means of econometric methods, based on the impact and interconnectedness of education expenditures from the state budget. The above table analysis shows that the growth of GDP affects the growth of education expenditures. The doubling of education expenditure for 2019-2023 will also double the GDP. In summary, it should be noted that investments from the state budget provide prospective GDP growth.
Refereces:
Денисон Э. Ф. Исследование различий в темпах [1].
экономического роста. – М.: Издательство «Прогресс», 1971. – 646 с.
Марцинкевич В.И., Соболева И.В. Экономика человека: [2].
Учеб.пособие для высш. учеб. заведений. - М.: Аспект Пресс, 1995. - 286 с.
Михайлова Н. А. Роль цены труда в [3].
процессевоспроизводства человеческого капитала / Н. А .Михайлова. — С. — Пб.: Аргус. 2000. С. 131. Нестерова Д. Инвестиции в ЧК в переходныйпериод в [4].
России. / Д. Нестерова, К. Сабирьянова.Российскаяпр ограммаэкономическихисследований. Научныйдоклад. № 99/04. 1998.
Mincer J. The Production of Human Capital and [5].
TheLifccycleof Earnings: Variations on a Theme. / Mincer J. // Working Paperof the NBER, No 4838 (Aug. 1994). Mulligan C. B. Measuring Aggregate Human Capital. / [6].
C. B.Mulligan, X. Sala-i-Martin. // Working Paper of the NBER,No 5016 (Feb. 1995).
Турсунов Б.О.
[7]. МЕТОДЫ ОЦЕНКИ ЭКОНОМИЧЕСКОЙ НАДЕЖНОСТИ ТЕКСТИЛЬНОГО ПРЕДПРИЯТИЯ В УСЛОВИЯХ РЫНОЧНОЙ ЭКОНОМИКИ. В сборнике: Теория и практика организации промышленного производства. Эффективность организации и управления промышленными предприятиями: проблемы и пути решения Материалы Международной научно-практической конференции . Воронежский государственный технический университе т. 2017. С. 139-144.
Турсунов Б.О.
[8]. ПЕРСПЕКТИВЫ РАЗВИТИЯ
ТЕКСТИЛЬНОЙ ПРОМЫШЛЕННОСТИ В УЗБЕКИСТАНЕ. Менеджмент в России и за рубежом. 2017. № 4. С. 78-84.
Турсунов Б.О.
[9]. СТРАТЕГИЯ РАЗВИТИЯ ЛЕГКОЙ ПРОМЫШЛЕННОСТИ РЕСПУБЛИКИ УЗБЕКИСТАН. Вестник Института экономики Российской академии наук. 2017. №5. С. 146-155.
Турсунов Б.О.
[10]. ТЕОРЕТИЧЕСКИЕ АСПЕКТЫ
ПРОИЗВОДСТВЕННОЙ МОЩНОСТИ ТЕКСТИЛЬНЫХ ПРЕДПРИЯТИЙ В СОВРЕМЕННЫХ УСЛОВИЯХ. Научно-аналитический журнал Наука и практика Российского экономического университета им. Г.В. Плеханова. 2017. № 4 (28). С. 57-68.
Tursunov B.O.
[11]. PRINCIPLES AND FUNCTIONS OF MANAGEMENT OF PRODUCTION CAPACITY.Вопросы управления. 2017. № 3 (46). С. 174-178.
Турсунов Б.О.
[12]. УПРАВЛЕНИЕ ПРОИЗВОДСТВЕННЫМИ ЗАПАСАМИ В ТЕКСТИЛЬНЫХ ПРЕДПРИЯТИЯХ. Научнаямысль. 2017. Т. 1. № 3 (25). С. 117-125.
Tursunov B.
[13]. FEATURES OF THE METHOD OF CALCULATION OF PRODUCTION CAPACITIES OF THE TEXTILE ENTERPRISES Бюллетеньнауки и практики. 2017. № 10 (23). С. 213-222.
Tursunov B.
[14]. WAYS OF INCREASING THE EFFICIENCY OF USAGE THE PRODUCTION CAPACITY OF TEXTILE ENTERPRISES Бюллетеньнауки и практики. 2017. №8(21). С. 232-242.
Турсунов Б.О.
[15]. МЕТОДЫ ОЦЕНКИ ЭКОНОМИЧЕСКОЙ НАДЕЖНОСТИ ТЕКСТИЛЬНОГО ПРЕДПРИЯТИЯ В УСЛОВИЯХ РЫНОЧНОЙ ЭКОНОМИКИ. В сборнике: Теория и практика организации промышленного производства. Эффективность организации и управления промышленными предприятиями: проблемы и пути решения Материалы Международной научно-практической конференции . Воронежский государственный технический университет. 2017. С. 139-144.
Ўзбекистон Республикаси Давлат статистика [16].