Volume 3, Issue 5, May 2014
Page 365
ABSTRACT
Nd3+ doped Nanotitania are successfully prepared by wet chemical synthesis method. Samples were analyzed by a variety of techniques, including X-ray diffraction, FTIR, absorption and emission spectrometer to investigate the optical properties of doped samples. Emission spectrum shows that energy levels manifolds 4I9/2 and 4I11/2 of Nd3+ are effected by crystal field of TiO2 and split into energy sublevels which it quietly difference to the known energy sublevels of Nd3+ in YAG or glass. The absorbance and emission spectra to Nd:TiO2 sample are close similar to absorption and emission spectra of Nd:YAG crystal. This give a good indication in direction of preparation of Nd:TiO2 as solid state Laser active medium via Sol-Gel technique.
Keywords: Sol-Gel; TiO2; laser active medium.
1. INTRODUCTION
Nanostructured materials are currently receiving wide attention due to their special optical, electronic, magnetic, chemical, physical and mechanical properties[1]-[5]. Semiconductor nanocrystals have been widely studied for their fundamental properties, especially titanium dioxide (TiO2). Nanosized titanium dioxide materials have been the focus of
great interest because they exhibit modified physical-chemical properties in comparison with its bulk. Inexpensiveness, excellent chemical stability nontoxicity, high photo-catalytic property, a wide band gap and high refractive index of TiO2
make it attractive for practical applications [6],[7]. In particular, doping with lanthanide metal ions, such as neodymium (Nd3+), has been shown to increase the photocatalytic efficiency for selected reactions [8]-[11]. Therefore, it is critical to assess the effects of lanthanide-ion doping on the structure of titania which will allow greater control over the desired properties. The effective ionic radii of Ti4+ and Nd3+ are 0.605 and 0.983 Å, respectively [12]. Therefore, any substitution of an neodymium ion for a titanium ion in the TiO2 lattice would introduce a distortion. Burn et al [11] show that a
distortion occurs only along the c-axis of anatase TiO2 with a maximal distortion at 0.1 mol% Nd 3+
and no further response at higher concentration. This is due to a combination of interstitial and substitutional accommodation of the dopant ions. The interstitial neodymium does not affect the charge balance in the anatase lattice, as a substitutional neodymium does. Thus, interstitial dopants do not affect the photocatalytic properties of the nanoparticles since they cannot act directly as trapping sites to enhance the carrier lifetime.
Figure 1 depicts the energy level diagram of Nd:YAG. Stark splitting of the manifolds are shown on the right-hand side. Each of the 2S+1L J manifolds is split by the crystal field into J + 1/2 sublevels. The actual laser transitions occur between these individual Stark levels. The heavy line in Fig. 1 indicates the main laser transition in Nd:YAG having a
wavelength of 1064 nm. The dashed lines represent transitions leading to 1.3 μm and 946 nm radiations [13].
Figure 2 shows the fluorescence spectrum of Nd3+ in YAG near the region or the laser output with the corresponding energy levels for the various transitions.
Unlike many crystals, the concentration of the active ions can be very high in glass. The practical limit is determined by the fact that the fluorescence lifetime and, therefore the efficiency of stimulated emission, decreases with higher concentrations. In silicate glass, this decrease becomes noticeable at a concentration of 5% Nd2O3. Figure 3 shows a
simplified energy level diagram of Nd:glass. The Nd3+ ion in glass represents a four-level system. The upper laser level indicated in Fig.3 is the lower-lying component of the 4F3/2 pair with a several hundred microsecond spontaneous
emission lifetime. The terminal laser level is the lower-lying level of the pair in the 4I11/2 multiplet. The 4I11/2 group
Volume 3, Issue 5, May 2014
Page 366
Figure (1): Energy level diagram of Nd:YAG. The solid line represents the major transition at 1064 nm, and the dashedlines are the transitions at 1319, 1338, and 946nm [13].
Figure (2): Fluorescence spectrum of Nd3+ in YAG at 300 K in the region of 1.06 μm [13].
2.
EXPERIMENTAL
2.1 Samples PreparationSol-gel process was used for preparing Titanium dioxide nanostructures bulk because it is capable of producing highly homogeneous metal oxide nanoparticles as well as its facility for dopant addition [1]-[5]. The doped and un-doped titania nanoparticles were synthesized from Titanium (IV)- iso–propoxide (TTIP) (Aldrich 98%), Ethanol (EtOH 99.9%) from GCC, hydrochloric acid (HCl, 34.5%) from BDH and neodymium (III) acetylacetonate hydrate (Aldrich). Deionized water was used for the hydrolysis of (TTIP) and preparation of pure and doped TiO2 sol. The final solution was left for 30
Volume 3, Issue 5, May 2014
Page 367
Figure (3): Partial energy level diagram of Nd3+ in glass [13].2.2 Samples characterization
Structural characterizations of the doped and un-doped TiO2 samples were done by X-ray diffraction (XRD). θ–2θ scans
were recorded using ITAL-STRUCTURE diffractometer equipped. While Mid-IR spectra were obtained for the prepared samples using FT-IR spectrometer, Shimadzu, on KBr pellets of the samples.
Absorbance spectra were measured at room temperature with TupCen UV-VIS Spectrometer. Emission spectra were measured at room temperature by using SolarLab mono chromatore. As excitation source we used the 795nm 1W Laser diode. Furthermore Absorbance and emission spectra were measured for Nd:YAG crystal to obtain a standard measurements.
3.
RESULT AND DISCUSSION
X-ray diffraction analyses show that doped and undoped prepared samples have amorphous structure [11]. The FTIR spectra for the sample were illustrated in figure (4). The peaks at 667 cm-1, 505 cm-1 and 447 cm−1 are attributed to Ti–O bond. The peak at 667 cm−1 refers to symmetric O–Ti–O stretch while peak at 447 cm-1 and 505 cm−1 are due to the vibration of Ti–O bond [14]. Another two bands were appeared at about 1600 cm-1 and 3400 cm-1. These two absorption bands are attributed to the characteristics vibration of O-H bond in water molecules [15], and indicating that the drying process at 60ºC does not completely trap the water molecules from the pores of titania network.
UV/Vis Absorbance spectrum, at room temperature, of Nd3+ doped monoliths are presented in figure (5). The spectrum of Nd:YAG is given for comparison. The enhanced absorption properties were mainly determined by the energy level structure of rare earth. The Absorbance spectrum of rare earth ions was due to electronic transitions caused by the energy level. For the Nd:YAG, the absorption bands in the range of 500–850 nm corresponded to the energy level transition of
4
I9/2→2G9/2 (513 nm), 4I9/2→4G7/2 (530nm), 4I9/2→4G5/2 (588nm), 4I9/2→ 4F9/2 (680nm), 4I9/2→(4F7/2, 4S3/2) (735nm,
747nm) and 4I9/2→(4F5/2, 2H9/2) (795, 807nm), respectively[13],[16]. For Nd3+:TiO2 sample, the Absorbance bands in the
range of 500–850 nm corresponded to the energy level transition of 4I9/2→2G9/2 (509nm), 4I9/2→4G7/2 (530nm), 4
I9/2→ 4
G5/2 (580nm), 4
I9/2→ 4
F9/2 (680nm), 4
I9/2→ 4
F7/2 (747nm) and 4
I9/2→ 4
F5/2 (793nm)[16].
By comparison between two absorption spectra, it was noted that some peaks of titania dopant sample are mismatching with the peaks of Nd:YAG. That’s main the titania medium effect on the energy level of Nd3+ and forced the energy level to split into a sublevel difference from known sublevel of Nd in YAG. It’s clearly seen that the absorption peaks band width of Nd:TiO2 are widely while Nd:YAG have a narrow absorption peaks. That’s because of amorphous structure of
TiO2 prepared sample. The important result from the absorption spectra is that the titania dopant sample could be
optically pumped in similar way of Nd:YAG optical pumping.
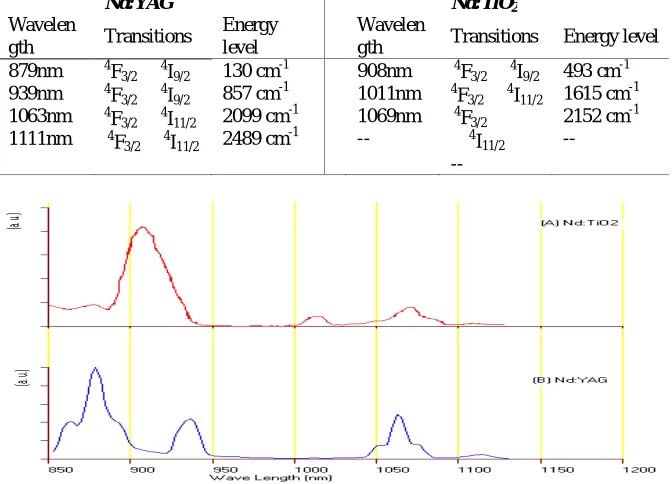
An important performance indicator for the sample to be useful for laser applications is its fluorescence properties. To determine the optical characteristics of the samples, photoluminescence measurements were carried out using the 795nm/1W Laser Diode for excitation. The obtained fluorescence spectra are shown in Figure 6. The fluorescence peaks location for Nd:YAG and Nd:TiO2 are close with that result given by text books[13] and other researches[17],[18]
Volume 3, Issue 5, May 2014
Page 368
Figure (4): FTIR spectra for samples: (A) TiO2 doped with 5%wt Nd. And (B)Pure TiO2Figure (5): absorption spectra for: (A) Nd:TiO2 sample and (B) Nd:YAG Crystal.
According to figure 1 and 3, it can note that Stark components corresponding to manifolds 4I9/2 and 4I11/2 of Nd3+ are
strongly changed when the host medium changed, while energy sublevels R2 have a slightly change and its value around 11500 cm-1. At room temperature and according to Boltzmann’s law, Lasing takes place only by R2 ions whereby the R2 level population is replenished from R1 by thermal transitions. For Nd:YAG the value of energy sublevel of R2 equal to 11507cm-1[13]. Because of Nd:TiO
2 sample have amorphous structure just like Nd:glass, we will assume that R2 for
Nd:TiO2 have same value to Nd:glass. The value of energy levels can now calculated to various transitions which corresponding to fluorescence peaks of Nd3+ in YAG and TiO
2, (figure 6).
Table 1 present wavelength, transitions and energy sublevels which corresponding to fluorescence peaks of Nd3+ in
YAG and TiO2.
Table 1. Fluorescence peaks parameters for Nd:YAG crystal and Nd:TiO2 prepared sample.
Nd:YAG Nd:TiO2
Wavelen
gth Transitions
Energy level
Wavelen
gth Transitions Energy level 879nm
939nm 1063nm 1111nm
4
F3/24I9/2 4
F3/2 4
I9/2 4
F3/24I11/2 4
F3/24I11/2
130 cm-1 857 cm-1 2099 cm-1 2489 cm-1
908nm 1011nm 1069nm --
4
F3/24I9/2 4
F3/2 4
I11/2 4
F3/2
4I11/2
--
493 cm-1 1615 cm-1 2152 cm-1 --
Volume 3, Issue 5, May 2014
Page 369
Figure (7): Energy level diagram of Nd3+ in (A)TiO2 , (B)Glass and (C)YAG4. CONCLUSION
The Nd3+ doped Nanotitania is successfully prepared by wet chemical synthesis method. The doped and undoped prepared Nanotitania samples have amorphous structures. The energy levels manifolds 4I9/2 and 4I11/2 of Nd3+ effected by crystal field of TiO2 and split to energy sublevels which it quietly difference to that known energy sublevels of Nd3+ in YAG or glass The absorption and emission spectra of Nd:TiO2 sample are close similar to absorption and emission spectra of Nd:YAG crystal. This suggests that it could use Sol-Gel technique to prepare of Nd:TiO2 as solid state Laser active medium.
References
[1] Zelinski B. J. J. and Uhlmann D. R..” Gel technology in ceramics”, Phys. Chem. Solids, 45(10), 1069-1090, 1984. [2] Livage J., Henry M. and Sanchez C., “Sol-gel chemistry of transition metal oxides”, Prog. Solid State Chem. 18(4),
259-342, 1988.
[3] Sakka S. and Kamiya K.. ”Glasses from metal alcoholates”, J. Non-Cryst. Solids, 42, 403-422, 1980.
[4] Yoldas E., ”Preparation of glasses and ceramics from metal-organic compounds”. J. Mater. Sci., 12, 1203-1208, 1977.
[5] M. A. Hamza, F. N. Saiof and A. S. Al-ithawi, “Prepared of Nd:TiO2 via Sol-Gel technique”, IJAIEM Vol.2, 7, pp 432 -436,2013.
Volume 3, Issue 5, May 2014
Page 370
[7] M. Hamza, A. Khalil and H. Yaseen, "Synthesis of Yb3+ Doped TiO2 Nano Particles Powder as IR Filter viaSol-Gel," Advances in Materials Physics and Chemistry, Vol. 3 No. 4, pp. 214-216, 2013.
[8] M. Hamza, F. Saiof, A. Al-ithawi, M. Ameen and H. Yaseen, "Prepared of Nd: TiO2 Nano Particles Powder as IR Filter via Sol-Gel," Advances in Materials Physics and Chemistry, Vol. 3 No. 2, pp. 174-177, 2013.
[9] S. I. Shah, W. Li, C.-P. Huang, O. Jung and C. Ni, “Study of Nd3+, Pd2+, Pt4+, and Fe3+ dopant effect on photoreactivity of TiO2 nanoparticles”, PNAS 99 (2) , 6482-6486, (2002).
[10]Chen X, Luo W., “Optical spectroscopy of rare earth ion-doped TiO2 nanophosphors.” J anosci Nanotechnol. 2010 Mar;10(3),1482-1494,(2010).
[11]A. Burns, G. Hayes, W. Li, J. Hirvonen, J. D. Demaree and S. I. Shah, “Neodymium ion dopant effects on the phase transformation in Sol-Gel derived titania nanostructures”, Materials Science and Engineering B111, 150-155,(2004).
[12]R.D. Shannon, “Crystal Physics, Diffraction, Theoretical and General Crystallography”, Acta Crystallogr. Sect. A. 32, 751, (1976).
[13]W. Koechner, "Solid State Laser Engineering", Springer Series in Optical Sciences, Vol.1, 5th ed., New York, (1999).
[14]A. Merouani and H. Amardjia-Adnani "Spectroscopic FT-IR study of TiO2 films prepared by sol-gel method" International Scientific Journal for Alternative Energy and Ecology, 6 (62) 151-154, 2008.
[15]Young-Geun Kwon, Se-Young Choi, Eul-Son Kang and Seung-Su Baek "Ambient-dried silica aerogel doped with TiO2 powder for thermal insulation", JOURNAL OF MATERIALS SCIENCE, 35, 6075 – 6079, 2000.
[16]CHEN Jiao et al., ”Preparation and properties of Nd:YAG ultra-fine powders”, JOURNAL OF RARE EARTHS, Vol. 29, No. 1, p. 44, 2011.
[17]Rajesh P., Victor M., Davor R., “Structural and near-infra red luminescence properties of Nd-doped TiO2 films deposited by RF sputtering”, J. Mater. Chem.,22, 22424-22432, 2012.
[18]Danuta K., “Optical emission from Eu, Tb, Nd luminescence centers in TiO2 prepared by magnetron sputtering“, Optica Applicata, Vol. XXXVII, No. 4, 2007.
![Figure (1): Energy level diagram of Nd:YAG. The solid line represents the major transition at 1064 nm, and the dashed lines are the transitions at 1319, 1338, and 946nm [13]](https://thumb-us.123doks.com/thumbv2/123dok_us/9768741.1962042/2.612.129.512.365.573/figure-energy-diagram-solid-represents-transition-dashed-transitions.webp)
![Figure (3): Partial energy level diagram of Nd3+ in glass [13].](https://thumb-us.123doks.com/thumbv2/123dok_us/9768741.1962042/3.612.235.387.93.303/figure-partial-energy-level-diagram-nd-glass.webp)