R
R
O
O
B
B
U
U
S
S
T
T
N
N
E
E
S
S
S
S
O
O
F
F
M
M
O
O
D
D
I
I
F
F
I
I
E
E
D
D
F
F
A
A
C
C
T
T
O
O
R
R
-
-
T
T
Y
Y
P
P
E
E
E
E
S
S
T
T
I
I
M
M
A
A
T
T
O
O
R
R
S
S
U
U
N
N
D
D
E
E
R
R
N
N
O
O
N
N
-
-
R
R
E
E
S
S
P
P
O
O
N
N
S
S
E
E
M
M
O
O
D
D
E
E
L
L
A
A
.
.
A
A
u
u
d
d
u
u
11,
,
A
A
.
.
A
A
.
.
A
A
d
d
e
e
w
w
a
a
r
r
a
a
22 1Department of Mathematics, Usmanu Danfodiyo University, P.M.B. 2346, Sokoto, Nigeria
2
Department of Statistics, University of Ilorin, P.M.B 1515, Ilorin, Kwara State, Nigeria
Corresponding Author: A. Audu, [email protected]
ABSTRACT: In this paper, robustness of suggested modified factor-type estimators have been study under non-response model in relation to other existing related estimators of population mean. Mean square error (MSE) of suggested estimators under non-response model has been obtained and empirical study was done using Data 1, 2, 3 and 4. The robustness of the considered estimators were obtained by averaging their expected MSE and ranked accordingly to their level of efficiency. The results revealed that the efficiency of all the estimators considered increases as the proportion of non-respondent who responded after been re-interviewed increases and the suggested estimators compete favorably with almost the estimators considered in the study.
KEYWORDS: Estimator, Robustness, Mean square error (MSE), Efficiency.
1.0 INTRODUCTION
It is well known especially in human surveys that information is generally not obtained from all the sample units even after callbacks. This is called non-response.
Hansen and Hurwitz ([HH46]) gave a procedure to deal with non-response: Select a sample of size n from the population (denote this sample by
s
). Letn
1 units respond (samples
1) andn
2 not respond (sampleS
2), for1 2
n
n
n
. Let out ofn
2 ,h
2 were re-interviewed and they responded (sample 2h
s
). The suggested unbiased estimator is given as;1 2
1 s 2 sh
w
n y
n y
y
n
(1.1)where
1 2
1 2
1 2
1
1
,
h
h
s i s i
i s i s
y
y
y
y
n
h
The problem of estimating the parameters such as ratio of two means, population mean and variance when some observations are missing due to random non response has been discussed by Toutenberg and Srivastava ([TS98]), Singh and Joarder ([SJ98]), Singh S. et al. ([SS00]) and Singh and Tracy ([ST01]). The problem of estimation of population mean using information on single auxiliary character has been considered by different authors such as Tabasum and Khan ([TH04, TK06]), Khare and Sinha ([KS07]), Singh and Kumar ([SK11]), Kumar et al. ([K+11]). Also, authors like Singh and Kumar ([SK09]) and Ismail et al. ([IHS15]) have suggested some improved estimators for population mean in the presence of non-response using more information of auxiliary variable like coefficients of variation, skewness, kurtosis etc and from their empirical results, more information of auxiliary variable play significance role in stabilizing the performances of estimators in the presence of non-response.
Definition: Let
A
d
1
d
2
,B
d
1
d
4
,C
d
2
d
3
d
4
,1
,
2,
3,
4A C
fB
A
fB
C
A
fB C
A
fB C
A
fB C
A
fB C
,P
3
1
2
4d
is an unknown positive real number to be estimated i.e d
FT
A C X fBx
y y
A fB X Cx
(1.2)
1 1
1 1
,
n n
i i
i i
x x y y
n n
(1.3)
where , , , ,
Remark: Since and , it implies that .
Shukla ([Shu02]) suggested a factor-type estimator for population mean under two-phase sampling as
1 22
1 2
FTd
A C x fBx
y y
A fB x Cx
(1.4)
2 1 1 2
1 1 1
2 1 2
1
1
1
,
n n n
i i i
i i i
x
x
x
x
y
y
n
n
n
The MSE of
y
FTd under case I and II are respectively
2 2 2 22 3 2 3
FTd I y x xy x y
MSE y Y
C
P C
P C C (1.5)
2 2 2 22 4 2 2
FTd II y x xy x y
MSE y Y
C
P C
P C C (1.6)where 1 2 3 4 1 2
1 2 2 1
1
1
1
1
1
1
,
,
,
n
N
n
N
n
n
, ,, , ,
,
It is observed that the factor-type estimator
y
FTd was more efficient than classical ratio estimatoryrd, if 2Cyx P 0 in case I and if 2Cyx
1
1 P 0
in case II where
1 21.Thakur and Gupta ([TG13]) suggested a linear combination based factor-type estimator for estimating population mean in sample surveys. The suggested estimator, its bias and MSE are given below;
1
FTRP
A C X fBx A C x fBX
y fy f y
A fB X Cx A fB x CX
(1.7)
(1.8)
Jain and Shukla ([JS13]) suggested factor-type estimators and in multiprocessor environment for estimation of ready queue processing time. The suggested estimators, their biases and MSEs are given below;
1
9
2
6 2
3
FT
X
fx
y
y
f X
x
(1.9)(1.10)
2
22
5
10 5
12
FT
X
fx
y
y
f X
x
(1.11)Shukla et. al. ([SJV13]) suggested a transformed factor-type estimator for population mean in multiprocessor environment for estimation of ready queue processing time. The suggested estimator is given below as;
1
1
TFT
A C d X fB dX x
y y
A fB d X C dX x
(1.13)
The MSE of the suggested estimator are respectively given as follows;
(1.14) 2.0 METHODOLOGY
Having studied the above estimators, we suggested the following four factor-type estimators. The suggested estimator denoted by , ( )d , 1( )d , 2( )d
FTAA FTAA FTAA FTAA
y y y y and their properties are given as;
x
xFTAA
x x
A C X fBx a A C fB b
y y
A fB X Cx a A C fB b
(2.1)
21 2 2 2 22
FTAA y x x x xy x y
f
MSE y Y C P C P C C
n
(2.2)
2 2 2min
1
1
FTAA y xy
f
MSE y Y C
n
(2.3)
1 2
2 1 2 x x d FTAA x x
A C x fBx a A C fB b
y y
A fB x Cx a A C fB b
(2.4)
2 2 2 2 22 3 2 3
d
FTAA y x x x xy x y I
MSE y Y
C
P C
P C C (2.5)
2 2 2 2 22 4 2 2
d
FTAA y x x x xy x y II
MSE y Y
C
P C
P C C (2.6)
2 2 22 3
min
d
FTAA y xy I
MSE y Y C
(2.7)
22 2 2 2
2 min
4
d
FTAA y xy II
MSE y Y C
(2.8)
1
1 1 2
2
1 2 1
d z z
FTAA
z z
A C x
fBx
a Z
b
y
y
A
fB x
Cx
a z
b
(2.9)
1
2 2 2
2
2 3 2 1 1 1 2
d
FTAA y x yx z z z yz I
MSE y Y
C
C P P C
C
C (2.10)
1
2 2 2
2
2 2 2 3 3 1 1 2
d
FTAA y x yx z z z xz
II
MSE y Y
C C P
P C
P
C
PC (2.11)
1
2 2 2 2min 2 3 1
d
FTAA y xy yz I
MSE y Y C
(2.12)
1
2 2 2
2
min 2 1 / 1 1/ 2 1/ 2
d
FTAA y xy xz
II
MSE y Y
C
(2.13)
2
2 2 2
2
2 3 2 3 2 1 2 2
d
FTAA y x yx z z z yz xz I
MSE y Y
C
C P P C
C
C PC (2.14)
2 2 2 2 2
2 2 3 2 2
2 2 2
2 2 2 3
2
2
2
2
d
FTAA y x yx z z z xz II
z z z yz xz x
MSE y
Y
C
C P P
C
C
PC
C
C
PC
P C
(2.15)
2
2 2
2 2
2
min 2 3 2 / 1
d
FTAA y xy yz xy xz yz xz I
2 2 2
min 2 2 2 2 2 4 4 2
4 2
4 2 2 2 2 2 4
4
2 4
1 2 2
1
2 1 2
1
2
yz xz xy y d
FTAA y yz xz y xy y
II
xz
yz yx xz
xz xy y yz y z
xz
xz y z yz xz xy
C
MSE y Y C C C
C C C
C C C
C C
(2.17)3.0 MSE OF THE SUGGESTED ESTIMATORS UNDER NON-RESPONSE MODEL
If
y
is replaced by y in the proposed estimators then the proposed can be written under non-response model as;
1 1 2 2 x x
S s s sh FTAA
x x
A C X
fBx a
A C
fB b
n y
n y
y
n
A
fB X
Cx a
A C
fB b
(3.1)
1 2
1 1 2 2
2 1 2
x x
d S s s sh FTAA
x x
A C x
fBx a
A C
fB b
n y
n y
y
n
A
fB x
Cx a
A C
fB b
(3.2)
1
1( ) 1 1 2 2 1 2
2 1 2 1
d S s s sh z z
FTAA
z z
A C x
fBx
n y
n y
a Z
b
y
n
A
fB x
Cx
a z
b
(3.3)
2
2( ) 1 1 2 2 1 2 1
2 1 2 2
d S s s sh z z
FTAA
z z
A C x fBx
n y n y a z b
y
n A fB x Cx a z b
(3.4)
In order to get the MSEs of , ( )d , 1( )d
FTAA FTAA FTAA
y y y and 2( )d
FTAA
y , we defined an error term y
y Y
/Y
such
that y 1 and E
y 0,E
y21
21
1
S
2yW k
2
1
S
y s2( 2)Y
n
N
n
, E
x y
E y z
0
,
then
2
2( 2) 2
1
FTAA FTAA y s
W k
MSE y MSE y S
nY
(3.5)
( )
( )
2
2( 2) 2
2
1
d d
FTAA FTAA y s
W k
MSE y
MSE y
S
n Y
(3.6)
1( )
1( )
2
2( 2) 2
2
1
d d
FTAA FTAA y s
W k
MSE y
MSE y
S
n Y
(3.7)
2( )
2( )
2
2( 2) 2
2
1
d d
FTAA FTAA y s
W k
MSE y
MSE y
S
n Y
(3.8)
where 2
2
s
N W
N
and 2
2 s h n k n .
4.0 EMPIRICAL STUDY
4.1. Data 1: Khare and Rehman ([KR15])
Y: Number of Agricultural labor, X: Area of the Village (hectares), Z: Number of cultivators in the village.
(2) 2
2 1
137.9271, 144.8720, 185.188, 182.5012, 0.8115
287.4204, 0.773, 0.786, 0.819, 0.25
96, 24, 60
y x
y xy yz xz
Y X Z S C
S W
N n n
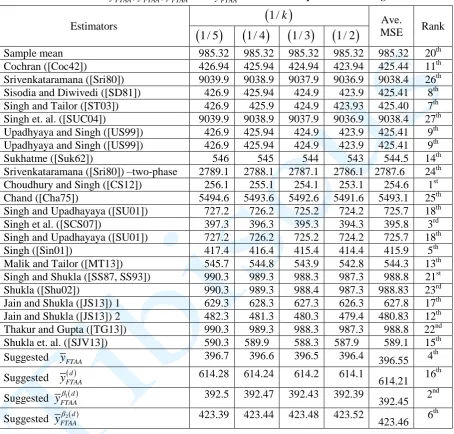
Table 1: MSE of
,
( )d,
1( )dFTAA FTAA FTAA
y
y
y
and 2( )dFTAA
y under Non-Response Model using Data 1
Estimators
1/
k
Ave.MSE Rank
1/ 5
1/ 4
1/ 3
1/ 2
Sample mean 985.32 985.32 985.32 985.32 985.32 20th
Cochran ([Coc42]) 426.94 425.94 424.94 423.94 425.44 11th Srivenkataramana ([Sri80]) 9039.9 9038.9 9037.9 9036.9 9038.4 26th Sisodia and Diwivedi ([SD81]) 426.9 425.94 424.9 423.9 425.41 8th Singh and Tailor ([ST03]) 426.9 425.9 424.9 423.93 425.40 7th Singh et. al. ([SUC04]) 9039.9 9038.9 9037.9 9036.9 9038.4 27th Upadhyaya and Singh ([US99]) 426.9 425.94 424.9 423.9 425.41 9th Upadhyaya and Singh ([US99]) 426.9 425.94 424.9 423.9 425.41 9th
Sukhatme ([Suk62]) 546 545 544 543 544.5 14th
Srivenkataramana ([Sri80]) –two-phase 2789.1 2788.1 2787.1 2786.1 2787.6 24th Choudhury and Singh ([CS12]) 256.1 255.1 254.1 253.1 254.6 1st
Chand ([Cha75]) 5494.6 5493.6 5492.6 5491.6 5493.1 25th
Singh and Upadhayaya ([SU01]) 727.2 726.2 725.2 724.2 725.7 18th Singh et al. ([SCS07]) 397.3 396.3 395.3 394.3 395.8 3rd Singh and Upadhayaya ([SU01]) 727.2 726.2 725.2 724.2 725.7 18th
Singh ([Sin01]) 417.4 416.4 415.4 414.4 415.9 5th
Malik and Tailor ([MT13]) 545.7 544.8 543.9 542.8 544.3 13th Singh and Shukla ([SS87, SS93]) 990.3 989.3 988.3 987.3 988.8 21st
Shukla ([Shu02]) 990.3 989.3 988.4 987.3 988.83 23rd
Jain and Shukla ([JS13]) 1 629.3 628.3 627.3 626.3 627.8 17th Jain and Shukla ([JS13]) 2 482.3 481.3 480.3 479.4 480.83 12th Thakur and Gupta ([TG13]) 990.3 989.3 988.3 987.3 988.8 22nd Shukla et. al. ([SJV13]) 590.3 589.9 588.3 587.9 589.1 15th
Suggested yFTAA 396.7 396.6 396.5 396.4 396.55 4th
Suggested
y
FTAA d 614.28 614.24 614.2 614.1 614.21 16thSuggested 1 d
FTAA
y
392.5 392.47 392.43 392.39 392.45 2ndSuggested 2 d
FTAA
y
423.39 423.44 423.48 423.52 423.46 6thTable 1 shows the biases and MSEs of the suggested estimators and those of some existing related estimators under Non-response model. Estimation of biases and MSE under the model was done using Data C1. The robustness of the considered estimators were obtained by averaging their expected MSEs and ranked accordingly to their level of efficiency. The results revealed that out of the twenty-seven competing estimators,
1( )d
,
,
2( )dFTAA FTAA FTAA
y
y
y
andy
FTAA( )d are ranked second, fourth, sixth and sixteenth respectively.4.2. Data 2: Singh and Kumar ([SK11])
Y: Weight (kg) of the children, X: Skull circumference (cm) of the children, Z: Chest circumference (cm) of the children
(2) 2
19.4968, 51.1726, 55.1726, 0.15613, 0.03006
287.4204, 0.328, 0.846, 0.297, 0.25
y x
y xy yz xz
Y X Z C C
C
W
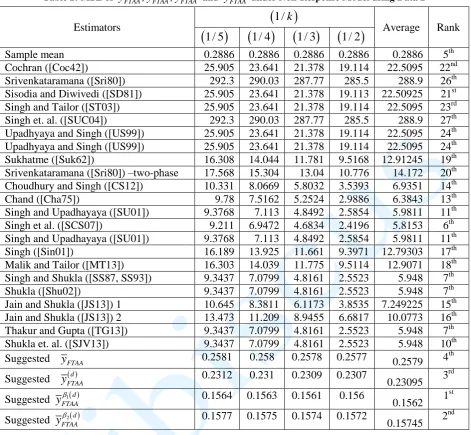
Table 2: MSE of
,
( )d,
1( )dFTAA FTAA FTAA
y
y
y
and 2( )dFTAA
y under Non-Response Model using Data 2
Estimators
1/
k
Average Rank
1/ 5
1/ 4
1/ 3
1/ 2
Sample mean 0.2886 0.2886 0.2886 0.2886 0.2886 5th
Cochran ([Coc42]) 25.905 23.641 21.378 19.114 22.5095 22nd
Srivenkataramana ([Sri80]) 292.3 290.03 287.77 285.5 288.9 26th Sisodia and Diwivedi ([SD81]) 25.905 23.641 21.378 19.113 22.50925 21st Singh and Tailor ([ST03]) 25.905 23.641 21.378 19.114 22.5095 23rd Singh et. al. ([SUC04]) 292.3 290.03 287.77 285.5 288.9 27th Upadhyaya and Singh ([US99]) 25.905 23.641 21.378 19.114 22.5095 24th Upadhyaya and Singh ([US99]) 25.905 23.641 21.378 19.114 22.5095 24th Sukhatme ([Suk62]) 16.308 14.044 11.781 9.5168 12.91245 19th Srivenkataramana ([Sri80]) –two-phase 17.568 15.304 13.04 10.776 14.172 20th Choudhury and Singh ([CS12]) 10.331 8.0669 5.8032 3.5393 6.9351 14th
Chand ([Cha75]) 9.78 7.5162 5.2524 2.9886 6.3843 13th
Singh and Upadhayaya ([SU01]) 9.3768 7.113 4.8492 2.5854 5.9811 11th Singh et al. ([SCS07]) 9.211 6.9472 4.6834 2.4196 5.8153 6th Singh and Upadhayaya ([SU01]) 9.3768 7.113 4.8492 2.5854 5.9811 11th
Singh ([Sin01]) 16.189 13.925 11.661 9.3971 12.79303 17th
Malik and Tailor ([MT13]) 16.303 14.039 11.775 9.5114 12.9071 18th Singh and Shukla ([SS87, SS93]) 9.3437 7.0799 4.8161 2.5523 5.948 7th
Shukla ([Shu02]) 9.3437 7.0799 4.8161 2.5523 5.948 7th
Jain and Shukla ([JS13]) 1 10.645 8.3811 6.1173 3.8535 7.249225 15th Jain and Shukla ([JS13]) 2 13.473 11.209 8.9455 6.6817 10.0773 16th Thakur and Gupta ([TG13]) 9.3437 7.0799 4.8161 2.5523 5.948 7th Shukla et. al. ([SJV13]) 9.3437 7.0799 4.8161 2.5523 5.948 10th
Suggested yFTAA 0.2581 0.258 0.2578 0.2577 0.2579 4th
Suggested
y
FTAA d 0.2312 0.231 0.2309 0.2307 0.23095 3rdSuggested 1 d
FTAA
y
0.1564 0.1563 0.1561 0.156 0.1562 1stSuggested 2 d
FTAA
y
0.1577 0.1575 0.1574 0.1572 0.15745 2ndTable 2 shows the biases and MSEs of the suggested estimators and those of some existing related estimators under Non-response model. Computations of biases and MSEs under the model were done using Data 2. The robustness of the considered estimators were obtained by averaging their expected MSEs and ranked accordingly to their level of efficiency. The results revealed that out of the twenty-seven competing estimators,
1( )d
,
2( )d,
( )dFTAA FTAA FTAA
y
y
y
andy
FTAA are ranked first, second, third and fourth respectively.4.3.Dataset 3: Sanaullah et al. ([S+15])
Y: Food expenditure, X: Household earning, Z: Total expenditure in month of May
(2) 2
2 1
47.9805, 18746.55, 19124.75, 21.4256, 16625.33
20.4752, 0.4777, 0.4422, 0.9138, 0.10
6940, 750, 1874
y x
y xy yz xz
Y X Z S S
S W
N n n
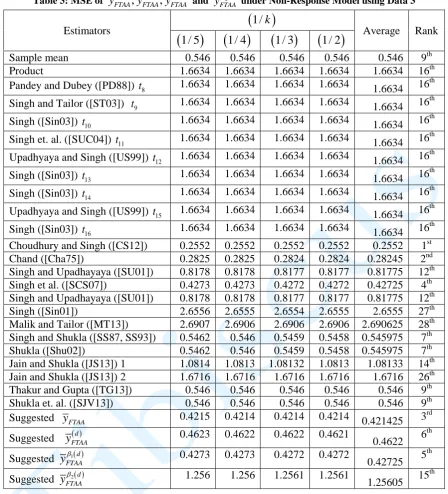
Table 3: MSE of
,
( )d,
1( )dFTAA FTAA FTAA
y
y
y
and 2( )dFTAA
y under Non-Response Model using Data 3
Estimators
1/
k
Average Rank
1/ 5
1/ 4
1/ 3
1/ 2
Sample mean 0.546 0.546 0.546 0.546 0.546 9th
Product 1.6634 1.6634 1.6634 1.6634 1.6634 16th
Pandey and Dubey ([PD88]) t8 1.6634 1.6634 1.6634 1.6634 1.6634 16th Singh and Tailor ([ST03]) t9 1.6634 1.6634 1.6634 1.6634 1.6634 16th Singh ([Sin03]) t10 1.6634 1.6634 1.6634 1.6634 1.6634 16th Singh et. al. ([SUC04]) t11 1.6634 1.6634 1.6634 1.6634 1.6634 16th Upadhyaya and Singh ([US99]) t12 1.6634 1.6634 1.6634 1.6634 1.6634 16th Singh ([Sin03]) t13 1.6634 1.6634 1.6634 1.6634 1.6634 16th Singh ([Sin03]) t14 1.6634 1.6634 1.6634 1.6634 1.6634 16th Upadhyaya and Singh ([US99]) t15 1.6634 1.6634 1.6634 1.6634 1.6634 16th Singh ([Sin03]) t16 1.6634 1.6634 1.6634 1.6634 1.6634 16th Choudhury and Singh ([CS12]) 0.2552 0.2552 0.2552 0.2552 0.2552 1st Chand ([Cha75]) 0.2825 0.2825 0.2824 0.2824 0.28245 2nd Singh and Upadhayaya ([SU01]) 0.8178 0.8178 0.8177 0.8177 0.81775 12th Singh et al. ([SCS07]) 0.4273 0.4273 0.4272 0.4272 0.42725 4th Singh and Upadhayaya ([SU01]) 0.8178 0.8178 0.8177 0.8177 0.81775 12th
Singh ([Sin01]) 2.6556 2.6555 2.6554 2.6555 2.6555 27th
Malik and Tailor ([MT13]) 2.6907 2.6906 2.6906 2.6906 2.690625 28th Singh and Shukla ([SS87, SS93]) 0.5462 0.546 0.5459 0.5458 0.545975 7th Shukla ([Shu02]) 0.5462 0.546 0.5459 0.5458 0.545975 7th Jain and Shukla ([JS13]) 1 1.0814 1.0813 1.08132 1.0813 1.08133 14th Jain and Shukla ([JS13]) 2 1.6716 1.6716 1.6716 1.6716 1.6716 26th Thakur and Gupta ([TG13]) 0.546 0.546 0.546 0.546 0.546 9th Shukla et. al. ([SJV13]) 0.546 0.546 0.546 0.546 0.546 9th Suggested yFTAA 0.4215 0.4214 0.4214 0.4214 0.421425 3rd Suggested
y
FTAA d 0.4623 0.4622 0.4622 0.4621 0.4622 6thSuggested 1 d
FTAA
y
0.4273 0.4273 0.4272 0.4272 0.42725 5thSuggested 2 d
FTAA
y
1.256 1.256 1.2561 1.2561 1.25605 15thTable 3 shows the biases and MSEs of the suggested estimators and those of some existing related estimators under Non-response model. Computations of MSE under the model were done using Data 3. The robustness of the considered estimators were obtained by averaging their expected MSEs and ranked accordingly to their level of efficiency. The results revealed that out of the twenty-seven competing estimators,
,
1( )d,
( )dFTAA FTAA FTAA
y
y
y
and2( )d
FTAA
y
are ranked third, fifth, sixth and fifteenth respectively.4.4. Dataset 4: Sanaullah et al. ([S+15])
Y: Food expenditure, X: House earn , Z: Total expenditure in month of May
(2) 2
2 1
48.0556, 14303.98, 14742.47, 22.1319, 12861.4
21.7407, 0.4406, 0.3547, 0.8035, 0.10
1678, 181, 453
y x
y xy yz xz
Y X Z S S
S W
N n n
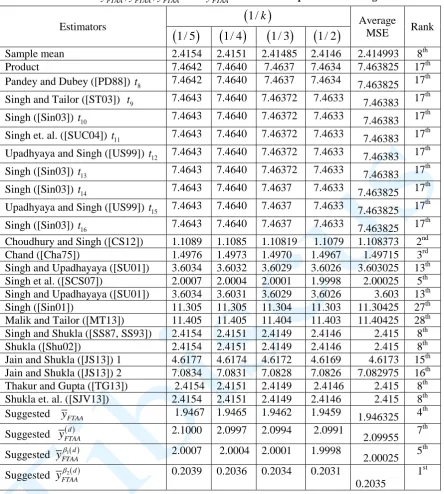
Table 4: MSE of
,
( )d,
1( )dFTAA FTAA FTAA
y
y
y
and 2( )dFTAA
y under Non-Response Model using Data C4
Estimators
1/
k
AverageMSE Rank
1/ 5
1/ 4
1/ 3
1/ 2
Sample mean 2.4154 2.4151 2.41485 2.4146 2.414993 8th
Product 7.4642 7.4640 7.4637 7.4634 7.463825 17th
Pandey and Dubey ([PD88]) t8 7.4642 7.4640 7.4637 7.4634 7.463825 17th Singh and Tailor ([ST03]) t9 7.4643 7.4640 7.46372 7.4633 7.46383 17th Singh ([Sin03]) t10 7.4643 7.4640 7.46372 7.4633 7.46383 17th Singh et. al. ([SUC04]) t11 7.4643 7.4640 7.46372 7.4633 7.46383 17th Upadhyaya and Singh ([US99]) t12 7.4643 7.4640 7.46372 7.4633 7.46383 17th Singh ([Sin03]) t13 7.4643 7.4640 7.46372 7.4633 7.46383 17th Singh ([Sin03]) t14 7.4643 7.4640 7.4637 7.4633 7.463825 17th Upadhyaya and Singh ([US99]) t15 7.4643 7.4640 7.4637 7.4633 7.463825 17th Singh ([Sin03]) t16 7.4643 7.4640 7.4637 7.4633 7.463825 17th Choudhury and Singh ([CS12]) 1.1089 1.1085 1.10819 1.1079 1.108373 2nd Chand ([Cha75]) 1.4976 1.4973 1.4970 1.4967 1.49715 3rd Singh and Upadhayaya ([SU01]) 3.6034 3.6032 3.6029 3.6026 3.603025 13th Singh et al. ([SCS07]) 2.0007 2.0004 2.0001 1.9998 2.00025 5th Singh and Upadhayaya ([SU01]) 3.6034 3.6031 3.6029 3.6026 3.603 13th Singh ([Sin01]) 11.305 11.305 11.304 11.303 11.30425 27th Malik and Tailor ([MT13]) 11.405 11.405 11.404 11.403 11.40425 28th Singh and Shukla ([SS87, SS93]) 2.4154 2.4151 2.4149 2.4146 2.415 8th
Shukla ([Shu02]) 2.4154 2.4151 2.4149 2.4146 2.415 8th
Jain and Shukla ([JS13]) 1 4.6177 4.6174 4.6172 4.6169 4.6173 15th Jain and Shukla ([JS13]) 2 7.0834 7.0831 7.0828 7.0826 7.082975 16th Thakur and Gupta ([TG13]) 2.4154 2.4151 2.4149 2.4146 2.415 8th Shukla et. al. ([SJV13]) 2.4154 2.4151 2.4149 2.4146 2.415 8th Suggested yFTAA 1.9467 1.9465 1.9462 1.9459 1.946325 4th Suggested
y
FTAA d 2.1000 2.0997 2.0994 2.0991 2.09955 7thSuggested 1 d
FTAA
y
2.0007 2.0004 2.0001 1.9998 2.00025 5thSuggested 2 d
FTAA
y
0.2039 0.2036 0.2034 0.20310.2035
1st
Table 4 shows the MSEs, average of MSEs and ranks of suggested estimators and those of some existing related estimators under Non-response model. The results revealed that out of the twenty-seven competing estimators,
2( )d
,
,
1( )dFTAA FTAA FTAA
y
y
y
andy
FTAA( )d are ranked first, second, fourth, fifth and seventh respectively.4.0 RESULTS AND CONCLUSIONS
Robustness of the considered estimators and some existing related estimators under non-response model were investigated using four real life data. The results revealed that the suggested estimators display high level of robustness under non-response model as they compete favourably with almost existing related estimators considered.
REFERENCES
[Coc42] W. G. Cochran - Sampling Theory when the Sampling Units are of Unequal Sizes. Journ. American Statistical Association. 37: 199-212, 1942.
[CS12] S. Choudhury, B. K. Singh – A class of chain ratio-product type estimators with two auxiliary variables under double sampling scheme. Jour. Of the Korean Stat. Soc. 41, 247-256, 2012.
[HH46] M. H. Hansen, W. N. Hurwitz - The problem of non-response in sample surveys. Jour. Amer. Statist. Assoc., 41, 517- 529, 1946.
[IHS15] M. Ismail, M. Hanif, M. Q. Shahbaz - Generalized Estimators for Population Mean in the Presence of Non-Response for Two-Phase Sampling. Pak. J. Statist., 31 (3), 295-306, 2015.
[JS13] A. Jain, D. Shukla - Estimation of Ready Queue Processing Time using Factor-Type (F-T) Estimator in Multiprocessor Environment. International Journal of Advanced Computer technology, 2 (8): 256-260, 2013.
[KS07] B. B. Khare, R. R. Sinha - Estimation of the Ratio of the two Population Means using Multi-auxiliary characters in the presence of Non-response. Statistical Techniques in Life Testing, Reliability, Sampling Theory and Quality Control, 163- 171, 2007.
[KR15] B. B. Khare, H. U. Rehman - Improved Ratio in Regression type Estimator for Population Mean using Coefficient of Variation of the Study Character in the Presence of Non-Response. International Journal of Technology Innovations and Research, 14, 1-7, 2015.
[K+11] S. Kumar, H. P. Singh, S. Bhougal, R. Gupta - Under double sampling a general ratio type estimator in presence of non-response. Journal of Mathematics and Statistics, 40(4), 589-599, 2011.
[MT13] K. A. Malik, R. Tailor - Ratio Type Estimator of Population Mean in Double Sampling. International Journal of Advanced Mathematics and Statistics. 1 (1): 34-39, 2013.
[PD88] B. N. Pandey, V. Dubey - Modified product estimator using coefficient of variation of auxiliary variate. Assam Statistical
Rev., 2(2), 64-66, 1988.
[Shu02] D. Shukla - F-T estimator under two phase sampling, Metron, 59 (1-2): 253-263, 2002.
[Sin01] G. N. Singh - On the use of transformed auxiliary variable in the estimation of population mean in two phase sampling. Statistics in Transition. 5(3), 405-416, 2001.
[Sin03] G. N. Singh - On the improvement of product method of estimation in sample surveys. Jour. Ind. Soc. Agric. Statistics. 56(3): 267-275, 2003.
[Sri80] T. Srivenkatarama - A dual to ratio estimator in sample survey. Biometrica, 67(1), 199-204, 1980.
[Suk62] B. Y. Sukhatme - Some ratio type estimators in two-phase sampling. J. Amer. Statist. Assoc., 57: 628-632, 1962.
[SD81] B. V. S. Sisodaiya, V. K. Dwivedi - A modified ratio estimator using coefficient of variation of auxillary variable. Jour. Ind. Soc. Agr. Statistics. 33: 13-18, 1981.
[SJ98] S. Singh, A. Joarder - Estimation of finite population variance using random Non-response in survey sampling. Metrika, 241-249, 1998.
[SK11] H. P. Singh, S. Kumar - Combination of ratio and regression estimators in presence of non-response. Brazilian journal of Probability and Statistics, 25(2), 205-217, 2011.
[SS87] V. K. Singh, D. Shukla - One parameter family of factor type ratio estimators. Metron International Journal of Statistics, 45 (12): 273-283, 1987.
[SS93] V. K. Singh, D. Shukla - An efficient one-parameter family of factor-type estimator in sample surveys. Metron International Journal of Statistics, 55: 139-159, 1993.
[ST01] H. P. Singh, D. S. Tracy - Estimation of population mean in presence of random non-response in sample surveys. Statistica, LXI, 2, 231-248, 2001.
[ST03] H. P. Singh, R. Tailor - Use of known correlation coefficient in estimating the finite Population mean. Statistics in Transition. 64: 555-560, 2003.
[SU01] G. N. Singh, L. N. Upadhyaya - An Empirical Study of Modified Ratio Estimators in Two Phase Sampling in Presence of Coefficient of Variation of the Auxiliary Variable, Statistics in Transition, 5(2): 319-326, 2001.
[SCS07] R. Singh, P. Chauhan, N. Sawan - A Family of Estimators for Estimating Population Mean Using Known Correlation Coefficient in Two Phase Sampling. Statistics in Transition, 8(1), 89-96, 2007. [SJV13] S. Shukla, A. Jain, K. Verma - Estimation of Ready Queue Processing Time using Transformed
Factor-Type (T-F-T) Estimator in Multiprocessor Environment. International Journal of Computer Applications, 79 (16): 40-48, 2013.
[SSM00] S. Singh, R. Singh, N. S. Mangat - Some alternative strategies to Moors' model in randomized response sampling. J. Statist. Planning Infer.,83, 243-255. 2000.
[SUC04] H. P. Singh, L. N. Upadhyaya, P. Chandra - A general family of estimators for estimating population mean using two auxiliary variables in two-phase sampling. Statistics in Transition, 6(7): 1055-1077, 2004.
[S+15] A. Sanaullah, M. Noo-ul-amin, M. Hanif, R. Singh - Generalized exponential chain estimators using two auxiliary variables for stratified sampling with non-response. Sci. Int. (Lohore), 27 (2), 901-915, 2015.
[TG13] N. S. Thakur, K. Gupta - A Study of Linear Combination Based Factor-Type Estimator for Estimating Population Mean in Sample Survey, Journal of Reliability and Statistical Studies. 6(2): 81-90, 2013.
[TK04] R. Tabasum, I. A. Khan - Double sampling for ratio estimation with non-response, Jour. Ind. Soc. Agril. Statist., 58(3), 300-306, 2004.
[TK06] R. Tabasum, I. A. Khan - Double Sampling Ratio Estimator for the Population Mean in Presence of Non-Response. Assam Statist. Review, 20(1), 73- 83, 2006.
[TS98] H. Toutenberg, V. K. Srivastava - Estimation of ratio of population means in survey sampling when some observations are missing. Metrika, (48)177-187, 1998.