Abstract
In past few years cognitive radio has attain the focus of various researchers to design to strengthen the technology become more advance day by day. In this regards the sufficient consumption of present frequency spectrum is the prestigious task. The searching of vacant band of frequency means of getting spectrum sensing issue allows the new concept through cognitive radio as the valuable opportunistic spectrum. With this review paper, a possible algorithm is proposed for the detection of spectrum sensing methodologies in the cognitive radio environment. By using this paper, we emphasize on how to maximization the decision accuracy of cognitive radio by using software defined radio under various noise condition. Cognitive radio is basically an auto intelligent design model with the large capabilities to get the idea about the surrounded radio environment through optimum sense, detection and modify the real time operating parameter as per the requirements of unlicensed or secondary user. The new distribution of data rates for the purpose of transmission in field of radio communication can be made possible. At last, we will reach to conclusion part through an analysis of simulation results after multiple approximations, in order to illustrate the optimized performance with better decision accuracy. The improved throughput by the proposed algorithm will give the far better performance as compared to other conventional spectrum sensing method.
Keywords: Enter Cognitive Radio, Software Define Radio, Spectrum Sensing, Spectrum Sharing (SS), Throughput Maximization
________________________________________________________________________________________________________ I. INTRODUCTION
The limited availability of valuable spectrum and underutilization of spectrum usage promote a new communication paradigm to explore the efficient utilization of wireless opportunistic spectrum for radio environment. A study and investigation has been carried out by FCC, which indicate that the total spectrum is not fully utilized in space (geographic location) or time. The real time execution of Cognitive radio (CR) is happened with software define radio(SDR) which gives us an intelligent outcome for future wireless communication model. Such technique, dynamic spectrum access by using spectral covariance method has been implemented to minimize the major issue of spectrum scarcity. By considering an advantage with secondary (unlicensed) users, it can allow to utilize the spectrum resources when zero interference to the licensed users was assured[1]. Cognitive radio arises to form an automated and intelligent system, which solve the spectral congestion problem very smoothly [2].To execute this operation and realize the simulated outcome the National Institute of Information and Communications Technology (NICT) has initiated a project to make sensible technologies and thus the concept of cognitive radio arises as a possible solution [3]. CR has tremendous potential to achieve this task. CR does carry enough potential to look ahead in term of utilization of available radio spectrum gap for wide band network. Thus, the idea to provide spectrum to secondary users in licensed network without any harmful effect to primary user through these technique [4].
II. SPECTRUM REVIEW
Spectrum awareness is derived with multiple segments, it include spectrum analysis. In which the sample of radio parameters has been taken for each interval of time at different radio environment. Each white space (Band of spectrum allotted to the licensed user for specific time and geographic location but it is no longer utilize by the PU [5].
This graph is clearly mentioning the high utilization of radio spectrum in the range of 0-2 MHz and from 2-6 MHz range it has vary less utilization.
Fig. 1: Showing a graph between frequency and power spectral density over the range of 0 to 6 MHz bandwidth.
Interference: The interference of signal as well as channel is the main characteristics to be evaluated in spectrum sensing. The admissible power rating in CR user may be calculated based on property of channel capacity.
Holding time: Holding time is nothing but an approximation of time, taken by the PU while accessing the allowed radio band. This holding time is varied person to person. But it is summarized that more holding time have more accuracy.
Propagation losses and multipath propagation: If the level of operating frequency has been increase, then the probability of propagation loss will also be raised. If the CR users carry the uniform transmission power for communication, then their transmission range decreases on higher frequencies. Because of multipath propagation the performance of signal will get affected.
Fading and Wireless link errors: fading is all about the degradation in signal strength because of multipath propagation. Based on modulation technique used for data transmission and the different interference level specify the wireless link errors. This error may be overcome while choosing the appropriate modulation technique for specific application.
III. SOFTWARE DEFINE RADIO
The implementation part of CR requires various types of arrangement which include software as well as hardware and interfacing port with network, are associated and hence the combination of these arrangement is associated with software define radio or SDR. In tradition the communication technology govern with limited functionality like manual based analog operation. Therefore an advance set of arrangement come into picture and have ability to operate over the wide range of frequency (Near about 2-3 MHz range and above) to understand the needs of parameter changes hence the introduction of SDR is came into existence [4].
Here it is noticed that the SDR relay the execution through software. By the means of that, the OSI model play the key role in spectrum sensing as the physical implementation is possible by interfacing terminal via physical layer and so on with data link layer and some part of network layer also. Apart from these three layers SDR does not operate with remaining layer.
These three layers are very useful to build a bridge for the real time interfacing of existing signal for spectrum sensing. It provide very smart adaptability to control and perform the various property in cognitive radio through which operating frequency, existing power, signal modulation and available bandwidth can be modified as per requisite. In order to avoid the complex analog circuitry, SDR gives a variable form of radio parameters [7]. The cognitive radio is nothing but essentially a SDR which is intelligent enough to know the surrounded environment condition, and able automatically reconfigure.
IV. OPTIMIZATION APPROACH
The performance enhancement of spectrum sensing technique is our main motto. It can be measured more accurately when the selection of windows has chosen appropriately. This section, explains the different suitable windows for our research work. If we utilization of suitable windows technique during analysis in CR then only the desired characteristics of output will meet to our expectation.
Windows Function
V. SPECTRAL COVARIANCE ALGORITHM
Here suppose we consider the possibilities of either one or no primary transmitter are available to sense, so another one that is secondary node may be situated anywhere as inner or at outer corner to the primary cell location. The assumption output issue can then be solving by evaluation based on binary outcome like zero or one under these two types of hypotheses as mentioned below:
H0: z(n) = w(n), H1: z(n) = s(n) + w(n)
The equation represents the hypothesis testing to get the outcome of spectrum sensing based on parameter comparison. In above z(n) stands for any baseband signal, whereas s(n) is nothing but an signal component which received in forms of samples and another term that is w(n) shows the noise component presents in the received signal[10,11,12].
For easiness the total description part which is associates with each stage has summarizing here with their relevant mathematical expression:
In a very initial stage first we has to down convert the available received signal s(t) to respective baseband signal component as
y(t) = x(t)e−j2πfct
After the first stage a Low pass filter (LPF) has been taken to pass low frequency component and down sample y(t) by putting appropriate sampling rate (1/Ts) to generate an sample function z(n)[13,14].
Then after the computation of z(n) will be defined by a spectrogram. This cannot calculate directly. it is derived by short-time Fourier transform (STFT) as
𝑍𝜏(𝑘) =1
N|∑ z(n + τN)
N−1
n=0
e−j2πnk/N| 2
In which N shows FFT points, and τ ∈ {0, 1, ….. ,Nd − 1} represents the index of the sensing window. In the same way the term Nd shows the quantity of sensing windows & k ∈{−N/2, ….. , 0, ….. ,N/2 − 1} is the range of frequency index[15].
Now the appropriate value of DC can be counted in form of matrix of M having dimention N*N
M = [
Zo(−K) ⋯ ZNd−1(−K)
⋮ ⋱ ⋮
Zo (K) ⋯ ZNd−1(K)
]
In above matrix K defines the index for LPF having cut off frequency (Bf ) of FFT, i.e. K = [N ・ Bf/Fs]. This matrix
reduction in size is as result of a low pass filter, which describe spectral feature of primary signal and also reduces noise power. Now we can get the sample covariance of matrix M taking covariance of it
C = cov(M)
Now test statistic T = T1/T2 can be calculated as, where T1 and T2 are testing parameters which is used to compare with threshold value in order to get the outcome of this simulation [12].
The final stage, in which we perform the comparison of T with decision threshold values in order to obtained different hypothesis results.
This test statistic is continue to execute to measure the output for the range of SNR versus the decision accuracy along with different windows used for analysis like hamming window, hann window and rectangular window.
After certain executions analysis process finally come to a point where it achieve the highest decision accuracy in desired output[16].
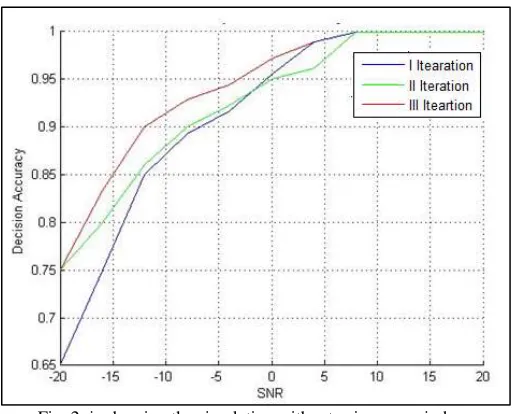
Fig. 2: is showing the simulation without using any window.
It is executed the same program multiple time them after it gives some result in which we find that result is different in each iteration.
Simulation Results
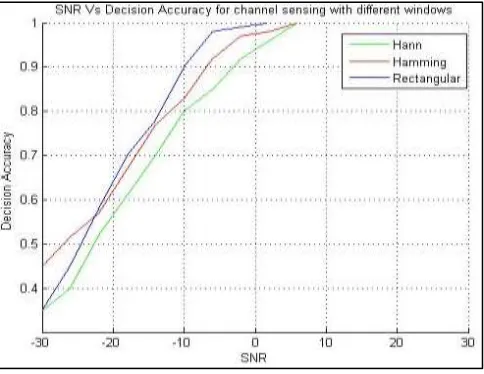
Simulation and then analysis is the main concern of this project work. So we now are applying the different windows for data analysis. The execution is take place in Matlab. The different windows include hann, hamming and rectangular windows for our analysis. The upcoming figure in this chapter will exclusively represent the possible expected out come in which we used different legend like green color for the response of hann window, red color for hamming window and blue color for rectangular window respectively.
Fig. 3: Simulation result in first iteration using windows
It is observed that the result of rectangular window shows consistency in performance and carry vary minimum value that is results very constantly and 0.41 at -30 SNR. Moreover the performance of hann window as well as hamming window gives the result around 0.4 and 0.26 respectively.
Now in next execution we find another graph as shown below.
Fig. 5: Simulation result in third iteration using windows
By comparing the table 5.3, 5.4, 5.5 it is keenly observed that the rectangular window will shows more consistent result as compare to hanning and hamming window under the different SNR values, hence the implementation part of this project work illustrated that by using windows technique and it is found that rectangular window is giving more accuracy than other two.
VI. CONCLUSION
In this simulations model it is successfully described the SCS based spectrum sensing principle and analysis using different windows technique gave insignificant results which is exclusively better than any other traditional spectrum sensing approach as it reduced the problem of hidden node, overcomes false alarm and offers more accurate signal detection. From the various observations of simulations it can be concluded that detection time is improved under noisy environment.
REFERENCES
[1] Spectrum Efficiency Working Group. Report of the Spectrum Efficiency Working Group. Technical report, FCC, November 2002.
[2] S. Haykin, Cognitive radio: Brain-empowered wireless communications, IEEE Journal on Selected Area in Communications 23 (5) (February 2005) 201–
220.
[3] Rehan Ahmes, Yasir Arfat Ghous, “Detection of Vacant Frequency Bands in Cognitive Radio” Blekinge Institute of Technology, May 2010.
[4] QinetiQ “An Evaluation Of Software Defined Radio” QinetiQ/D&TS/COM/PUB0603670/Version 1.0 15th Mar 2006.
[5] Simon Haykin, David J. Thomson, and Jeffrey H. Reed (2009), “Spectrum Sensing for Cognitive Radio’’, IEEE Proceeding, Vol. 97, No.5, pp: 849-877.
[6] Tigang Jiang, Honggang Wang, and Athanasios V. Vasilakos “QoE-Driven Channel Allocation Schemes for Multimedia Transmission of Priority-Based
Secondary Users over Cognitive Radio Networks IEEE Journal On Selected Areas In Communications, VOL. 30, NO. 7, AUGUST 2012
[7] J. Mitola, “Cognitive Radio: An Integrated Agent Architecture for Software Defined Radio,” PhD thesis, Royal Institute of Technology (KTH), 2000.
[8] Tevfik Yucek and Huseyin Arslan (2009), “A Survey of Spectrum Sensing Algorithms for Cognitive Radio Applications”, IEEE Communication Surveys
& Tutorials, VOL. 11, NO. 1, pp: 116-130.
[9] J. Mitola III and Gerald Q. Maguire, Jr., “Cognitive Radio: Making Software Radios More Personal, in IEEE Personal Communications, Vol 6, Issue 4,
page 13-18, August 1999.
[10] S. Haykin, David J. Thomson, Jefeerey H. Reed “Spectrum sensing for cognitive radio,” Processing of IEEE, vol. 97, No.5, May 2009.
[11] Jaeweon Kim, Jeffrey G. Andrewa “Sensitive White Space Detection With Spectral Covariance Sensing” IEEE Transaction on Wireless Communication
2010.
[12] Tigang Jiang and Honggang Wang and Athanasios V. Vasilakos member IEEE “QoE-Driven Channel Allocation Schemes for Multimedia Transmission of
Priority-Based Secondary Users over Cognitive Radio Networks”, IEEE Journal On Selected Areas In Communications, Vol. 30, No. 7, August 2012
[13] Lu Wei, Student Member, IEEE, and Olav Tirkkonen, Member, IEEE “Spectrum Sensing in the Presence of Multiple Primary Users” IEEE Transactions
On Communications, VOL. 60, NO. 5, MAY 2012.
[14] Amir Ghasemi, Elvino S. Sousa “Spectrum Sensing in Cognitive Radio Network: Requirements, Challenges and Design Trade-offs” IEEE Communication
Magazine April 2008.
[15] Ling Luo and Sumit Roy “Efficient Spectrum Sensing for Cognitive Radio Network via Joint Optimization of Sensing Threshold and Duration” IEEE
TRANSACTIONS ON COMMUNICATIONS, VOL. 60, NO. 10, OCTOBER 2012.
[16] Srisomboon K. “Two-stage spectrum sensing for cognitive radio under noise uncertainty” Published in IEEE ICMU international conference 2015.
[17] Patil D.P., Wadhai V.M. “Performance evaluation of spectrum sensing in Cognitive Radio for conventional discrete-time memoryless MIMO fading