Misclassification of coffee consumption
data and the development of a
standardised coffee unit measure
Robin Poole,1 Sean Ewings,2 Julie Parkes,1 Jonathan A Fallowfield,3 Paul Roderick1
1 Primary Care and Population Sciences Academic Unit, University of Southampton Faculty of Medicine, Southampton, UK 2 School of Health Sciences, University of Southampton, Southampton, UK
3 University of Edinburgh Centre for Inflammation Research, Queen’s Medical Research Institute, Edinburgh, UK
Correspondence to Robin Poole; r. poole@ soton. ac. uk
Received 26 October 2018 Revised 21 March 2019 Accepted 29 March 2019 Published Online First 2 May 2019
To cite: Poole R, Ewings S, Parkes J, et al. BMJ Nutrition, Prevention & Health 2019;2:11–19. © Author(s) (or their employer(s)) 2019. Re-use permitted under CC BY-NC. No commercial re-use. See rights and permissions. Published by BMJ.
What this paper adds
► Cups a day is a heterogeneous measure of coffee consumption due to numerous preparation methods and cup sizes.
► To overcome this limitation we developed a stan-dardised coffee unit measure that takes preparation type and cup size into account.
► When applied to a representative coffee drinking population in the UK, the coffee unit measure re-vealed misclassification in approximately 1 in 4 par-ticipants when preparation type and cup size are not taken into account.
AbsTrACT
background Associations of coffee consumption
with multiple health outcomes have been researched extensively. Coffee consumption, usually reported in cups a day, is a heterogeneous measure due to numerous preparation methods and cup sizes, leading to misclassification. This paper develops a new ‘unit’ measure of coffee and uses coffee consumption data from a representative sample of the UK population to assess misclassification when cup volume and preparation type are not taken into account.
Methods A coffee unit measure was created using
published estimates of caffeine and chlorogenic acid concentrations, and applied across volumes and preparation types. Four-day food diary data in adults from the UK National Diet and Nutrition Survey (NDNS; 2012– 2016) were used to quantify coffee intake. Participant self-reported cups a day were compared with cups a day standardised by (a) 227 mL volume and (b) 227 mL instant coffee equivalents (unit measure), and the degree of misclassification was derived. Sensitivity analyses were conducted to model coffee drinking preferences of different populations and caffeine:chlorogenic acid weighting assumptions of the unit measure.
results The NDNS sample consisted of 2832 adult
participants. Coffee was consumed by 62% of participants. Types varied, with 75% of caffeinated coffee cups being instant, 17% filter, 3% latte, 2% cappuccino, 2% espresso and <1% other types. Comparing reported cups to volume-standardised cups, 84% of participants had correct classification, and 73% when using the coffee unit measure, 22% underestimated and 5% overestimated, largely by one cup. Misclassification varied by gender, age and income. Sensitivity analysis highlighted the benefits of using the unit measure over volume alone to cater for different populations, and stability of the unit composition assumption.
Conclusion Cup volume and preparation type should
be taken into account, through the application of a standardised coffee unit measure, when coffee consumption is classified in future research studies.
InTroduCTIon
Globally, an estimated two billion cups of
coffee are consumed every day.1 When
consumed on such a large population scale, even relatively small health benefits or harms are important to understand. We recently
highlighted that aside from pregnancy, coffee consumption is more likely to be beneficially, rather than harmfully, associated with health outcomes, including lower risk of all-cause mortality, cardiovascular mortality and
incident cardiovascular disease.2 For these
outcomes, maximal relative risk reduction was seen at intakes of 3–4 cups a day. Other consistent beneficial associations included lower risk of incident cancer (prostate, endometrial and skin cancers), metabolic (including type II diabetes) and neurolog-ical conditions (including depression and Parkinson’s disease). The greatest magnitude of benefit was consistently observed between coffee consumption and a range of liver conditions including fibrosis, cirrhosis and hepatocellular carcinoma.
However, the existing evidence may be biased by misclassification of coffee ‘expo-sure’ due to the use of the coffee cup as a unit of measure. Coffee is a complex mixture of over 1000 bioactive compounds including caffeine, chlorogenic acids and
diterpenes,3 and consumption of these
compounds can vary between preparation
methods in numerous ways4—three
prom-inent examples include: espresso coffee, which efficiently extracts caffeine and chlo-rogenic acid to reach higher concentrations than other methods, but is consumed in
on September 12, 2020 by guest. Protected by copyright.
http://nutrition.bmj.com/
smaller volumes; instant coffee, the most common type of coffee consumed in the UK with lower concentrations of caffeine than other methods, but will vary depending on brand and ratio of product to water; and filtered coffee, which has lower concentrations of diterpenes because the compounds do not readily pass through filter paper. Quantifying exposure to coffee, by accounting for cup size and preparation methods, would resolve misclassifi-cation of consumption both within and between studies and help to generate more robust evidence for coffee’s potential benefits and harms. Furthermore, it would allow for greater generalisability of evidence, given that coffee consumption varies by preparation type across different countries; for example, drip/filtered coffee is commonly
consumed in North America5 and Scandinavia,6 whereas
espresso dominates consumption patterns in Spain and
Italy.6
This study aims to investigate whether a new coffee unit measure could be created, similar to the alcohol unit, based on two coffee compounds (caffeine and chloro-genic acid), by taking into account different coffee prepa-ration methods and cup sizes. It also aims to explore the extent of misclassification in the cups a day measure when compared with a cups a day measure standardised by the coffee unit measure and to see if this varies by age, gender and income—factors that may affect the choice of preparation method.
MeThod
Creation of a coffee unit measure
Published estimates of caffeine and chlorogenic acid concentrations across different preparation methods were used to produce a standard coffee unit measure. The caffeine and chlorogenic acid concentrations (mg/ mL) were extracted from published analyses of coffee shop or home prepared coffees, frequently found to have much lower caffeine concentrations compared with
laboratory samples,7 (table 1).4 8–15 Where these were
not available, published laboratory estimates were used. Diterpenes were not included in the coffee unit measure because they are in the order of 100–1000 times lower in concentration (depending on the preparation method) compared with caffeine and chlorogenic acid. Therefore, chlorogenic acid concentrations were considered as a surrogate measure of all non-caffeine compounds within coffee. Caffeine and chlorogenic acid were summed (with equal weight) to produce a total concentration of active ingredients in mg/mL. The most commonly consumed coffee in the UK, instant coffee at a volume of 227 mL (8 UK fluid ounces), was referenced as one unit measure and unit measures of other typical coffee drinks
were derived as presented in table 1. These were
calcu-lated by dividing the summed caffeine and chlorogenic acid of the preparation type and volume of interest by the caffeine and chlorogenic acid concentration of 227 mL of instant coffee. For example, 30 mL of espresso delivers 4.75 mg/mL×30mL=142.5 mg caffeine and chlorogenic
acid, which is equivalent to 142.5/(0.84×227) or 0.7 coffee units. Other examples include 1.7 units in a 227 mL mug of filter coffee, 2.0 units in a 354 mL cappuccino and 1.4 units in a 240 mL latte.
Population sample
Data from years 5–8 (2012–2016) of the UK National Diet
and Nutrition Survey (NDNS)16 were used to quantify coffee
intake in a representative sample of the UK population. The NDNS is a rolling annual cross-sectional survey of
approxi-mately 1000 UK adults and children.17 Participants record
all food and drink consumption in a 4-day food diary, later coded and classified by researchers. We extracted data from
NDNS for every adult participant (aged≥18 years) who
drank at least one cup of coffee during data capture. We recorded number of cups and cup volume for each coffee type consumed.
In the NDNS, coffee preparation methods are broadly classified and recorded as instant, cappuccino, latte, strong infusion, weak infusion and vending machine coffee. Espresso-based drinks, such as cappuccino, latte and mocha, are recorded in their own category but no separate category exists for espresso coffee; we categorised this as strong infusion with volume <65 mL, in keeping with typical volumes of single (30 mL) or double (60 mL) espressos. The remaining strong infusion cups were combined with the weak infusion cups and assumed to represent filtered (regular coffee). Vending machine coffee was assumed to be equivalent in composition to instant coffee. Cup volumes <15 mL or >1000 mL were excluded.
The NDNS provides weights to allow adjustment of the survey data to account for sampling and non-responder
bias. The complex sample function of SPSS V.2418 was used
throughout the analysis to account for stratification, clus-tering and weighting of the NDNS data.
Ascertainment of misclassification
Misclassification in the use of the cups a day measure was assessed by applying (a) a standard cup volume and (b) a standard cup volume and preparation type (coffee unit measure) to the intake of each participant to investigate the impact of using a cups a day measure when volume and preparation type have not been taken into account.
(a) Standard cup volume
A 227 mL volume-standardised equivalent number of cups a day was calculated for each participant. Misclassification was calculated by subtracting the number of volume-stan-dardised cups from the number of reported cups and rounding the result to the nearest cup. For example, if a participant reported one cup of coffee a day with a volume of 400 mL, this would be equivalent to 400/227 or 1.8 volume-standardised cups a day. In this example, the misclassification would be 1.0 minus 1.8 equals −0.8 cups a day (rounded to −1 cup). This is interpreted as reported cups underestimating actual intake by one cup.
(b) Standard cup volume and preparation method (coffee unit measure)
on September 12, 2020 by guest. Protected by copyright.
http://nutrition.bmj.com/
Table 1
Pr
eparation type definitions, caf
feine (CAF), chlor
ogenic acids (CGA) and diterpene concentrations, classification within NDNS and derived cof
fee unit examples
Cof fee pr eparation type CAF mg/mL Sour ce CGA mg/mL Sour ce
Diterpenes (cafestol plus kahweol) mg/L
Sour
ce
CAF+CGA mg/mL
NDNS database
Cof
fee unit of
typical drink
Instant (concentrated br
ewed
cof
fee granules or
powder diluted with boiling water) 0.33 (0.10–0.56)*
21 home br
ewed
8
0.51 (0.28–1.22)*
Eight lab pr
epar
ed
9
3.8†‡
Thr
ee lab pr
epar
ed
sampled in duplicate
10
0.84
Volume of diluent for instant cof
fee
1 unit in 227 mL mug
Decaf
feinated instant§
(instant with CAF removed by pr
ocessing) 0.01 (0.00–0.01)* Thr ee home br ewed 8 0.46
Assumed 10% less than caf
feinated
11
3.7†‡
Thr
ee lab pr
epar
ed
sampled in duplicate
10
0.47
Volume of diluent for instant cof
fee
0.6 units in 227 mL mug
Espr esso (pr essurised water passing thr ough finely gr ound cof fee) 3.11 (1.40–8.92)*
32 shop bought
9
(Scotland)
1.64 (0.22–10.54)*
32 shop bought
9
(Scotland)
4.6†‡
Five lab pr
epar
ed
sampled in triplicate
12
4.75
Str
ong infusion<65
mL
0.7 units in 30 mL espr
esso
Filter (cof
fee and water
passing thr
ough a filter
,
commonly paper)
0.62 (0.22–0.75)*
14 home br
ewed
8
0.81†‡
One lab pr
epar
ed
sampled in triplicate
13
(Arabica)
0.3†‡
One lab pr
epar
ed
sampled in triplicate
12
1.43
Str
ong infusion
≥65 mL and all weak infusions 1.7 units in 227 mL mug
Fr
ench pr
ess
(also known as cafetièr
e—cof
fee pot
with plunger)
0.52† (SD of the mean 0.02)
Thr ee lab pr epar ed sampled in triplicate 4
0.65† (SD 0.002)
Thr
ee lab pr
epar
ed
sampled in duplicate 14
27.9†‡ (based only on cafestol)
Thr
ee lab pr
epar
ed
sampled in duplicate
15 1.17 Not dif fer entiated in database
1.4 units in 227 mL mug
Cappuccino (espr
esso and fr
othed
milk)
0.72 (0.49– 1.24)*
20 shop bought
9
0.41* (0.06–0.99)
20 shop bought
9 9.2 Extrapolated fr om espr esso 1.13 Separate category
2 units in 354 mL cup
Latte (espr
esso and steamed
milk) 0.72 Extrapolated fr om cappuccino 0.41 Extrapolated fr om cappuccino 9.2 Extrapolated fr om espr esso 1.13 Separate category
1.4 units in 240 mL latte glass
Mocha (espr
esso and
chocolate and steamed milk)
0.72 Extrapolated fr om cappuccino 0.41 Extrapolated fr om cappuccino 9.2 Extrapolated fr om espr esso 1.13 Separate category
2 units in 354 mL cup
*Median (minimum to maximum). †Mean. ‡Variability not available/calculable for combined measur
e.
§Other decaf
feinated cof
fee types not included in table.
NDNS, National Diet and Nutrition Survey
.
on September 12, 2020 by guest. Protected by copyright.
http://nutrition.bmj.com/
Table 2 Proportion of coffee and non-coffee drinkers by gender, age and income
Coffee drinking All persons Men Women Age 18–34 years Age 35–54
years Age≥55 years Income*≤£17 500
Income* >£17 500 to
≤£32 383 Income*>£32 383
Caffeinated 54.1 56.2 51.5 43.4 57.7 58.2 48.3 53.2 59.9
Decaffeinated 3.5 3.3 3.9 1.3 2.6 6.3 3.1 4.3 3.6
Mixed caffeinated 4.4 3.0 5.7 1.1 5.0 6.3 3.1 4.9 6.2
None 37.9 37.5 38.9 54.2 34.7 29.2 45.5 37.5 30.3
Total 100 100 100 100 100 100 100 100 100
Base (unweighted) 2832 1158 1674 744 1014 1074 698 647 773
*Data only available for 2118 participants; upper income tertile for years 7 and 8 of the survey was >£32 216. A unit measure-standardised equivalent number of
cups was calculated for each participant. The total coffee unit measure intake for each participant was calculated by summing total caffeine and chlorogenic acid (mg) for each coffee consumed and dividing by the single unit equivalent (ie, instant coffee 0.84 mg/mL×227 mL).
For example, a participant reporting a seven-cup consumption comprising four cups of instant coffee at 250 mL each, two cups of cappuccino at 350 mL each and one cup of espresso at 30 mL, would have consumed:
4 (0.84 mg/mL×250 mL)+2 (1.13 mg/mL×350 mL)+1 (4.75 mg/mL×30 mL)
=840 mg+791 mg+142.5 mg
=1773.5 mg of total caffeine plus chlorogenic acid To standardise to coffee units:
=1773.5 mg/single coffee unit caffeine plus chloro-genic acid
=1773.5 mg/(0.84 mg/mL×227 mL) =9.3 coffee units
In this example, reported intake underestimated actual intake by two cups, calculated by 7.0 minus 9.3 equals −2.3 cups and rounded to −2 cups. The misclassification anal-ysis was repeated separately for decaffeinated coffee using, first, 227 mL caffeinated instant coffee, and second, 227 mL decaffeinated instant coffee as the standard unit.
subgroup analysis
Misclassification was also calculated separately for men
and women, age group (18–34, 35–54 and ≥55 years) and
income tertile (≤£17 500, >£17 500 to ≤£32 383 and >£32
383). Finally, instant coffee as a proportion of all coffee consumed was calculated for all caffeinated coffee drinkers and separately for each subgroup.
sensitivity analysis
Due to espresso being a small volume of highly concen-trated coffee, the misclassification methodology was repeated separately by excluding espresso. Second, the analysis was repeated by substituting instant coffee of any volume with 30 mL espresso coffee (volume-standardised to 30 mL and a single coffee unit measure redefined as 30 mL espresso) to model settings in which espresso is the most frequently consumed coffee type. Finally, to see how
misclassification might change with changing composition assumptions of the unit measure, the analysis was repeated using ratios of caffeine to chlorogenic acid of 0:1, 1:0, 1:2, 1:3, 1:4, 1:5, 2:1, 3:1, 4:1, 5:1, 1:1:1 (diterpenes) and 1:1:1 (higher diterpenes: filter diterpenes replaced with French press diterpenes).
resulTs
There were 2832 adults in the 2012–2016 NDNS sample, and weighted, 62% of participants consumed any coffee over 4 days, including those drinking only caffeinated (54%), decaffeinated (4%) and mixed caffeinated types (4%). The proportion of drinkers and non-coffee drinkers did not differ by gender, but there were fewer coffee drinkers in the
18–34 age group and in the lowest income tertile (table 2).
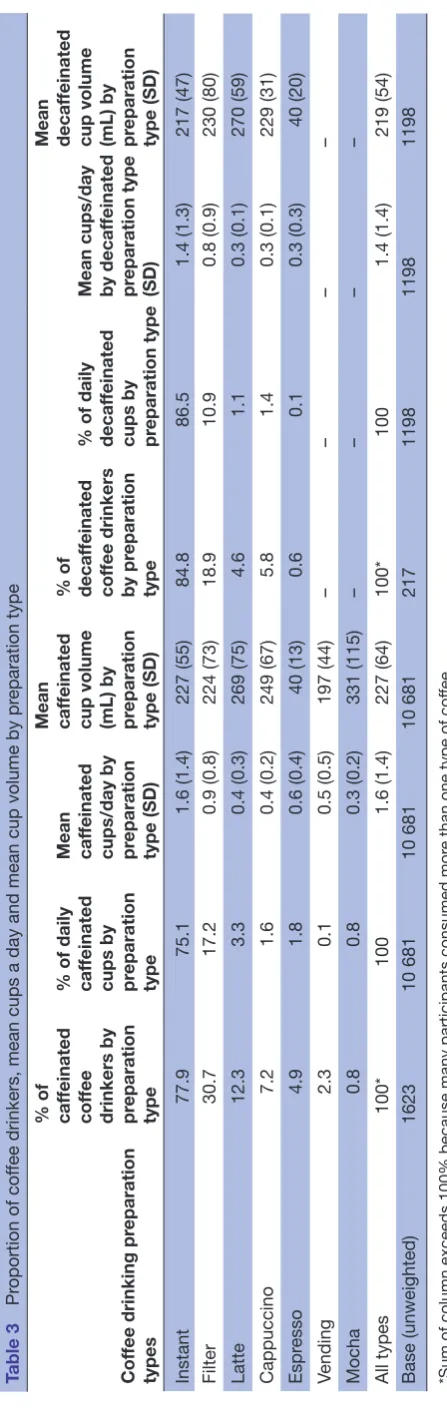
Cups a day and mean cup volume, by preparation type,
are presented in table 3. A total of 10 681 cups of
caffein-ated coffee were consumed during the diary period. Mean intake was 1.6 and 1.4 cups a day among caffeinated and decaffeinated coffee drinkers, respectively. Intake of coffee was marginally higher in men with a mean intake of 1.8 cups compared with 1.5 cups a day in women (data not shown). For those drinking coffee at least once daily, the mean intake was 2.2 cups a day. The mean cup volume was 227 mL and did not vary between daily and non-daily coffee drinkers. It also equated with the mean volume of the most frequently consumed coffee type, instant coffee, which was consumed by 78% of caffeinated coffee drinkers and represented 75% of all coffee cups consumed. The next most frequently consumed coffee type was filter coffee with 31% of caffeinated coffee drinkers consuming this at least once, with a mean volume of 224 mL. Drinks, such as latte, cappuccino, mocha and espresso, were consumed by fewer participants and, apart from espresso, typically in larger volumes than instant coffee.
Among caffeinated coffee drinkers, 69% drank only one preparation type during the diary period and 27% consumed two types, the majority of these drinking instant and one other type. Thus, 4% of coffee drinkers consumed three or more preparation types. For decaffeinated coffee drinkers, one and two preparation types were consumed by 85% and 14%, respectively.
on September 12, 2020 by guest. Protected by copyright.
http://nutrition.bmj.com/
Table 3
Pr
oportion of cof
fee drinkers, mean cups a day and mean cup volume by pr
eparation type
Cof
fee drinking pr
eparation
types
% of caf
feinated
cof
fee
drinkers by preparation type % of daily caf
feinated
cups by preparation type Mean caf
feinated
cups/day by preparation type (SD) Mean caf
feinated
cup volume (mL) by preparation type (SD) % of decaf
feinated
cof
fee drinkers
by pr
eparation
type
% of daily decaf
feinated
cups by preparation type Mean cups/day by decaf
feinated
pr
eparation type
(SD)
Mean decaf
feinated
cup volume (mL) by preparation type (SD)
Instant
77.9
75.1
1.6 (1.4)
227 (55)
84.8
86.5
1.4 (1.3)
217 (47)
Filter
30.7
17.2
0.9 (0.8)
224 (73)
18.9
10.9
0.8 (0.9)
230 (80)
Latte
12.3
3.3
0.4 (0.3)
269 (75)
4.6
1.1
0.3 (0.1)
270 (59)
Cappuccino
7.2
1.6
0.4 (0.2)
249 (67)
5.8
1.4
0.3 (0.1)
229 (31)
Espr
esso
4.9
1.8
0.6 (0.4)
40 (13)
0.6
0.1
0.3 (0.3)
40 (20)
Vending
2.3
0.1
0.5 (0.5)
197 (44)
–
–
–
–
Mocha
0.8
0.8
0.3 (0.2)
331 (115)
–
–
–
–
All types
100*
100
1.6 (1.4)
227 (64)
100*
100
1.4 (1.4)
219 (54)
Base (unweighted)
1623
10 681
10 681
10 681
217
1198
1198
1198
*Sum of column exceeds 100% because many participants consumed mor
e than one type of cof
fee.
Misclassification of coffee intake
When standardised by volume, 84% of participants had correctly classified reported intakes, 8% underestimated
and 8% overestimated (table 4). Most misclassification was
for one cup in either direction, with two or more cups of misclassification accounting for only 2% of participants. The proportion of misclassification generally increased as reported cups a day increased. Unrounded, median volume misclassification was 0.0 cups (IQR −0.2 to 0.2). When stan-dardised by the coffee unit measure, 73% of participant intakes were correctly classified, 22% underestimated and
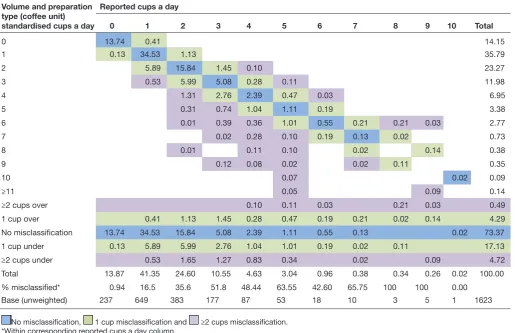
5% overestimated (table 5). Again, most misclassification
was for one cup in either direction, but there was a marginal increase in the proportion of participants with two or more cups of misclassification accounting for 5% of participants. There was also an increase in the proportion of reported cups a day underestimating intake compared with misclas-sification of volume-standardised cups a day. Unrounded, median coffee unit misclassification was −0.1 cups (IQR −0.4 to 0.1). For decaffeinated coffee, 91% of participants had correctly classified volume-standardised intakes and 58% coffee unit measure-standardised intakes, with majority of misclassification overestimating intake by one cup, but increased to 90% when coffee unit measure was redefined as 227 mL of decaffeinated coffee (data not shown).
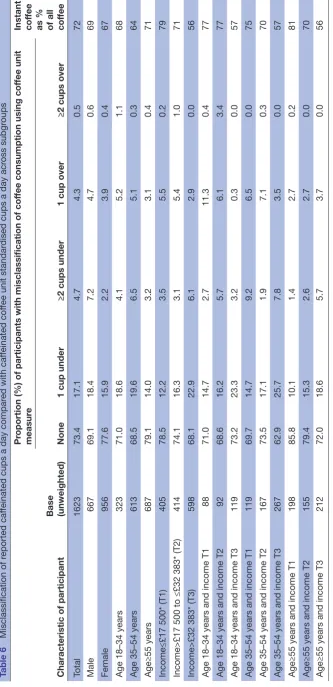
subgroup analysis
Table 6 presents the proportion of misclassification (coffee unit measure) across different subgroups of caffeinated coffee drinkers. There were some notable differences with misclassification being greater in men compared with women, younger compared with older participants and participants in the highest income tertile. Participants in the oldest age group and middle or lower tertile of income had the least misclassification. Caffeinated coffee drinkers in the lowest tertile of income drank 79% of all coffee cups as instant coffee compared with 56% in the upper tertile. Income rather than age appeared to drive most of the non-instant coffee consumption.
sensitivity analysis
Similar results were found when espresso coffee was removed from the analysis with 85% and 74% of partici-pants with no misclassification for volume-standardised and coffee unit-standardised cups a day, respectively. When instant coffee was substituted with espresso coffee, 40% of participants had no misclassification when volume-stan-dardised, but 75% when using the coffee unit measure. When the ratio of caffeine to chlorogenic acid used to create the unit measure was varied, proportions of partic-ipants with no misclassification were relatively stable with 78% for 0:1, 71% for 1:0, 76% for 1:2, 77% for 1:3, 1:4 and 1:5, 70% for 2:1, 3:1, 4:1 and 5:1, and 73% for 1:1:1 (both diterpenes and higher diterpenes).
dIsCussIon
A new coffee unit measure was created using published esti-mates of caffeine and chlorogenic acid across preparation
on September 12, 2020 by guest. Protected by copyright.
http://nutrition.bmj.com/
Table 4 Proportion of participants misclassified across reported caffeinated cups compared with 227 mL volume-standardised cups a day
Volume-standardised cups a day
Reported cups a day
0 1 2 3 4 5 6 7 8 9 10 Total
0 13.80 0.98 0.06 14.83
1 0.07 38.96 2.24 0.16 41.44
2 1.41 19.64 1.93 0.17 23.14
3 2.36 6.76 0.47 0.21 0.03 9.83
4 0.30 1.27 2.91 0.63 5.11
5 0.01 0.43 0.86 1.32 0.19 2.81
6 0.23 0.66 0.55 0.21 0.03 1.68
7 0.09 0.19 0.14 0.11 0.54
8 0.05 0.01 0.14 0.21
9 0.07 0.02 0.02 0.11
10 0.21 0.02 0.24
≥11 0.09 0.09
≥2 cups over 0.06 0.16 0.17 0.21 0.03 0.03 0.66
1 cup over 0.98 2.24 1.93 0.47 0.63 0.19 0.21 0.11 0.14 6.89
No misclassification 13.80 38.96 19.64 6.76 2.91 1.32 0.55 0.14 0.02 84.10
1 cup under 0.07 1.41 2.36 1.27 0.86 0.66 0.19 0.01 0.02 6.84
≥2 cups under 0.31 0.43 0.23 0.22 0.02 0.21 0.09 1.51
Total 13.87 41.35 24.60 10.55 4.63 3.04 0.96 0.38 0.34 0.26 0.02 100.00
% misclassification* 0.51 5.77 20.17 35.94 37.08 56.60 42.60 63.83 100 100 0.00
Base (unweighted) 237 649 383 177 87 53 18 10 3 5 1 1623
No misclassification, 1 cup misclassification and ≥2 cups misclassification. *Within corresponding reported cups a day column.
methods and applied to representative coffee consumption data from a UK population. Approximately, 84% of caffein-ated coffee drinkers in the NDNS had correct classifica-tion of reported cups a day measure when compared with volume-standardised and 73% for coffee-unit standardised cups a day that took preparation type into account. The vast majority of the misclassification was under or over by only one cup, with two or more cup misclassification in 5% of participants. This is reassuring when considering most existing research between coffee and health has used cups a day as the measure of intake. However, our analysis suggests classification of coffee consumption could be improved beyond the simple cups a day measure, since approximately one in four participants had misclassified intake when taking into account volume and preparation type.
Misclassification varied with gender, age and income tertile with greater proportion of misclassification in men, younger participants and participants in the highest income tertile. Misclassification is a measure of deviation in size or preparation type from the standard 227 mL cup of instant coffee and participants in the highest tertile of income had lowest instant coffee consumption as a proportion of total coffee consumption compared with lower incomes. Instant coffee represents a relatively inexpensive preparation type with the price of one jar being similar to a single coffee shop bought espresso-based coffee. Home prepared non-instant
types using ground coffee or coffee pods/capsules, which would be classified as infusions in the NDNS data, while not as expensive as coffee shop cups represent a signifi-cant additional cost per cup compared with instant coffee. Younger participants in the lowest income tertile had a relatively high proportion of underestimated misclassifica-tion despite a high propormisclassifica-tion of instant coffee consump-tion. This was due to larger volumes of non-instant coffee compared with other subgroups (data not shown). Despite low income, younger people in the lower income tertile may be drinking more of their non-instant coffee outside the home environment where typically drinks are served in much larger volumes.
There were an even proportion of participants with under or overestimation of coffee consumption when reported cups were compared with volume-standardised cups a day suggesting actual coffee cup size was distributed evenly around the 227 mL standard volume. This pattern was still present when espresso coffee was excluded from the anal-ysis. This was because relatively few espresso coffees were consumed during the diary period. When instant coffee was switched to espresso and compared with a 30 mL stan-dard volume, the proportion of misclassification increased substantially while the misclassification using the coffee unit measure was relatively stable. Misclassification by volume is clearly affected by the choice of standard volume and this is
on September 12, 2020 by guest. Protected by copyright.
http://nutrition.bmj.com/
Table 5 Proportion of participants misclassified across reported caffeinated cups compared with coffee unit standardised cups a day (where 1 unit=227 mL instant coffee)
Volume and preparation type (coffee unit) standardised cups a day
Reported cups a day
0 1 2 3 4 5 6 7 8 9 10 Total
0 13.74 0.41 14.15
1 0.13 34.53 1.13 35.79
2 5.89 15.84 1.45 0.10 23.27
3 0.53 5.99 5.08 0.28 0.11 11.98
4 1.31 2.76 2.39 0.47 0.03 6.95
5 0.31 0.74 1.04 1.11 0.19 3.38
6 0.01 0.39 0.36 1.01 0.55 0.21 0.21 0.03 2.77
7 0.02 0.28 0.10 0.19 0.13 0.02 0.73
8 0.01 0.11 0.10 0.02 0.14 0.38
9 0.12 0.08 0.02 0.02 0.11 0.35
10 0.07 0.02 0.09
≥11 0.05 0.09 0.14
≥2 cups over 0.10 0.11 0.03 0.21 0.03 0.49
1 cup over 0.41 1.13 1.45 0.28 0.47 0.19 0.21 0.02 0.14 4.29
No misclassification 13.74 34.53 15.84 5.08 2.39 1.11 0.55 0.13 0.02 73.37
1 cup under 0.13 5.89 5.99 2.76 1.04 1.01 0.19 0.02 0.11 17.13
≥2 cups under 0.53 1.65 1.27 0.83 0.34 0.02 0.09 4.72
Total 13.87 41.35 24.60 10.55 4.63 3.04 0.96 0.38 0.34 0.26 0.02 100.00
% misclassified* 0.94 16.5 35.6 51.8 48.44 63.55 42.60 65.75 100 100 0.00
Base (unweighted) 237 649 383 177 87 53 18 10 3 5 1 1623
No misclassification, 1 cup misclassification and ≥2 cups misclassification. *Within corresponding reported cups a day column.
especially important when intake includes espresso coffee, which is low volume but high concentration, compared with other preparation methods, and is the most commonly
consumed coffee in some European countries.6 The results
highlight the superiority of our coffee unit measure over a volume only comparison across the range of preparation methods. When using a coffee unit measure, there were a greater proportion of participants with underestimated compared with overestimated intakes. This suggests that the coffee unit measure captures the higher concentration of caffeine and chlorogenic acid present in the non-instant types of coffee preparation.
Misclassification of intake among decaffeinated coffee drinkers was much less than caffeinated coffee drinkers when standardised to a unit measure of 227 mL decaf-feinated instant coffee, due to less deviation from size and type of decaffeinated compared with caffeinated coffee. However, when standardised to a unit measure of caffein-ated instant coffee, the misclassification increased substan-tially. This highlights potential bias where studies have not differentiated between caffeinated and decaffeinated coffee when measuring coffee exposure.
The impact of an approximate 25% misclassification of coffee consumption on the conclusions drawn by existing coffee research is uncertain. Misclassification of exposure in this context is likely to be non-differential meaning that it
will affect those with and without a health outcome equally. Such misclassification is generally understood to dilute the strength of effect estimates when the exposures are dichot-omous, moving both beneficial and harmful estimates towards the null, but may be less predictable when there
are more than two exposure groups.19
strengths and limitations
The creation of a coffee unit measure represents a unique attempt to improve the classification of coffee consumption in participants of research studies and in the wider health-care setting. However, there are a number of limitations. First, the coffee unit measure was created using limited data from published estimates of caffeine and chlorogenic acid concentrations. In contrast to a unit of alcohol that is easy to define as 10 mL (8 g) of pure ethanol, the coffee unit measure does not focus on one ingredient. Coffee is a complex mixture of over 1000 bioactive substances, with no scientific consensus that a single component is responsible for health effects. More likely, there is a synergy between ingredients such that caffeine in isolation has different health effects compared with whole coffee. We used two components of coffee to create a unit measure because these were available as a concentration (mg/mL) for a range of coffee preparation types. In the sensitivity analysis, varying the ratio of caffeine to chlorogenic acid, or adding
on September 12, 2020 by guest. Protected by copyright.
http://nutrition.bmj.com/
Table 6
Misclassification of r
eported caf
feinated cups a day compar
ed with caf
feinated cof
fee unit standar
dised cups a day acr
oss subgr
oups
Characteristic of participant
Base (unweighted)
Pr
oportion (%) of participants with misclassification of cof
fee consumption using cof
fee unit
measur
e
Instant cof
fee
as % of all cof
fee
None
1 cup under
≥2 cups under
1 cup over
≥2 cups over
Total
1623
73.4
17.1
4.7
4.3
0.5
72
Male
667
69.1
18.4
7.2
4.7
0.6
69
Female
956
77.6
15.9
2.2
3.9
0.4
67
Age 18–34 years
323
71.0
18.6
4.1
5.2
1.1
68
Age 35–54 years
613
68.5
19.6
6.5
5.1
0.3
64
Age≥55 years
687
79.1
14.0
3.2
3.1
0.4
71
Income≤£17 500* (T1)
405
78.5
12.2
3.5
5.5
0.2
79
Income>£17 500 to ≤£32 383* (T2)
414
74.1
16.3
3.1
5.4
1.0
71
Income>£32 383* (T3)
598
68.1
22.9
6.1
2.9
0.0
56
Age 18–34 years and income T1
88
71.0
14.7
2.7
11.3
0.4
77
Age 18–34 years and income T2
92
68.6
16.2
5.7
6.1
3.4
77
Age 18–34 years and income T3
119
73.2
23.3
3.2
0.3
0.0
57
Age 35–54 years and income T1
119
69.7
14.7
9.2
6.5
0.0
75
Age 35–54 years and income T2
167
73.5
17.1
1.9
7.1
0.3
70
Age 35–54 years and income T3
267
62.9
25.7
7.8
3.5
0.0
57
Age≥55 years and income T1
198
85.8
10.1
1.4
2.7
0.2
81
Age≥55 years and income T2
155
79.4
15.3
2.6
2.7
0.0
70
Age≥55 years and income T3
212
72.0
18.6
5.7
3.7
0.0
56
*Income tertile data only available for 1335 of 1623 caf
feinated cof
fee drinking participants; upper income tertile for years 7 and 8 of the survey was >£32 216.
on September 12, 2020 by guest. Protected by copyright.
http://nutrition.bmj.com/
in diterpenes, in the creation of the coffee unit measure made little difference to the proportion of misclassification.
There are many other factors that could not be taken into account in our analysis of the NDNS data. We made assump-tions regarding the preparation types, such as vending machine coffee being equivalent to instant coffee. Many modern vending machines emulate the barista prepared espresso-based beverages and may have coffee unit concen-trations more similar to non-instant coffee. A further assumption was that strong infusions under 65 mL were espresso and this may have overestimated coffee unit intake if these had actually been small volumes of non-espresso coffee. However, vending machine and espresso coffee were a very small proportion of total coffee consumed.
We assumed larger volumes of strong infusion and all weak infusions as filter coffee but, in reality, these may have been other types including French press (cafetière), Aero-press or coffee pods. Such coffee types would have a similar composition to filter coffee and our assumption is unlikely to have affected the misclassification substantially.
Further misclassification may arise from incomplete consumption of coffee within each cup although studies have suggested that these tiny amounts are unlikely to
contribute to significant misclassification.20 Furthermore,
we cannot account for strength of coffee due to variation in the quantity of coffee grounds used, extraction by baristas, roast or bean type (Arabica vs Robusta). Concentrations of caffeine and chlorogenic acids in the analysis of home-pre-pared and shop-prehome-pre-pared coffee beverages varied widely, and even identical preparation methods using the same coffee in the same establishment on consecutive days have
been found to produce coffee that varied in composition.21
The standardised coffee unit measure could be applied in an interventional study to classify baseline coffee intake or quantify a target intake across preparation types. It could also be used in observational studies to improve the quantifi-cation of coffee intake. One potential drawback is the extra level of information required to generate the coffee unit measure, requiring estimation of volume and preparation method, and a suitable instrument to capture this informa-tion. Many studies have found a dose–response relation-ship between coffee and health benefits, and future health advice may be based on reaching an intake threshold. A threshold based on units rather than cups could reduce the issues associated with coffee cup heterogeneity.
In conclusion, coffee has been beneficially associated with a range of health outcomes, and some harms, espe-cially during pregnancy. A coffee unit measure is easy to construct and can be applied to a range of coffee prepa-ration types. It has the potential to improve the classifica-tion of coffee as an exposure and could be considered for use in studies that evaluate the relationship between coffee drinking and health outcomes, and in delivering future health advice.
Contributors RP conceptualised and created the coffee unit measure, extracted coffee drinking data, performed the analysis and wrote the first draft of the manuscript; SE advised on aspects of the analysis and revised the manuscript; JP
conceptualised the study and revised the manuscript; JAF provided comments and revised the manuscript; and PR conceptualised the study, revised the manuscript and is the guarantor.
Funding The authors have not declared a specific grant for this research from any funding agency in the public, commercial or not-for-profit sectors.
Competing interests JP reports personal fees from Siemens Healthineers, outside the submitted work; JAF reports personal fees and other from Novartis, personal fees from Merck Sharp & Dohme, grants from GlaxoSmithKline, grants from Intercept Pharmaceuticals, personal fees from Galecto Biotech and personal fees from Gilde Healthcare, outside the submitted work.
Patient consent for publication Not required.
data availability statement National Diet and Nutrition Survey data used in this study are available via the UK Data Service.
open access This is an open access article distributed in accordance with the Creative Commons Attribution Non Commercial (CC BY-NC 4.0) license, which permits others to distribute, remix, adapt, build upon this work non-commercially, and license their derivative works on different terms, provided the original work is properly cited, appropriate credit is given, any changes made indicated, and the use is non-commercial. See: http:// creativecommons. org/ licenses/ by- nc/ 4.0
reFerenCes
1. British Coffee Association. British Coffee Association - Find the coffee facts [Internet], 2016.
2. Poole R, Kennedy OJ, Roderick P, et al. Coffee consumption and health: umbrella review of meta-analyses of multiple health outcomes. BMJ 2017;359.
3. Ludwig IA, Clifford MN, Lean MEJ, et al. Coffee: biochemistry and potential impact on health. Food Funct 2014;5:1695–717. 4. Gloess AN, Schönbächler B, Klopprogge B, et al. Comparison of
nine common coffee extraction methods: instrumental and sensory analysis. Eur Food Res Technol 2013;236:607–27.
5. Tucker CM. Series: Anthropology of Stuff series: Routledge. In:
Coffee Culture [Internet]. 2nd edn. New York: Routledge, 2017.
6. Morris J. Why espresso? Explaining changes in European coffee preferences from a production of culture perspective. Eur Rev Hist Rev Eur d'histoire 2013;20:881–901.
7. Bracken MB, Triche E, Grosso L, et al. Heterogeneity in assessing self-reports of caffeine exposure: implications for studies of health effects. Epidemiology 2002;13:165–71.
8. Gilbert RM, Marshman JA, Schwieder M, et al. Caffeine content of beverages as consumed. Can Med Assoc J 1976;114:205–8. 9. Ludwig IA, Mena P, Calani L, et al. Variations in caffeine and
chlorogenic acid contents of coffees: what are we drinking? Food Funct 2014;5:1718–26.
10. Moeenfard M, Erny GL, Alves A. Variability of some diterpene esters in coffee beverages as influenced by brewing procedures. J Food Sci Technol 2016;53:3916–27.
11. Farah A, de Paulis T, Moreira DP, et al. Chlorogenic acids and lactones in regular and Water-Decaffeinated arabica coffees. J Agric Food Chem 2006;54:374–81.
12. Gross G, Jaccaud E, Huggett AC. Analysis of the content of the diterpenes cafestol and kahweol in coffee brews. Food Chem Toxicol
1997;35:547–54.
13. Ludwig IA, Sanchez L, Caemmerer B, et al. Extraction of coffee antioxidants: impact of brewing time and method. Food Res Int
2012;48:57–64.
14. Moeenfard M, Rocha L, Alves A. Quantification of caffeoylquinic acids in coffee Brews by HPLC-DAD. J Anal Methods Chem
2014;965353.
15. Zhang C, Linforth R, Fisk ID. Cafestol extraction yield from different coffee brew mechanisms. Food Res Int 2012;49:27–31.
16. MRC Elsie Widdowson Laboratory. National Diet and Nutrition Survey
Years 1-8. 2008/09-2015/16. [data collection]. 9th edn, 2018.
17. National Diet and Nutrition Survey. Appendix B methodology for
years 7 and 8 of the NDNS RP, 2018.
18. Corp IBM. IBM SPSS statistics for MAC. Armonk, NY: IBM Corp, 2016.
19. Dosemeci M, Wacholder S, Lubin JAYH. Does nondifferential misclassification of exposure always bias a true effect toward the null value? Am J Epidemiol 1990;132:746–8.
20. Schreiber GB, Maffeo CE, Robins M, et al. Measurement of coffee and caffeine intake: implications for epidemiologic research. Prev Med 1988;17:280–94.
21. McCusker RR, Goldberger BA, Cone EJ. Caffeine content of specialty coffees. J Anal Toxicol 2003;27:520–2.
on September 12, 2020 by guest. Protected by copyright.
http://nutrition.bmj.com/