NiO Nanoparticles: Synthesis and Characterization
A. Rahdar*,a, M. Aliahmadb, Y. Azizib
a
Departments of Physics, Faculty of Science, University of Zabol, Zabol, Iran b
Department of Physics, Faculty of Science, University of Sistan and Baluchestan, Zahedan, Iran
Abstract
In the current paper,Nanostructured Nickel oxide (NiO) were synthesized by co-precipitation method using Nickel(II) Chloride Hexahydrate (NiCl2.6H2O) and sodium hydroxide (NaOH) as starting material. Structural, optical and magnetic properties of nanostructures were characterized by X-ray diffraction (XRD), scanning electron microscopy (SEM), Atomic force microscope (AFM), UV–Vis absorption; Fourier transformed infrared (FTIR) and vibrating sample magnetometer (VSM) technique. The X-ray diffraction pattern studies revealed the NiO have a face-centered cubic (FCC) structure and confirmed the presence of high degree of crystallinity nature NiO nanoparticles that their average size is found to be 26 nm. The composition of nanostructures confirmed by analysis of FTIR spectra. The average size of the NiO nanoparticle observed from scanning electron microscopy images is found to be dimensions about 24 nm. Magnetic measurement confirmed the Nickel Oxide nanostructures superparamagnetic behavior at room temperature (RT) after calcinations.
2015 JNS All rights reserved
Article history:
Received 03/04/2015 Accepted 19/05/2015 Published online 01/06/2015
Keywords:
Precipitation method NiO:Cu nanoparticles Hysteresis loop VSM
*Corresponding author:
E-mail address: [email protected] Phone: +98 541 2446565 Fax: +98 542 2242503
1. Introduction
Over recent years due to applications, such as catalysts, gas sensors, electrochromic film, fuel cell , magnetic materials , anode of organic light-emitting diodes and thermoelectric materials [1-12], considerable attention has been focused on the production of nanostructured metal oxide materials such as NiO nanoparticles. Xiang et al.
well-dispersed NiO nanoparticles but the average particle diameter of 30 nm using polyvinylpyrrolidone assisted.
Recently, several methods have been developed to syntheis nickel oxide nanoparticles , including low-pressure spray pyrolysis[16], surfactant - mediated method[17], simple liquid phase process[18] and other techniques[19–21] Among various methods for controlled synthesis, Co-Precipitation chemical route, based on solution Process was used here to synthesis NiO nanoparticles.
2. Experimental
2.1. Synthesis of NiO nanoparticles
NiCl2.6H2O and NaOH as starting material and double-distilled water as dispersing solvent were used to prepare NiO nanoparticles.
At first, 5.9412 gr NiCl2.6H2O was dissolve in 250 CC double-distilled water as solvent to get a certain molar concentration at room temperature. Then, obtained solution was magnetically stirred for 40 min at 50 oC temperature.Afterwards; the 10 cc NaOH with certain molar was added drop wise to the solution until the pH becomes 8. So nanoparticles of NiO were fabricated by chemical reaction as follow:
NaCl O
H NiO NaOH O
H O H
NiCl2.6 2 2 2 8 2 2 (1)
In the final step, the obtained green gel washed with distilled water and ethanol to remove formed byproducts during the reaction process and dried at 60 oC temperature for 14 hr. Then, dried samples were calcined (annealed) at 500 oC temperatures for 2 h to obtain NiO nanoparticles. Because of this annealation the color of sample changes from green to black.
2.2. Materials characterization
X-ray diffraction patterns were taken by means of a Philips diffractometer model PW1800 (The Netherlands). X-ray source was Cukα with 1.541 nm wavelength. Scanning electron microscope (SEM) images and energy-dispersive x-ray spectroscopy (EDX) patterns were taken using VEGA\\TESCAN-XMU in Metallurgy Razi center. Atomic force microscope (AFM) observation was performed with Danish Micro Engineering (DME) Danish Micro Engineering (A/S DK-2730 Denmark). The experiments were carried out at room temperature in non-contact mode. UV-Vis spectra of the nanoparticles were obtained at room temperature using a PG (UK) instrument T80 UV-Vis spectrophotometer. Magnetization measurements were performed at room temperature using a vibrating sample magnetometer (MKD model-Iran). Infrared spectra were taken on a JASCO 640 plus infrared spectrometer in the range of 4000–4000 cm-1.
3. Results and discussion
The XRD patterns of the NiO nanoparticles showed diffraction peaks absorbed at 2θ values (Fig.1).
The average crystallite size (D) of nanoparticles was calculated using the Scherer formula as follows:
Dh,k,l=0.9λ/ (βh,k,l cosθ) (2)
Where λ is the wavelength (λ = 1.542 Å) (CuKα),
Fig. 1. XRD pattern of NiO nanoparticles after calcinations.
The size of NiO nanostructure using the (111) plane reflection in XR patterns was 12 nm,As seen in Fig. 1, All these diffraction peaks accordance with the that of the standard spectrum (JCPDS, No.01 -073-1523 ) for X=0 sample. Table.1 shows Data of X-ray diffraction (XRD) pattern from NiO nanoparticle after calcination.
Peaks related to high angles due to the large line broadening have submerged in the background, which is attributed to the material nanoscale size. The average size of the NiO nanoparticle indexing to the (111) plane observed from X-ray diffraction (XRD) pattern is 26 nm.
Fig.2 shows that theNiO nanoparticles calcined at 500 oC temperature exhibit high crystalline quality than samples before calcinations.
Fig. 2. X-ray pattern of NiO nanoparticle (a)
before and (b) after calcination.
Table 1. Data of X-ray diffraction (XRD) pattern
from NiO nanoparticle after calcination.
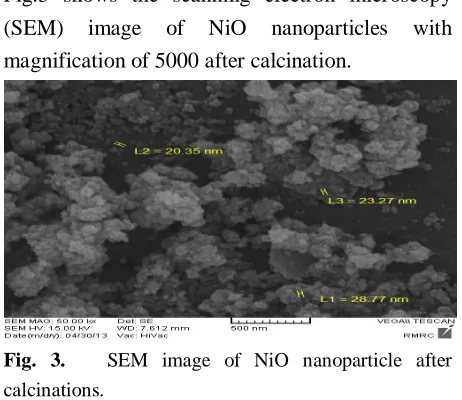
Fig.3 shows the scanning electron microscopy (SEM) image of NiO nanoparticles with magnification of 5000 after calcination.
Fig. 3. SEM image of NiO nanoparticle after calcinations.
The results indicate that particles are in are spherical shape and nanoclusters due to agglomeration process. The average size of the NiO nanoparticle observed from SEM images is 24 nm.
Crystallinity is evaluated through comparison of crystallite size as ascertained by SEM particle size determination.Crystallinity index is presented below:
I=Dp(SEM) / Dcry(XRD) (3)
Relative intensity Peak
height Full
width at half maximum (FWHM) Diffraction
angle 2ϴ (degree) (hkl)
62.14 307.41
0.5510 36.9621
(111)
100.00 494.70
0.3149 43.1404
(200)
38.68 191.37
0.6720 62.6546
(220)
10.28 66.52
1.1021 75.4856
(311)
7.64 49.48
1.5744 79.2940
Where Icry is the crystallinity index; Dp=24 nm is the particle size (obtained from SEM image); Dcry=26 nm is the particle size (calculated from the Scherrer equation).
In present study, Icry =0.9 value is close to 1, then it is assumed that the crystallite size represents monocrystalline whereas a polycrystalline have a much larger crystallinity index [22].
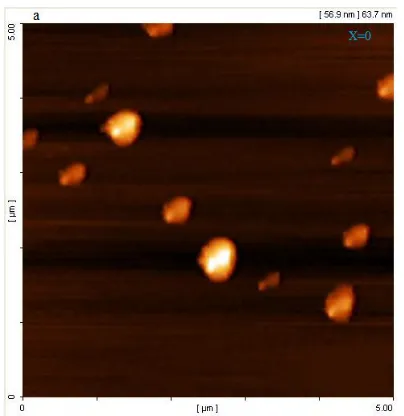
Fig .4 shows the Atomic force microscopy (AFM) image of NiO nanoparticles with before calcination.
Fig. 4. AFM images for NiO nanoparticle before calcination.
The average size of the NiO nanoparticle observed from AFM image is 56 nm .
Magnetization measurements of NiO nanoparticles were performed using VSM technique at fields of -8000 to 8000 Oersted at at room temperature are shown in Fig.5, 6 before and after calcinations,respectivly.
Fig. 5. M-H curve of NiO nanoparticle before calcinations.
Fig.6. Magnetic hysteresis curves of NiO nanoparticle after calcinations.
Table 2. Magnetization (M), magnetic field (H) of the
samples ( NiO Nanoparticle).
As seen in Fig. 5, the sample has antiferromagnetism property before calcinations due to their weak ferromagnetism permeability (0-0.1).
From Fig. 6 it is seen that the NiO nanoparticles exhibits super paramagnetic behavior at room temperature.
Figures 5, 6 it is found that there is no hysteresis in the M-H curves.
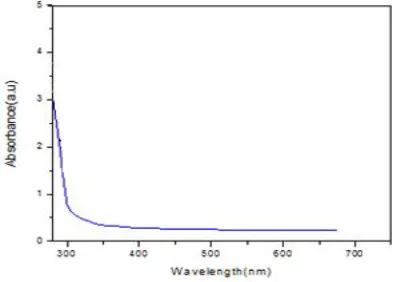
The UV–Vis spectra of NiO nanoparticles after calcination are shown in Fig. 7 that was measured using a USB-2000 UV–Vis spectrophotometer.
Fig. 7. UV–vis spectra of NiO nanoparticles after calcination .
The absorption edge is observed in the range of 280-350 nm.This blue shift of the absorption
edges for different sized nanocrystals is related to the size decrease of particles due to to the quantum confinement effect of nanoparticles. It is necessary to mention that the optical direct band gap values of the Nio samples were determined by Tauc’s relation [23]
2 1 0(h Eg)
h
(4)
Where hν, αo and Eg are photon energy, a constant
and optical band gap of the nanoparticles, respectively. Absorption coefficient (α) of the
powders at different wavelengths can be calculated from the absorption spectra. The values of Eg were determined by extrapolations of the linear regions of the plot of (αhυ)2versus
We calculate the size of the nanoparticle as given given by Brus equation:
εR 1.8e m 1 m 1 2R π ) ( Ε ) ( E 2 h e 2 2 2 g
gnano bulk
(5) where Eg(bulk) in eV is the bandgap energy of bulk, me and mh are electron and hole effective masses and R in nm is the particle size. Egn, Egb are the band gap of nano 3.82ev and bulk 3.74ev system, respectively. Fig. 8 show optical band gap of the Nio sample.
Fig. 8. (αh)2 versus (hspectra of
NiO
nanoparticle.
sample Max. (emu/g) Before calcination M max. (emu/g) After calcina tion H max. (Oe) Before and after calcination Magnetic Susceptibility ) χ ( *10-5 before calcination
Using these values, the average size has been calculated as 40 nm. we can conclude ,When the band gap energy increases, the particle size decreases. It is denoted From this that the synthesized particles are nanoparticles.
Fig.9 and 10 shows FT-IR transmission spectra were taken on JASCO 640plus infrared spectrometer in the range of 4000–400 cm-1 at room temp.
Fig. 9. FTIR spectrum of the NiO nanoparticle before Calcination at room temp.
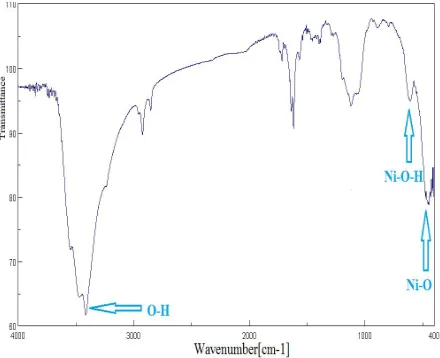
Fig. 10. FTIR spectrum of the NiO nanoparticle after calcinations at room temp.
Samples were prepared by mixing samples powder with KBr, which were ground and pressed into a transparent pellet with a diameter of cm-1.
The peak around 3414 cm-1 on the FT-IR spectrum is related to O-H bond. The absorption at 1632cm-1attributed to hydroxyl groups. The absorption bonds at 1420cm-1and 1117 cm-1 indicates the existence of carbonates and the bond at 2900cm-1 correspond to C-H stretching mode [24]
As shown in fig 9, The absorption bonds at 470 and 522 cm-1 are associated to Ni-O vibration bond ,but absorption bond at 619 cm-1 is assigned to Ni-O-H stretching bond. The above information confirmed formation of pure NiO nanoparticles. Presence of Carbon impurity in the samples is because of ethanol, which is used for washing. As shown in fig 10 ,The absorption bonds at 447 cm-1 are associated to Ni-O vibration bond [25] but absorption bond at 607 cm-1 is assigned to Ni-O-H stretching bond.
Fig.9. FTIR spectrum of the NiO nanoparticle before Calcination at room temp.
4. Conclusion
Acknowledgements
The authors would like to thank from University of Sistan and Baluchestan for financial support this work.
References
[1] S.A. Molla, M.N. Hammed, G.A. El-Shobaky,Materials Letters.58 (2004) 1003–1011. [2] S.Wu, W.Chen, Y.Ferng,Materials Letters. 60 (2006)790–795.
[3] K.K. Purushothaman , G. Muralidharan, Solar Energy Materials and Solar Cells.93( 2009)1195– 1201.
[4] Z. Liu, Y. Zu, , Y. Fu, Y.Zhang, H.Liang,Materials Letters.62( 2008) 2315–2317. [5] I.Castro-Hurtado, J.Herran, N.Perez, S.M.Olaizola, G.G.Mandayo, E.Castano,Sensor Letters. 9(2011) 64-68.
[6] Y. Du, W.Wang, X.Li, J.Zhao, J.Ma, Y.Liu, G.Lu, Materials Letters.68( 2012)168–170.
[7] Y.Li, Y.Xie, J.Gong, Y.Chen, Z.Zhang,Materials Science and Engineering: B.86( 2001)119–122. [8] J. A. Borchers, Y. Ijiri, D. M. Lind, P. G. Ivanov, R. W. Erwin , S. H. Lee , C. F. Majkrzak,Journal of Applied Physics. 85(1999)5883–5885.
[9] Y.Hu, H.Qian,T.Mei,J.Guo,T.White,Materials Letters.64(2010)1095–1098.
[10] V. Biju, Materials Letters.62(2008) 2904–2906. [11] A.C.Gandhi, C.Y.Huang C.C.Yang, T.S.Chan, C.L.Cheng, Y.R.Ma , S.Y.Wu, Nanoscale Research Letters. 6(2000) 485.
[12] W.Shin, , N.Murayama, Materials Letters.45 (2000)302–306.
[13] L. Xiang, X.Y. Deng, Y. Jin, Scripta Materialia. 47(2002)219-224.
[14] Y.D. Wang, C.L.Ma, X.D. Sun, H.D. Li, Inorganic Chemistry Communications.5(2002)751– 755.
[15] D. Tao, F.Wei,Materials Letters.58( 2004)3226–3228.
[16]I.W.Lenggoro,Y.Itoh,N.Iida,
K.Okuyama,Materials Research Bulletin.38(2003) 1819–1827.
[17] Y.D. Wang, C.L.Ma, X.D. Sun, H.D. Li,
Inorganic Chemistry
Communications.5(2002)751–755.
[18] C.B.Wang, G.Y.Gau, S.J.Gau, C.W.Tang, J.L. Bi, Catalysis Letters. 101(2005) 241-247.
[19] D. Tao, F.Wei,Materials
Letters.58(2004)3226–3228.
[20] Y.Wang, J.J. Ke, Materials Research Bulletin.31(1996)55–61.
[21] S.I.Cherrey, O.Tillement, J.M.Dubois, F.Massicot, Y.Fort, J.Ghanbaja, S.B.Colin, Materials Science and Engineering: A. l(2002)70– 75.
[22] P.Xubin, M.R.Iliana, M.Ray, L.Jingbo,Colloids and Surfaces B: Biointerfaces.77(2010)82–89.
[23] J .Tauc,Optical Properties of Solids. Academic Press Inc, New York(1966 ) 155 . [24]A.Sharma, Pallavi., S.Kumar., S.Dahiya , N.Budhiraja, Advances in Applied Science Research. 4(2013)124-130 .