Reverse Accessible in Local Outlier Factor Density Based
Recognition
N V S K Vijaya Lakshmi K
1& David Raju Kuppala
21
Assistant Professor, Dept of IT, Sir C R Reddy College Of Engineering, Eluru,Andhra Pradesh. 2
Assistant Professor, Dept of CSE, K L University,Vaddeswaram,Guntur, Andhra Pradesh.
Abstract: Recent data mining outlier to recognition data point the expected system to sufficient dataset or is significantly many data exhibits that as dimensionality increases there exists hubs and anti hubs the points that frequently occur in k nearest neighbor lists. Ant hubs are points that infrequently model in kNN lists. .This proposed system to developing and comparing to unsupervised outlier detection models This proposed method to details about the development and analysis of outlier detection methods is Local Outlier Factor (LOF), and Local Distance-Based Outlier Factor(LDOF) .Outliers improves the results of the previous systems to reference to speed, complexity and efficiency . The classification algorithms is used to finding the relevant features and classify in the criteria in data mining methods. These techniques suffer to increasing complexity, size and variety of data sets. The proposed incremental LOF algorithm takes equivalent finding performance as the iterated static LOF algorithm while requiring significantly less computational time. In addition, the incremental LOF algorithm is dynamically modify the data of data points. This is a very important application, change data profiles to change over time. Moreover, we have also given a broad comparison of the number of model the different outlier factors.
Index Terms: Clustering-based; Density-based and Model-based approaches; Nearest Neighbour; Outlier Detection; Discrimination; Outliers; data mining; Clustering; Neural Network.
1. INTRODUCTION
Outlier detection or anomaly detection means detecting data patterns that do not conform or distant from other observations.[5] Outliers can have many anomalous causes. To normal behavior Outliers arise due to changes in system behavior, fraudulent behavior, human error, instrument error
or simply through natural deviations in
populations. Outliers may contain critical and
actionable information in fraud detection,
intrusion detection and medical diagnosis. Data Mining is a non-trivial method of identifying valid, novel, potentially useful and finally understandable patterns [1]. Now, data mining is becoming an important tool to convert the data
into information. It is basically used in fraud detection, marketing and scientific discovery. Data mining actually refers to extracting the hidden interesting patterns from the large amount of datasets and databases [2]. Mining is basically used to uncover the patterns of the data, but this can be carried out on the sample of data. The mining process will be completely failed if the samples are not the good representation of the large body of the data. Automated identification of suspicious behavior and objects [3] based on information extracted from video streams is currently an active research area. Other potential
applications include traffic control and
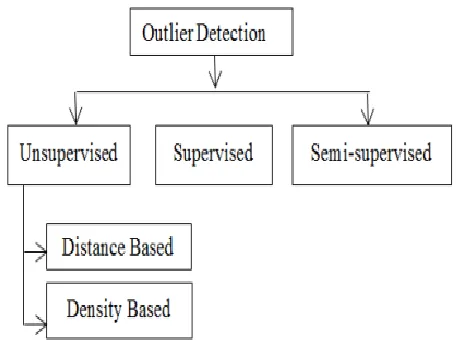
buildings. These tasks are characterized by the need for real time processing and by dynamic, non-stationary and often noisy environment. Hence, there is necessity for incremental outlier detection that can adapt to novel behavior and provide timely identification of unusual events.[4] The errand of distinguishing anomalies can be classified as administered, semi-regulated, and unsupervised, contingent upon the presence of marks for exceptions and/or general occurrences. Regulated anomaly discovery procedures have an unequivocal thought of the typical and exception conduct and thus precise models can be assembled. The downside here is that precisely marked preparing. Among these categories, unsupervised methods are more widely applied, because the other categories require accurate and representative labels that are often prohibitively expensive to obtain.[5] Unsupervised methods include distance-based methods that mainly rely on a measure of distance or similarity in order to detect outliers. Formulation of outlier detection depends upon the various factors such as input data type and distribution, availability of data and resource constraints introduced by application domain. Detecting unexpected entries in databases which ultimately detect errors for data mining, frauds or valid but unexpected entries,[6] Due to so many applications precise detection of outliers becomes must. Many outlier detection methods are suggested till date. We will categorize and review some of the existing methods in the following sections. The overview of the techniques which will be discussed is given in the figure below:
Fig 1: Modes of operation of outlier detection techniques
2. Related Work
The classification and recognition of individual
characteristics and behaviors constitute a
quickly say hubness in the setting of chart development for semi-directed learning. Also, there have been endeavors to dodge the impact of center points in 1-NN time-arrangement order, obviously without clear mindfulness about the presence of the wonder (Islam et al., 2008), and to represent conceivable skewness of the circulation of N1 in converse [8] nearest neighbor look where Nk(x) indicates the quantity of times point x happens among the k closest neighbors of every other point in the Data set. None of the said papers, be that as it may, effectively break down the reasons for hubness or sum it up to different applications. Initially proposed outlier detection algorithms determine outliers once all the data records (samples) are present in the dataset. We refer to these algorithms as static outlier detection algorithms. In contrast, incremental outlier detection techniques identify outliers as soon as new data record appears in the dataset. Incremental outlier detection was also used within more general framework of activity monitoring
[18]. In addition, [19] proposed broad
requirements that incremental algorithms need to meet, [21] used on-line discounting distributional learning of Gaussian mixture model and scoring based on the estimated probability density function. In [8] propose a outlier ranking based on the objects deviation in a set of relevant subspace
projections. It do not include irrelevant
projections showing no clear difference between outliers and the relevant objects and find objects which deviates in multiple relevant subspaces. The study in [9] distinguishes three problems occurred by the “curse of dimensionality” in the context of data mining, searching and indexing applications like poor inequity of distances caused by concentration, presence of irrelevant and redundant attributes, all of which make difficult
the usability of traditional similarity and distance
measures. Parameter-free outlier detection
algorithm [10] to compute Ordered Distance Difference Outlier Factor Formulate a new outlier score for each instance by considering the difference of ordered distances. Then use this value to compute an outlier score.
3. Density Based approaches
Distance-based approaches are known to face the local density problem created by the various degrees of cluster density that exist in a dataset. In order to solve the problem, density-based approaches have been proposed. The basic idea of density-based approaches is that the density around an outlier remarkably varies from that around its neighbors [14]. The density of an object‟s neighborhood is corelated with that of its neighbor‟s neighborhood. If there is a significant difference between the densities, the object can be considered as an outlier. To implement this idea,[11] several outlier detection methods have been developed recently. The detection methods estimate the density around an object in different ways. [15] developed the local outlier factor (LOF), which is amongst the most commonly a used method in outlier detection. LOF is influenced by variations like local correlation integral (LOCI)[16],Local distance based outlier
factor(LDOF) [17], and local outlier
probabilities(LoOP)[18]. Now we will review some density based outlier detection techniques. Many outlier methods are proposed till date; these existing methods can be broadly classified as: distribution (statistical)-based, clustering-based, density based and model-based approaches [13]. Statistical approaches [12] assume that the data
follows some standard or predetermined
distributions. The methods in this category always assume the typical example follow a particular data distribution. Nevertheless, we cannot always have this kind of priori data distribution information in practice, mainly for high dimensional real data sets [13].
Fig -2: Classification of Outlier Detection
A. NEURAL NETWORK METHODS:
Neural Network approaches are usually non parametric and model based and suits well to the hidden pattern and are capable of learning large complex class boundaries .The entire data set has to be traversed various times to allow the network to settle and model the data correctly .Neural Networks are comparatively less susceptible to the curse of Dimensionality as compared to the statistical methods; the neural networks are further of two types – Supervised Neural Methods
and Unsupervised Neural
Methods[16].Supervised Neural Networks use the classification of the data to drive the learning process. If this classification of the data is unavailable, then it is known as unsupervised neural network .Unsupervised neural networks contain nodes which compete to represent portions of the data set. As with Perceptron-based
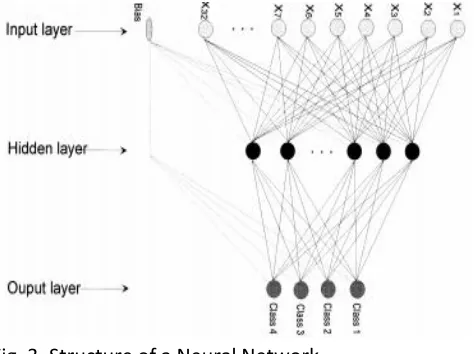
neural networks, decision trees or k-means, they require a training dataset to allow the network to learn. They autonomously cluster the input vectors through node placement to allow the underlying data distribution to be modeled and the normal/abnormal classes differentiated [18]. They assume that related vectors have common feature values and rely on identifying these features and their values to topologically model the data distribution. The neural network uses the class to adjust the weights and thresholds to ensure the network that can correctly classify the whole network. These methods are also used to detect the noise and novel data [19]. Neural Network is a very crucial methodology that plays an important role in the outlier detection.
Fig. 3. Structure of a Neural Network
4. METHODOLOGY OF OUTLIER
DETECTION ALGORITHMS
A. Local outlier factor (LOF:
In LOF, compare the local density of a
instances with the densities of its
neighborhood instances and then assign anomaly score to given data instance. For any data instance to be normal not as an outlier, LOF score equal to ratio of average local density of k nearest neighbor of instance and local density of data instance itself. To find local density for data instance, find radius of small hyper sphere centered at the data instance. The local density for instances is computed by dividing volume of k,i.e k nearest neighbor and volume of hyper sphere. In this assign a degree to each object to being an outlier known as local outlier factor. Depends on the degree it determines how the object is isolated with respect to surrounding neighborhood.[20] The instances lying in dense region are normal instances, if their local density is similar to their neighbors, the instances are outlier if there local density lower than its nearest neighbor.LOF is more reliable with top-n manner. Hence it is called as top-n LOF means instances with highest LOF values consider as outliers.
B. Local distance based outlier
factor(LDOF):
Fig.4. Proposed System Architecture
5. NOVAL BOUNDARY BASED
CLASSIFICATION APPROACH
(NBBC)
The proposed Novel Boundary based
Classification including the imputation
methods and ordinal classification methods are explained in this section. The detailed description of WDBC dataset as follows. WDBC dataset: The Wisconsin Diagnostic Breast Cancer (WDBC) contains various attributes namely, diagnosis, ID number and real valued features. There are ten real valued features namely, radius, area, perimeter, smoothness, texture, compactness, concave points, concavity, symmetry and fractal dimension computed from digitized image of breast mass.[8] For each class, an added classification representation is built or trained by first deriving data set, which is a separation of the innovative training data set. The new
data set was derived by relating a subset of the original data records into two new classes
A. The Greedy Algorithm
scan and added to the set of outliers(step 05-13) In this algorithm, the key step is computing the changed value of entropy. With the use of hashing technique, I o(1) expected time ,we can determine
the frequency of an attribute value in
corresponding hash table. Hence, we can determine the decreased entropy value in o(m) expected time since the changed values is only dependent on the attribute values of the record to be temporally removed.[17]
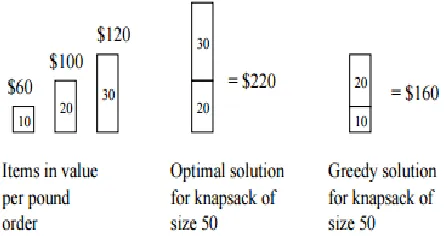
One of the simplest methods for showing that a greedy algorithm is correct is to use a “greedy stays ahead” argument. This style of proof works by showing that, according to some measure, the greedy algorithm always is at least as far ahead as the optimal solution during each iteration of the algorithm. Once you have established this, you can then use this fact to show that the greedy algorithm must be optimal.
Fig No 5 Greedy Algorithm Example
For the comparable fractional problem, however, the greedy strategy, which takes item 1 first, does yield an optimal solution. Taking item 1 doesn't work in the 0-1 problem because the thief is unable to fill his knapsack to capacity, and the empty space lowers the effective value per pound of his load. In the 0-1 problem, when we consider an item for inclusion in the knapsack, we must compare the solution to the sub problem in which the item is included with the solution to the sub
problem in which the item is excluded before we can make the choice. The problem formulated in this way gives rise to many overlapping sub problems--a hallmark of dynamic programming, and indeed, dynamic programming
6. EXPERIMENTAL SETUP AND
RESULTS
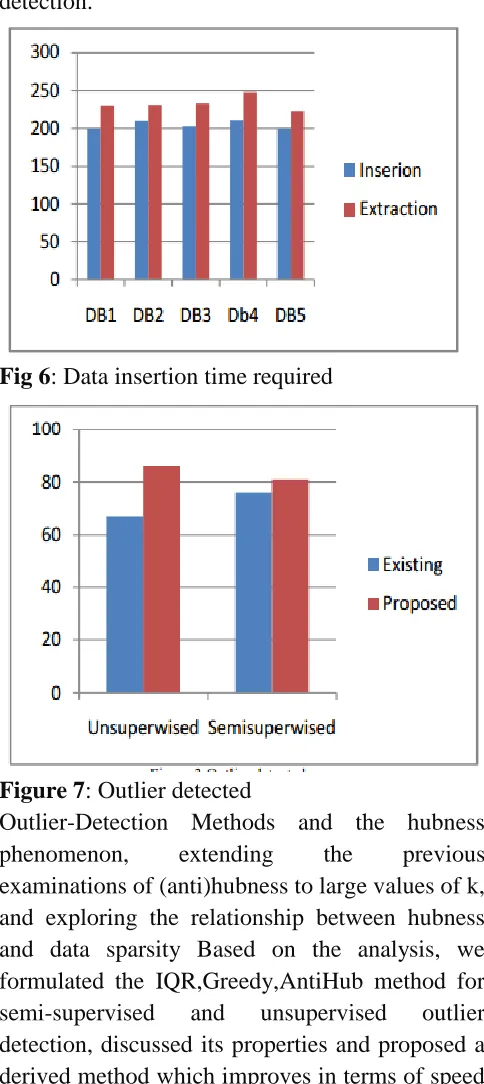
required in five datasets and figure 3 shows the comparative study of outlier detection rate with existing and proposed algorithms for outlier detection.
Fig 6: Data insertion time required
Figure 7: Outlier detected
Outlier-Detection Methods and the hubness
phenomenon, extending the previous
examinations of (anti)hubness to large values of k, and exploring the relationship between hubness and data sparsity Based on the analysis, we formulated the IQR,Greedy,AntiHub method for
semi-supervised and unsupervised outlier
detection, discussed its properties and proposed a derived method which improves in terms of speed and accuracy, reducing the false positive and false
negative rate and improve the efficiency of density based outlier detection.
7. CONCLUSIONS
Outlier detection is very important and has applications in wide variety of fields. So it becomes important to learn how to detect outliers. The main objective of this paper is to review various outlier detection techniques and to study how the techniques are categorized. So we can conclude that, methods used for outlier detection are application specific. The training algorithm and testing algorithm are used for training and testing the class. Reducing the search close to the class boundaries saves computation time in identifying such nuggets. Results from the evaluation on the real-time WDBC data sets revealed that the proposed approach achieves better performance than the existing classification algorithm. Proposed a derived method which improves in terms of speed and accuracy, reducing the false positive and false negative rate and improve the efficiency of density based outlier detection The future implementation is in machine learning techniques such as supervised and semi-supervised methods.
8. FUTURE WORK
Future work on deleting data records from database is needed. More specifically, it would be
interesting to design an algorithm with
9. REFERENCES
[1] Jun Wang. A Knowledge Network
Constructed by Integrating Classification,
Thesaurus, and Metadata in Digital Library. Intl. Inform. & Libr. Rev. Vol35 Issue 3. 2003, pp383- 397.
[2] K. Ord. Outliers in statistical data: V. barnett and t. lewis, 1994, 3rd edition, (john wiley & sons, chichester), 584 pp., [uk pound]55.00, isbn
0-471- 93094-6. International Journal of
Forecasting, 12(1):175-176, 1996.
[3] S. Chawla, D. Hand, and V. Dhar. Outlier detection special issue. Data Min. Knowl.Discov., 20(2):189-190, 2010.
[4] Nilam Upasania, Hari Omb, “Evolving fuzzy min-max neural network for outlier detection” in
International Conference on Advanced
Computing Technologies and Applications
(ICACTA-2015) Elsevier
[5] N., Zadrozny, B., and Langford, J. 2006.
Outlier detection by active learning. In
Proceedings of the 12th ACM SIGKDD
International Conference on Knowledge
Discovery and Data Mining. ACM Press, New York, NY, USA, 504–509.
[6] V. Chandola, A. Banerjee, V. Kumar, Anomaly detection: a survey, ACM Comput.41 (2009)15.
[7] Milos Radovanovic, Alexandros Nanopoulos and Mirjana Ivanovic, 2014. “Reverse Nearest Neighbors in Unsupervised Distance Based Outlier Detection” IEEE Transactions on Knowledge and Data Engineering,
[8] Karanjit Singh and Dr.Shuchita Upadhyaya 2012. “Outlier Detection: Applications and Techniques” IJCSI International Journal of Computer Science Issues, Vol. 9, Issue 1, No 3, January.
[9] Dasgupta, D. and Majumdar, N. 2002 ”Outlier detection in multidimensional data using negative selection algorithm” In Proceedings of
the IEEE Conference on Evolutionary
Computation. Hawaii, 1039 - 1044.
[10] K.S.Beyer,J.Goldstein,R.Ramakrishnan and U. Shaft, 1999 “When is “nearest neighbor” meaningful?” in Proc 7th Int Conf on Database Theory (ICDT), pp. 217–235.
[11] V. Chandola, A. Banerjee, and V. Kumar, “Anomaly detection: A survey,” ACM Comput Surv, vol. 41, no. 3, p. 15, 2009.
[12] M. M. Breunig, H.-P. Kriegel, R. T. Ng, and J. Sander, “LOF: Identifying density-based local outliers,” SIGMOD Rec, vol. 29, no. 2, pp. 93– 104, 2000.
[13] K. Zhang, M. Hutter, and H. Jin, “A new local distance-based outlier detection approach for scattered real-world data,” in Proc 13th Pacific-Asia Conf on Knowledge Discovery and Data Mining (PAKDD), pp. 813–822. 2009.
[15] C. Lijun, L. Xiyin, Z. Tiejun, Z. Zhongping, and L. Aiyong, “A data stream outlier delection algorithm based on reverse k nearest neighborspp. 236–239, 2010.
[16] Shu-Ching Chen, Mei-Ling Shyu, Chengcui Zhang, Rangasami L. Kashyap: Video Scene Change Detection Method Using Unsupervised Segmentation And Object Tracking. Proc. ICME 2001
[17] Y. Tao, D. Papadias, X. Lian, Reverse kNN search in arbitrary dimensionality, In Proceedings of the 30th International Conference on Very Large Data Bases, Toronto, Canada, September 2004.
[18] Amit Singh, Hakan Ferhatosmanoglu, Ali Tosun, High Dimensional Reverse Nearest Neighbor Queries, In Proceedings of the ACM International Conference on Information and
Knowledge Management (CIKM'03), New
Orleans, LA, November 2003
[19]. Barnett, V. and Lewis, T.: 1994, Outliers in Statistical Data. John Wiley & Sons.3rd edition.
[20]. Huber, P. 1974. Robust Statistics.Wiley, New York.
[21] Grubbs, F. E.: 1969, „Procedures for
detecting outlying observations in
samples‟Technometrics11, Authors Profile:
N V S K Vijaya Lakshmi K is Working As a Assistant Professor in Dept Of IT, Sir C R Reddy College Of Engineering, Eluru,Andhra Pradesh.She Is Having 5 Years
Teaching Experience.