Organized by C.O.E.T, Akola. Available Online at www.ijpret.com
22
INTERNATIONAL JOURNAL OF PURE AND
APPLIED RESEARCH IN ENGINEERING AND
TECHNOLOGY
A PATH FOR HORIZING YOUR INNOVATIVE WORK
‘‘TRAFFIC SIGNAL DESIGN AT GRADE INTERSECTION’’ (NASIK CITY) STUDY
AREA: CANADA CORNER-CHATRAPATI CHWOK-WAVRE CHWOK
PROF. PRADNYA K. JAMDADE
Pravara Rural Engineering College, Loni (Ahmednagar)
Accepted Date: 05/09/2017; Published Date: 10/10/2017
Abstract:
Cities are the engines of economic growth. Transportation infrastructure plays a vital role for the development of cities. This also backbone of the city & nation. The unprecedented growth of population coupled with level of urbanization causes for the increase in number & size of cities. The major concentration of population & vehicles in million cities aggravates the problems in study in the study area. As a part of development of nation there is development in all sectors such as infrastructure, commercial, & agriculture etc. but one of the major development is in our transportation system. Due to increase in high income group public can offered more no of vehicles causing tremendous vehicle load on the road network forming intersection at many point causing conflict movement of vehicles at such a point. For that purpose we have conducted volume count survey & tried to design traffic signal at intersection mentioned above. From this study we have calculated cycle time, red period, green period, yellow period & camber period for each intersection on the basis of vehicular volume count at each intersection mentioned above. These traffic signals will definitely assist vehicle load for orderly movement.Keywords:
Signal, Intersection, Volume count survey, Phase design, cycle time.Corresponding Author: PROF. PRADNYA K. JAMDADE
Co Author: -
Access Online On:
www.ijpret.com
How to Cite This Article:
Pradnya K. Jamdade, IJPRET, 2017; Volume 6 (2): 22-32
PAPER-QR CODE
SPECIAL ISSUE FOR
INTERNATIONAL LEVEL CONFERENCE
"ADVANCES IN SCIENCE,
Organized by C.O.E.T, Akola. Available Online at www.ijpret.com
23
INTRODUCTION
Urbanization can be defined as a concentration of people in a geographic area who can support themselves from the city’s economic activities on a fairly permanent basis. The city can be center of industry, exchange, education, government, religious activity, tourism, or involve all these activities. These diverse areas of opportunity attract people from rural area/smaller towns/other cities to the cities where the opportunities’ and life style quality match their aspirations. Urban areas have many obvious faults insofar as their services to people are concerned. They can be overcrowded, contain large amounts of substandard housing, be polluted (air, noise, environmental), be centers of unemployment, and have vested interest groups. Taxation tends to be high and services less than adequate. However, with all of these faults, urban areas are here to stay. The charge to planners, at all levels, public and private, is to find ways of making these essential elements in our social system work better, more efficiently and thus make our cities better places to live in.
Traffic Signals are one of the more familiar types of intersection control. Using either a fixed or adaptive schedule, traffic signals allow certain parts of the intersection to move while forcing other parts to wait, delivering instructions to drivers through a set of colorful lights (generally, of the standard red-yellow (amber)-green format). Some purposes of traffic signals are to (1) improve overall safety, (2) decrease average travel time through an intersection, and (3) equalize the quality of services for all or most traffic streams. Traffic signals provide orderly movement of intersection traffic, have the ability to be flexible for changes in traffic flow, and can assign priority treatment to certain movements or vehicles, such as emergency services. However, they may increase delay during the off-peak period and increase the probability of certain accidents, such as rear-end collisions. Additionally, when improperly configured, driver irritation can become an issue.
At intersection where there are a large number of crossings and right turn traffic, there is possibility of several accidents as there cannot be orderly movement. The earlier practice has been to control the traffic by means of traffic police by showing stop signs alternately at the cross roads so that one of the traffic streams may be allowed to move while the cross traffic is stopped. Thus the crossing streams of traffic flow are separated by time, segregation. Traffic signals are control devices which could alternately direct the traffic to stop and proceed at intersection using red and green traffic light signals automatically. The main requirement of traffic signals are to draw attention, provide meaning and time respond and to have minimum waste of time.
II. DETAILS AND DESIGN OF INTERSECTION
We have selected the major arterial route of Nasik city with three intersection one after another. There were tremendous flow of the vehicles on the road causing conflicts & congestion at the three inter sections Canada corner, Wavare chowk, Chhatrapati chowk. Vehicles were have to wait to pass over the intersection. There were some cases of accidents also reported. Local public give an idea about the daily load on the roads & troubles cause to the road user due to laciness of efficient signaling. Signals were seen to be not working. Thus we have tried to design the intersections by determining the cycle length time, green time, red time, and amber time of each intersection’s traffic signals by collecting traffic volume count data at each intersections at following points: 1. Canada Corner 2.Chatrapati chowk 3. Wavare chowk
Organized by C.O.E.T, Akola. Available Online at www.ijpret.com
24
1. Volume count survey:
The most important point measurement is the vehicle volume count. Data can be collected manually or automatically. In manual method, the observer will stand at the point of interest and count the vehicles with the help of hand tallies. Normally, data will be collected for short interval of 5 minutes or 15 minutes etc. and for each types of vehicles like cars, two wheelers, three wheelers, LCV, HCV, multi axle trucks, non-motorized traffic like bullock cart, hand cart etc.
Modern methods include the use of inductive loop detector, video camera, and many other technologies. These methods helps to collect accurate information for long duration. In video cameras, data is collected from the field and is then analyzed in the lab for obtaining results. Radars and microwave detectors are used to obtain the speed of a vehicle at a point.
We have adopted manual method for our survey. One of the fundamental measures of traffic on a road system is the volume of traffic using the road in a given interval of time.it is also term as flow and it is express in vehicles per hour or vehicles per day. When the traffic is composed of number of types of vehicles, it is the normal practice to convert the flow into equivalent passenger car unit (PCU’S), by using certain equivalency factors. The flow is expressed as PCU/hr. or PCU/day.
2 PHASE DESIGN:
The objective of phase design is to separate the conflicting movements in an intersection into various phases, so that movements in a phase should have no conflicts. If all the movements are to be separated with no conflicts, then a large number of phases are required. In such a situation, the objective is to design phases with minimum conflicts or with less severe conflicts. There are five phase signals, six phase signals etc. They are normally provided if the intersection control is adaptive, that is, the signal phases and timing adapt to the real time traffic conditions
3 DESIGN STEPS FOR INTERSECTIONS:
The signal design procedure involves six major steps which are as follows,
(1) Determining phases of intersections
(2) Pedestrian crossing requirements (pedestrian clearance interval)
(3) Determining and applying the corrections for left and right turning vehicles
(4) Determination of amber time, clearance time and lost time
(5) Determination of cycle length
(6) Apportioning of green time, Red time.
III. RESULT AND DISCUSSION
1 Volume count data at Canada Corner:
Organized by C.O.E.T, Akola. Available Online at www.ijpret.com
25
From To Two wheeler Auto rickshaw Mini-Bus LCV Bus Truck Car/Jeep/Van Cycle Pedestrian Total
Left(W) 54 30 9 11 8 2 28 25 41 208
N Straight(S) 65 43 18 5 6 4 29 31 54 255
Right(E) 53 35 13 7 7 6 26 28 33 208
Total vh/hr 172 108 40 23 21 12 83 84 128 671
Pcu Factor 0.5 1 1.5 0.75 3 3 1 0.5
Total PCU 86 108 60 17.25 63 36 83 42 495.25
Figure 1: Percentage wise turning movement
Table 2: Vehicular movement in veh/hr.:
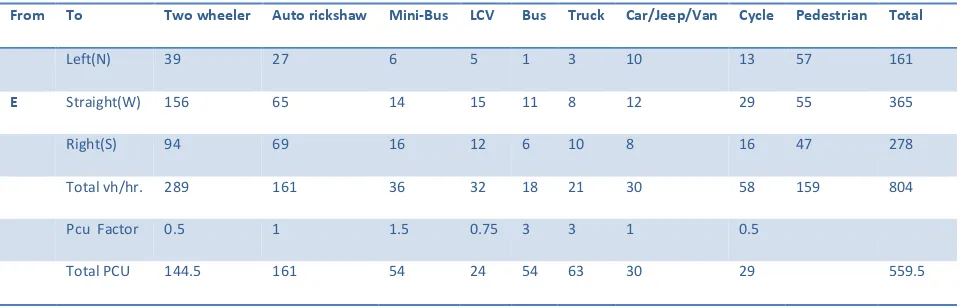
From To Two wheeler Auto rickshaw Mini-Bus LCV Bus Truck Car/Jeep/Van Cycle Pedestrian Total
Left(N) 39 27 6 5 1 3 10 13 57 161
E Straight(W) 156 65 14 15 11 8 12 29 55 365
Right(S) 94 69 16 12 6 10 8 16 47 278
Total vh/hr. 289 161 36 32 18 21 30 58 159 804
Pcu Factor 0.5 1 1.5 0.75 3 3 1 0.5
Organized by C.O.E.T, Akola. Available Online at www.ijpret.com
26
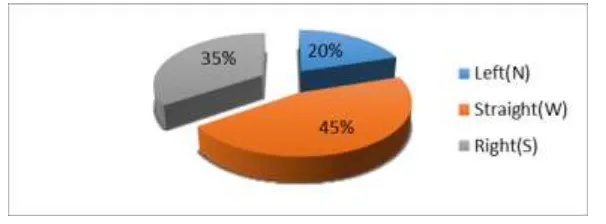
Figure 2: Percentage wise turning movement
Table 3: Vehicular movement in veh/hr.:
From To Two wheeler Auto rickshaw Mini-Bus LCV Bus Truck Car/Jeep/Van Cycle Pedestrian Total
Left(E) 52 49 3 7 5 5 11 6 21 159
S Straight(N) 55 45 7 4 2 2 8 8 40 171
Right(W) 69 52 13 14 7 8 12 7 19 201
Total vh/hr. 176 146 23 25 14 15 31 21 80 531
PCU Factor 0.5 1 1.5 0.75 3 3 1 0.5
Total PCU 88 146 34.5 18.75 42 45 31 10.5 415.75
Figure 3: Percentage wise turning movement
Table 4: Vehicular movement in veh/hr.:
From To Two wheeler Auto rickshaw Mini-Bus LCV Bus Truck Car/Jeep/Van Cycle Pedestrian Total
Left(S) 95 45 12 7 7 7 9 36 57 275
W Straight(E) 89 41 12 11 11 11 9 40 43 267
Organized by C.O.E.T, Akola. Available Online at www.ijpret.com
27
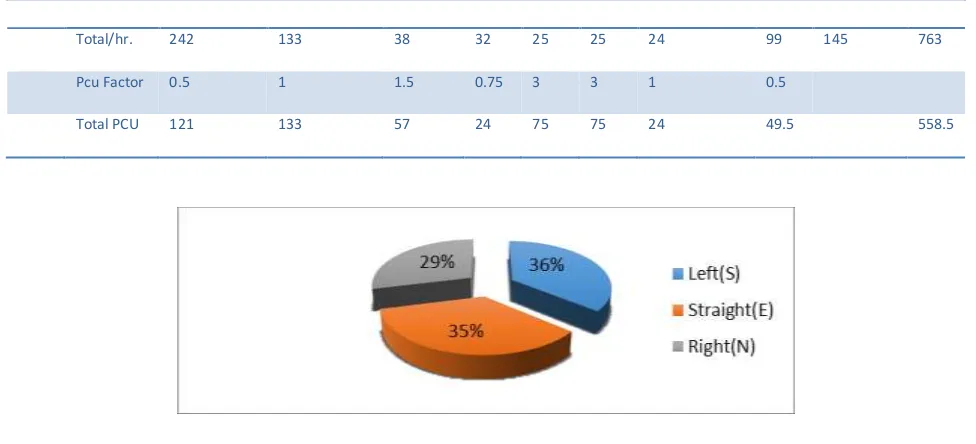
Total/hr. 242 133 38 32 25 25 24 99 145 763
Pcu Factor 0.5 1 1.5 0.75 3 3 1 0.5
Total PCU 121 133 57 24 75 75 24 49.5 558.5
Figure 4: Percentage wise turning movement
2. Volume count data at Chatrapati Chowk:
Table 5: Vehicular movement in veh/hr.:
From To Two wheeler Auto rickshaw Mini-Bus LCV Bus Truck Car/Jeep/Van Cycle Pedestrian Total
Left(W) 104 50 7 7 0 2 71 46 78 365
N Straight(S) 174 114 11 17 12 13 80 25 71 517
Right(E) 101 115 5 10 0 6 75 50 50 412
Total vh/hr. 379 279 23 34 12 21 226 121 199 1294
Pcu Factor 0.5 1 1.5 0.75 3 3 1 0.5
Total PCU 189.5 279 34.5 25.5 36 63 226 60.5 914
Organized by C.O.E.T, Akola. Available Online at www.ijpret.com
28
Table 6: Vehicular movement in veh/hr.:
Figure 6: Percentage wise turning movement
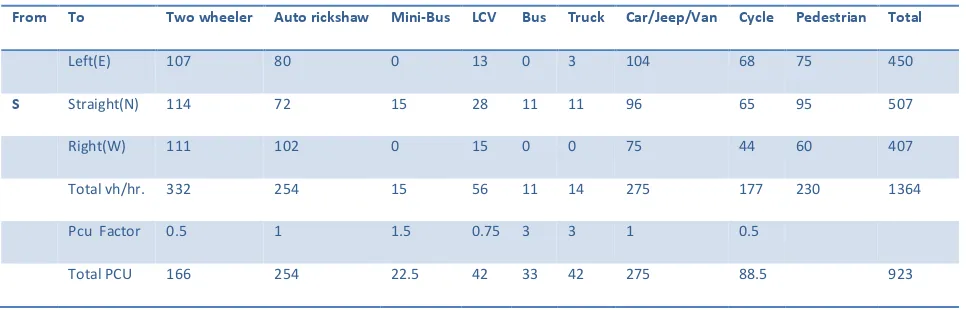
Table 7: Vehicular movement in veh/hr.:
From To Two wheeler Auto rickshaw Mini-Bus LCV Bus Truck Car/Jeep/Van Cycle Pedestrian Total
Left(E) 107 80 0 13 0 3 104 68 75 450
S Straight(N) 114 72 15 28 11 11 96 65 95 507
Right(W) 111 102 0 15 0 0 75 44 60 407
Total vh/hr. 332 254 15 56 11 14 275 177 230 1364
Pcu Factor 0.5 1 1.5 0.75 3 3 1 0.5
Total PCU 166 254 22.5 42 33 42 275 88.5 923
From To Two wheeler Auto rickshaw Mini-Bus LCV Bus Truck Car/Jeep/Van Cycle Pedestrian Total
Left(N) 119 98 0 9 1 1 74 62 105 469
E Straight(W) 67 52 2 12 3 5 84 57 92 374
Right(S) 98 56 16 23 7 5 76 67 88 436
Total vh/hr. 284 206 18 44 11 11 234 186 285 1279
Pcu Factor 0.5 1 1.5 0.75 3 3 1 0.5
Organized by C.O.E.T, Akola. Available Online at www.ijpret.com
29
Table 8: Vehicular movement in veh/hr.:
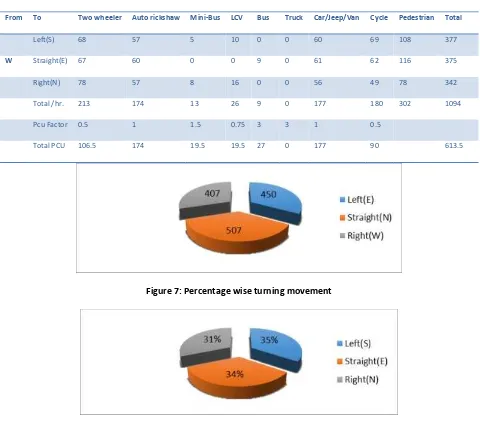
Figure 7: Percentage wise turning movement
Figure 8: Percentage wise turning movement
3. Volume count data at Wavare Chowk:
Table 9: Vehicular movement in veh/hr.:
From To Two wheeler Auto rickshaw Mini-Bus LCV Bus Truck Car/Jeep/Van Cycle Pedestrian Total
Left(W) 92 73 7 7 14 9 80 15 44 341
N Straight(S) 91 92 11 9 6 6 74 14 38 341
Right(E) 96 69 10 6 10 7 60 15 42 315
From To Two wheeler Auto rickshaw Mini-Bus LCV Bus Truck Car/Jeep/Van Cycle Pedestrian Total
Left(S) 68 57 5 10 0 0 60 69 108 377
W Straight(E) 67 60 0 0 9 0 61 62 116 375
Right(N) 78 57 8 16 0 0 56 49 78 342
Total /hr. 213 174 13 26 9 0 177 180 302 1094
Pcu Factor 0.5 1 1.5 0.75 3 3 1 0.5
Organized by C.O.E.T, Akola. Available Online at www.ijpret.com
30
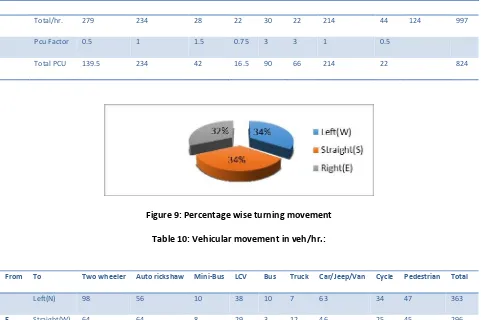
Total/hr. 279 234 28 22 30 22 214 44 124 997
Pcu Factor 0.5 1 1.5 0.75 3 3 1 0.5
Total PCU 139.5 234 42 16.5 90 66 214 22 824
Figure 9: Percentage wise turning movement
Table 10: Vehicular movement in veh/hr.:
Figure 10: Percentage wise turning movement
From To Two wheeler Auto rickshaw Mini-Bus LCV Bus Truck Car/Jeep/Van Cycle Pedestrian Total
Left(N) 98 56 10 38 10 7 63 34 47 363
E Straight(W) 64 64 8 29 3 12 46 25 45 296
Right(S) 64 59 14 34 6 9 56 33 36 311
Total vh/hr. 226 179 32 101 19 28 165 92 128 970
Pcu Factor 0.5 1 1.5 0.75 3 3 1 0.5
Organized by C.O.E.T, Akola. Available Online at www.ijpret.com
31
Table 11: Vehicular movement in veh/hr.:
From To Two wheeler Auto rickshaw Mini-Bus LCV Bus Truck Car/Jeep/Van cycle Pedestrian Total
Left(E) 108 84 4 7 9 6 54 30 32 334
S Straight(N) 104 111 6 11 12 6 75 32 47 404
Right(W) 96 105 5 5 2 10 68 33 69 393
Total vh/hr. 308 300 15 23 23 22 197 95 148 1131
Pcu Factor 0.5 1 1.5 0.75 3 3 1 0.5
Total PCU 154 300 22.5 17.25 69 66 197 47.5 873.25
Figure 11: Percentage wise turning movement
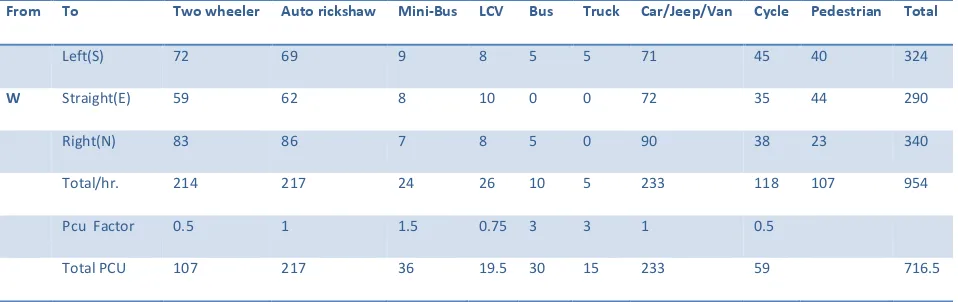
Table 12: Vehicular movement in veh/hr.:
From To Two wheeler Auto rickshaw Mini-Bus LCV Bus Truck Car/Jeep/Van Cycle Pedestrian Total
Left(S) 72 69 9 8 5 5 71 45 40 324
W Straight(E) 59 62 8 10 0 0 72 35 44 290
Right(N) 83 86 7 8 5 0 90 38 23 340
Total/hr. 214 217 24 26 10 5 233 118 107 954
Pcu Factor 0.5 1 1.5 0.75 3 3 1 0.5
Organized by C.O.E.T, Akola. Available Online at www.ijpret.com
32
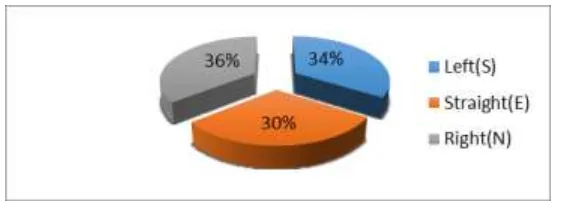
Figure 12: Percentage wise turning movement
IV. CONCLUSION
1. Design of traffic signal will help in advancing transportation network to provide ease & safety to the using it.
2. They will provide easy & efficient control over the movement of vehicles at intersections.
3. It will lead to minimum time delay resulting in saving in fuel & hence the cost of travelling will minimize achieving economy. Also there will be less pollution as vehicles have to wait for no such longer time than before.
4. Traffic signals will also reduce the conflict points at intersections will minimize the accident. Thus resulting in overall efficiency & economy will assist the road user for better experienced.
REFERENCES
1. Design and simulation analysis of at-grade intersection channelization of city roads. Yancang Li, Lei Zhao, Huimin Dong
2. Guidelines for the design of at grade intersections in rural and urban areas.
3. Guidelines on design and installations of road traffic signals.(IRC 1996)
4. International Journal of Scientific Research Engineering & Technology “Performance evaluation of at grade intersections and improvement using signal coordination”(2014)