Scalable Computing: Practice and Experience
Volume 16, Number 1, pp. 71–84. http://www.scpe.org
ISSN 1895-1767 c
⃝2015 SCPE
PERFORMANCE COMPARISON AND TUNING OF VIRTUAL MACHINES FOR SEQUENCE ALIGNMENT SOFTWARE
ZACHARY J. ESTRADA, FEI DENG, ZACHARY STEPHENS, CUONG PHAM, ZBIGNIEW KALBARCZYK, AND RAVISHANKAR K. IYER∗
Abstract. We explore the performance cost of virtualisation for the fast growing application domain of genomics. Traditionally, scientific applications have been considered too high-performance to pay the performance cost of virtualisation. However, as the demand for computing power for genomics is ever-increasing, the cloud can become an attractive way to meet the scaling challenge presented by Next-Generation Sequencing (NGS). We seek to explore the feasibility of running an NGS pipeline in a cloud, and in doing so consider two prevalent short-read sequence alignment programs, BWA and Novoalign. We executed those applications in three separate open-source system virtualisation solutions: the KVM hypervisor, the Xen para-virtualised hypervisor, and Linux Containers. We compare the runtime in each environment against the runtime of the same system without virtualisation and measure the relative performance of each hypervisor. We investigate and reduce as much as possible any overhead, presenting tuning suggestions for cloud implementers and users. Overall, we find that the overhead introduced by virtualisation can be reduced to low single-digit percentages, a cost we believe to be more than acceptable, especially given that two of the three solutions, Xen and Containers, exhibit near-zero overhead.
Key words: Sequence alignment, virtual machines, performance
AMS subject classifications. 68M14, 92D20, 68M20
1. Introduction. The booming throughput of Next-Generation Sequencing (NGS) platforms imposes a progressively larger burden on genomics computing infrastructures as that throughput can cause genomic data to be generated faster than they can be consumed. For smaller sequencing facilities without a dedicated IT staff, that growing requirement for data centre resources may move beyond the skill set of non-IT professionals. In such cases, the effort of managing and processing information could inhibit researchers and clinicians from making innovations in their own fields of expertise. Even for larger institutions, unpredictable demand and high ownership costs can make the traditional enterprise IT model undesirable. Cloud computing is becom-ing a natural solution to the problem of expandbecom-ing computational needs, thanks to its low-cost, on-demand nature and offloaded management [27, 25, 6]. For the bioinformatician or clinician, cloud computing can offer a convenient, scalable alternative to traditional methods of managing computational resources. In particu-lar, Infrastructure-as-a-Service (IaaS) cloud resources offer users nearly complete control over their computing environment, allowing them to install an operating system of their choosing and run their applications natively. The key enabling technology for IaaS cloud computing is server virtualisation, in which one partitions a single computer’s resources into a set of virtual machines (VMs). The effort to virtualise systems has mainly been fuelled by growing enterprise IT environments, where the primary benefits of virtualisation (isolation, flexibility and density) help these environments scale more efficiently while consolidating costs. Cloud computing further exploits those benefits at a larger scale and uses virtualisation to abstract computing resources as a utility model.
The benefits of virtualisation do not come without cost. Fundamentally, some overhead is expected from having an additional layer between the hardware and software. There are many approaches to system virtu-alisation, including instruction emulation, para-virtualisation and hardware virtualisation (further details are included in Sect. 2), offering a range of management features and performance costs to applications. Further-more, those costs are affected by the configuration of each virtualisation technology, as well as the specific application being run. As will be demonstrated throughout this work, many aspects of a system’s configura-tion can impact virtualisaconfigura-tion performance overhead in subtle ways. Thus, understanding the trade-offs and differences between virtualisation technologies is important when one is deciding whether or not to move to the cloud, which cloud platform to choose, or how to manage a virtualised data centre.
In this paper, we investigate three of the most popular open-source system virtualisation technologies: Linux Kernel Virtual Machines (KVM) [15], Xen [3] and Linux Containers (LXC) [1]. While the kernel features that
∗Department of Electrical and Computer Engineering, University of Illinois at Urbana-Champaign, USA, ({zestrad2, feideng2,
zstephe2, pham9, kalbarcz, rkiyer}@illinois.edu)
enable LXC are not a Virtual Machine Manager (VMM) or hypervisor in the strictest sense, LXC is increasingly considered as a potential replacement for virtualisation, and for simplicity, we refer to all three technologies as VMMs. This article extends our previous work on measuring the performance of sequence alignment ap-plications in a virtualised environment [7]. In that work, we conducted synthetic benchmarks and measured the performance overhead of virtualisation for the Burrows-Wheeler Aligner (BWA) and Novoalign sequence aligners. We found that VM performance was not consistent across applications and that VMs could have up to 20% overhead for our sample workloads. In this work, we describe the results of performing the same measure-ments on an additional class of hardware (a workstation computer with a different generation processor) and move beyond default configurations to determine the source of the previously observed performance overhead. Additionally, we tuned the VMMs to achieve the minimum possible overhead for the applications studied. We found that after proper tuning and setup, the overhead for each VMM can be reduced to a nearly insignificant value, with Xen and LXC exhibiting near-zero overhead and KVM showing 4% overhead for BWA and 2% for Novoalign. The results were demonstrated to be relatively stable across both machine types considered.
2. Background.
2.1. Genomics Workloads. The most resource and time intensive step in many Next-Generation Se-quencing (NGS) pipelines is often the alignment step, where short reads are mapped to a reference sequence. In collaboration with a major genomics institution1
we have studied a production variant calling pipeline and observed that alignment can take roughly 30% of the total execution time of the entire workflow. Therefore, when one is looking to reduce costs or gain mobility by moving tasks to a cloud, it is important to consider the effect of doing so on this critical component. It can be expected that various alignment programs may utilise computing resources in a similar way, so we run two production-grade alignment packages to test this hypothesis and derive conclusions that we intend to be representative of alignment programs in general. One of the programs chosen is the Burrows-Wheeler Aligner [17] (BWA) and the other is Novoalign [2]. We chose BWA as it is a popular open-source package and Novoalign as it is widely considered by many in the genomics community to be the most accurate alignment program available [16].
2.2. Kernel-based Virtual Machines. Hardware assisted virtualisation (HAV) technologies provided by different CPU vendors (e.g. VT-x from Intel or SVM from AMD) add extensions to the x86 64 instruction set to readily support Virtual Machines. The Linux Kernel Virtual Machine (KVM) hypervisor utilises HAV and serves as a good example of a hardware-assisted virtualisation platform.
In addition to being a demonstrative example of a VMM built using HAV, KVM is a valuable use case as it is a natural choice for Linux VMs since it is included with the upstream Linux kernel. Furthermore, KVM is widely considered the de facto standard for the open-source Infrastructure-as-a-Service (IaaS) cloud management platform OpenStack2
and the virtualisation management platform libvirt.
2.3. Xen. Xen is considered a full Type I hypervisor, even the ‘host’ OS that has direct access to the hardware and manages the other VMs runs inside a special VM called ‘Domain 0.’ Xen helped popularise the concept of para-virtualisation, where a modified version of the operating system is run to avoid the unnecessary redundancy and overhead that comes with providing a full system (e.g., having to virtualise x86 instructions that are difficult to virtualise) to the guest OS [3].
Xen is an important use case because the most widely used public cloud IaaS platform, Amazon EC2, is built on top of a modified version of Xen. While the results presented here may not be representative of performance on EC2, Xen is still a popular hypervisor.
2.4. Linux Containers. Linux Containers (LXC) represent a different virtualisation paradigm that of-fers less isolation than the other two VMMs introduced, i.e. all containers share the same operating system kernel [26]. The advantage of sharing an OS kernel means that there is no device emulation and no duplicated effort of running an OS on top of another OS. This method is not virtualisation in the usual sense, but con-tainers can be used for many of the same reasons one would use virtual machines. The isolation provided by LXC is stronger than usual OS process isolation, thanks to the use ofcgroups[22] and kernel namespaces [14].
1
The institution wishes to remain anonymous
2
Kernel namespaces allow one to have separate domains for certain kernel objects (i.e. processes, users, network interfaces and mounts) and cgroupsallow one to allocate and partition resources amongst different processes. Container-based virtualisation is gaining popularity and acceptance, as evidenced by the successful open-source project Docker [12].
3. Methodology.
3.1. Performance Measurements in Virtual Machines. Since a virtual machine does not have com-plete control over the hardware, some care should be taken to ensure accurate measurements. One particular problem for performance measurements is unstable timekeeping inside VMs [4]. It is easy to see that since a VM time-shares with the host operating system, there will be more clock drift than expected for a physical server. This drift tends to be unpredictable as well because it is dependent on the state of a live system (e.g. how applications running on the hypervisor and other VMs use the system). As a simple example, consider a VMM implemented using Intel’s VT-x HAV: when a virtual machine attempts a certain action (e.g. execute a privileged instruction), it induces a VM Exit event. Control is then transferred to the hypervisor, which per-forms some task related to the action and returns control to the VM. During this switch, the VM is not running and a gap could be introduced in the VM’s virtual timestamp counter (TSC). While there are well established techniques for minimising this clock drift (e.g. a para-virtualised clock synchronised for KVM, kvm-clock), precise timing measurements in VMs are still difficult to obtain. For precise measurements, it is considered best practice to use a stable reference outside of the VM [20]. While the timing measurements used in this work are of a large enough scale for these effects to be considered insignificant, we use a 3rd party server to measure timestamps so that the same clock is used for all measurements. For higher resolution timing, one could use the hypervisor and a trapping mechanism (e.g. hypercall) as opposed to an external server.
3.2. Operating System Considerations. When benchmarking applications that use a large amount of input data from the disk, it is important to be mindful of how these machines cache this data. If one is using virtual machine images that are layered on top of an existing filesystem (as could be expected in a cloud environment utilising the KVM hypervisor), then both the VM operating system and host operating system could be caching data, depending on how the VMM is configured. Therefore, it is important to clear the buffer cache between all data samples to ensure that each experiment starts in a similar state (one could also reboot the machines to ensure a consistent state, but our experimentation has shown this to be excessive). In our experiments, virtual machines were restarted and the buffer cache was cleared before each sample.
Most modern multi-processor architectures have their memory arranged in a Non-Uniform Memory Access (NUMA) configuration. In a NUMA architecture, different processors/cores communicate with different regions of memory at different speeds, with fastest access to ‘local’ memory and slower access to ‘non-local’ memory. For optimal performance, it is clear that a process should only be scheduled to run on a CPU that has local access to the process’s memory. Most modern OS schedulers are aware of NUMA, but one can still direct the OS to only run a process on a certain set of CPUs by setting the process to have affinity for a set of CPUS or ‘pinning’ it to those CPUs (e.g. by using thetaskset command in Linux) [19]. Similarly, most VMMs offer the ability to pin vCPUs to certain physical CPUs. In this study, pinning of virtual machines’ vCPUs was considered in performance tuning to avoid negative effects from non-local memory accesses.
4. Experimental Set-up.
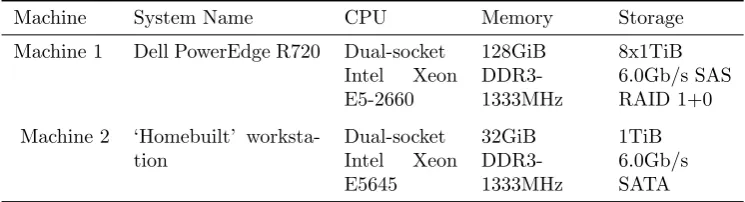
Table 4.1 Hardware specifications
Machine System Name CPU Memory Storage
Machine 1 Dell PowerEdge R720 Dual-socket Intel Xeon E5-2660
128GiB DDR3-1333MHz
8x1TiB 6.0Gb/s SAS RAID 1+0
Machine 2 ‘Homebuilt’ worksta-tion
Dual-socket Intel Xeon E5645
32GiB DDR3-1333MHz
1TiB 6.0Gb/s SATA
in a data centre or research cluster. The workstation has 32GiB of DDR3-1333Mhz memory with a single 1TiB ST1000DM003 6.0Gb/s SATA hard drive. Throughout this work, the Sandy Bridge Dell servers will be referred to as ‘Machine 1’ and the homebuilt Westmere workstation as ‘Machine 2.’ The hardware specifications of each machine are summarised in Table 1.
The host operating system used was Ubuntu 12.04 LTS (kernel version 3.5.0-45-generic). This platform was chosen as it is nearly ubiquitous in IaaS cloud environments and VM images containing this operating system are available by default from most, if not all, major IaaS public cloud providers.
4.2. Virtual Machine Configuration. The libvirt3
API and toolchain (e.g. thevirshutility) were used to manage VMs for all platforms. The VMs started as OpenStack instances based on the 12.04 LTS Ubuntu cloud image,4
and were afterwards the exported to be run separately outside of OpenStack. Both of the CPUs in the different machines support Intel VT-x HAV technology with VT-d and they also have support for Extended Page Tables (EPT). Unless stated otherwise, each VM was allocated 8GiB of memory and 4 vCPUs.
For each VMM, we first ran experiments with default configurations and then attempted to obtain max-imum performance (shortest run time for the alignment applications) by tuning VMM settings for improved throughput. In the VMM configurations specified as ‘default,’ limited performance tuning was performed, i.e. ensuring all supported cpu features were available to VMs’ vCPUs, using para-virtualised drivers wherever possible (e.g. virtio for KVM and the para-virtualised version of Xen).
4.3. Simulated Read Data. In order to ensure that differences observed were not caused by variance in input data, all of the results presented below used an identical copy of the input dataset. The input data consisted of paired-end 75bp reads sampled uniformly from human chromosome 1 (UCSC hg195
) with 2x coverage using the ART Illumina read simulator [11]. The simulated FASTQ files contained approximately 3 million reads with an average Phred score of 22 and mean fragment length of 200bp. We will refer to this dataset aschr1throughout the remainder of this work.
Since we simulate paired-end short reads, BWA was run with thealncommand twice (to align each half of the read) and thesampecommand took the output of eachalnstep to perform the final mapping. For both BWA and Novoalign, we indexed the referencea priori and both aligners were configured to output the alignment in SAM format [18]. Note that we only investigate the performance characteristics of the alignment utilities and aside from generic comments when comparing these tools, the quality of the output is beyond the scope of this work.
5. Results.
5.1. Default Settings. All of the results presented in this Subsection are for VMs and hypervisors with default settings from Ubuntu 12.04, as described in Sect. 4.2. The measurements reflect what one can expect for ‘out-of-the-box’ performance. Furthermore, the default performance values provide a useful baseline for tuning, enabling one to see what improvements can be made later on (cf. Sect. 5.2).
3
http://libvirt.org/ 4
http://cloud-images.ubuntu.com/precise/ 5
PHY KVM XEN-pv LXC 0.95
1 .00 1
.05 1.10 1.15 1
.20 1.25
Mean
Runtime
(nor
malised
to
ph
ysical)
1.00
1.19
1.09
1.00
BWA Runtime (Machine 1)
PHY KVM XEN-pv LXC
0.95 1
.00 1
.05 1.10 1.15 1
.20 1.25
Mean
Runtime
(nor
malis
ed
to
ph
ysical)
1.00
1.21
0.99 1.00
BWA Runtime (Machine 2)
(a) (b)
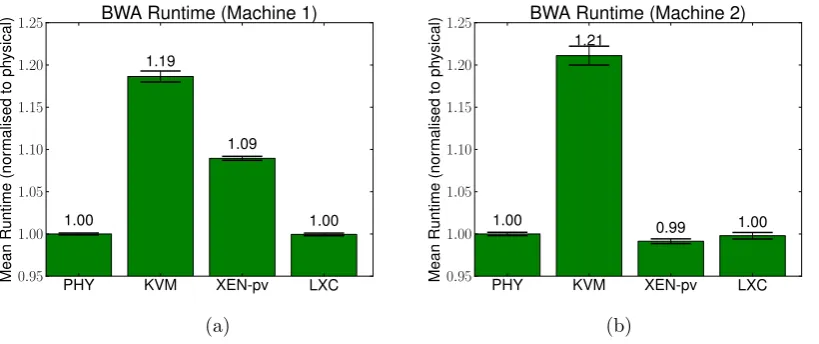
Fig. 5.1.Results from 30 samples (10 on Machine 2) of running BWA on simulated paired-end Chromosome 1 reads on one
virtual machine with the hypervisors in default configuration for Ubuntu 12.04. The x-axis indicates the hypervisor, where PHY = physical server, KVM = Kernel Virtual Machine, XEN-pv = Paravirtualised Xen and LXC = Linux Container. The error bars indicate the 95% confidence interval. (a)Machine 1 (Sandy Bridge R720), for which the physical server took a mean of 1955.49 seconds to complete the alignment. (b) Machine 2 (Westemere workstation), for which PHY took a mean of 2460.09 seconds to complete. (Note that even though XEN-pv has a normalised runtime of 0.99, the confidence intervals of PHY and XEN-pv overlap.)
5.1.1. BWA. The results of running BWA on Machine 1 and all four execution environments (physical server, Kernel Virtual Machine, para-virtualised Xen and Linux Containers) are shown in Fig. 5.1.a. (Note that only one virtual machine was running at a time.) In this test, a paired end alignment with BWA was run 30 times on thechr1dataset, and a mean of the run time was obtained. In all cases, the application (BWA) was run single-threaded. Since many sequencing pipelines involve large amounts of data, it is not uncommon for users to run alignment and variant calling applications single-threaded and parallelise across datasets (e.g., to parallelise across chromosomes when mapping an entire genome). Here, we see that LXC’s performance closely matches that of the physical server, but Xen and KVM have significant overhead. We reiterate that these results are consistent across runs on both of the servers with Machine 1’s hardware configuration. However, when considering the performance on Machine 2 (cf. Fig. 5.1.b), one can see a stark difference from Machine 1. In particular, Xen exhibits a much larger overhead for Machine 1. This difference will be investigated in Sect. 5.2.2.
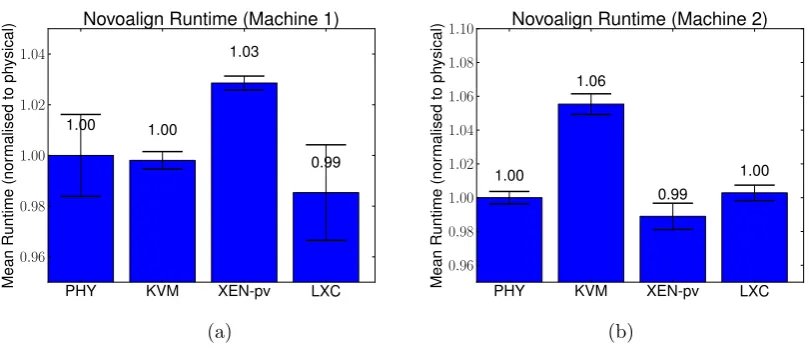
5.1.2. Novoalign. Novoalign was run on the same input data as BWA was, and the mean runtime and confidence intervals were obtained (cf. Fig. 5.2). Again, the application executions were single threaded compu-tations with one VM running at a time. Note that the scales on the y-axis of the plots in Fig. 5.2 are significantly smaller than those of BWA. One can see that for Machine 1, KVM is now on par with the physical server, and Xen exhibits very low overhead.
5.2. Improvements from Tuning. Default configurations are generally designed to balance reasonable performance with power efficiency and resource sharing for a wide variety of machines. However, optimum performance can usually be obtained only by tuning various parameters and system behaviour, which are often highly specific to the system of interest. In this Subsection, we describe how we tuned each hypervisor to obtain performance as close as possible to that of running on a physical machine. For KVM, we followed best practices when it comes to tuning for memory and I/O throughput. In Xen, we found that the version has a strong impact, and we attribute that impact to vCPU scheduling improvements.
applica-PHY KVM XEN-pv LXC
0.96
0.98
1.00
1.02
1.04
Mean
Runtime
(nor
malised
to
ph
ysical)
1.00 1.00
1.03
0.99 Novoalign Runtime (Machine 1)
PHY KVM XEN-pv LXC
0 .96
0.98
1 .00 1
.02
1.04
1 .06
1.08
1.10
Mean
Runtime
(nor
malis
ed
to
ph
ysical)
1.00
1.06
0.99
1.00 Novoalign Runtime (Machine 2)
(a) (b)
Fig. 5.2.Results from 30 samples (10 on Machine 2) of running Novoalign on simulated paired-end Chromosome 1 reads on
one virtual machine with the hypervisors in the default configuration for Ubuntu 12.04. The error bars indicate the 95% confidence interval. (a)Machine 1 (Sandy Bridge R720), for which the physical server (PHY) took a mean of 4533 seconds to complete the alignment. (b)Machine 2 (Westemere workstation), for which PHY took a mean of 5736 seconds to complete.
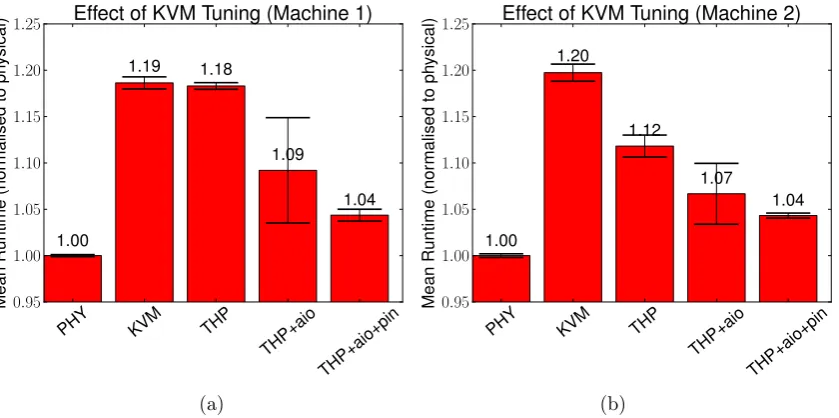
tions studied [29]. When tuning, we chose to focus on using BWA, since it had a shorter run time (allowing for more efficient experimentation), but it also consistently presented a high overhead with KVM. The results of KVM tuning are summarised in Fig. 5.3. As both sequence aligners used in this work are memory-intensive ap-plications (in that they operate on relatively large in-memory datasets), improving memory performance should have a positive effect on application performance. In that respect, we investigate different virtual memory and NUMA configurations. Since BWA and Novoalign can work with large files, we also investigate parameters for tuning disk performance.
One way to improve memory performance is to reduce the number and cost of page faults by using ‘huge’ pages, or memory pages larger than the system’s default. Traditionally, huge pages would need to be reserved by the operating system at boot time, but transparent huge pages (THP) can be dynamically assigned to anonymous memory regions (e.g., heap and stack space). libvirt supports the use of THP for KVM guest memory, and all data points designated with ‘THP’ (cf. Fig. 5.3) had THP enabled.
Though the para-virtualised virtio drivers were used with raw VM image file-backed virtual disks, there was still room to tune disk I/O parameters. The libvirt API defaults to using QEMU worker threads for asynchronous I/O (AIO). Another option is to use native Linux asynchronous I/O.6
Experiments with native AI/O are designated by ‘aio’ in Fig. 5.3. We see that native AI/O is helpful in reducing the mean time on both machines. We also tested different caching strategies, but we found the default cache=‘none’ (chosen by OpenStack when creating the VM image), which bypasses the host OS’s buffer cache, to be the best-performing strategy.
As mentioned in Sect. 3, modern CPUs (sockets) have asymmetric memory access times to different mem-ory regions. That asymmetric memmem-ory speed is also referred to as Non-Uniform Memory Access (as defined previously), and, in keeping with standard terminology, we will refer to a specific region of memory (e.g., mem-ory associated with CPU socket 0) as a NUMA node. In our experiments, we observed that in the default configuration, roughly half of a VM’s pages resided on one NUMA node while the other half resided on the other node. (Both types of machines we used had two CPU sockets and therefore two NUMA nodes.) In order to prevent processors from accessing memory non-local to their NUMA node, one can restrict virtual CPUs to a set of physical CPUs. In Fig. 5.3, the ‘pin’ data points refer to runs in which vCPUs were manually pinned to specific NUMA nodes.
6
PHY KVM THP
THP+aio
THP+aio+pin 0
.95 1
.00 1
.05 1
.10 1
.15 1
.20 1
.25
Mean
Runtime
(nor
malised
to
ph
ysical)
1.00
1.19 1.18
1.09
1.04 Effect of KVM Tuning (Machine 1)
PHY KVM THP
THP+aio
THP+aio+pin 0
.95 1
.00 1
.05 1
.10 1
.15 1
.20 1
.25
Mean
Runtime
(nor
malis
ed
to
ph
ysical)
1.00
1.20
1.12
1.07
1.04 Effect of KVM Tuning (Machine 2)
(a) (b)
Fig. 5.3. Results from 10 samples of running BWA on the chr1 dataset using the KVM hypervisor with various tuning
options (cf. 5.2.1 for more details). The error bars indicate the 95% confidence interval. ‘PHY’ indicates the physical server and ‘KVM’ indicates KVM with a ‘default’ configuration. ‘THP’ means that the hypervisor had Transparent Huge Pages enabled, ‘aio’ indicates that the VM was using Linux native asynchronous I/O and ‘pin’ indicates that the VM was pinned to CPUs on the same NUMA node. (a)Machine 1 (Sandy Bridge R720), for which the physical server (PHY) took a mean of 1955 seconds to complete the alignment. (b)Machine 2 (Westemere workstation), for which PHY took a mean of 2460 seconds to complete.
5.2.2. Xen Version. When examining the performance of each VMM in its respective default configu-ration, we can see that relative VMM runtime completion is not consistent across machines (cf. Fig. 5.1 and 5.2). Specifically, Xen-pv exhibits a runtime that is (statistically) equivalent to that of the physical server for Machine 2, but the runtime for Machine 1 exhibits approximately a 9% overhead.
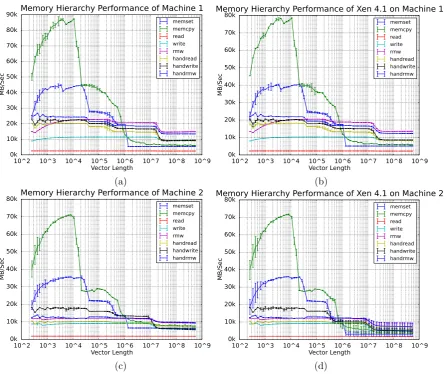
To further investigate those differences, we ran the low-level CacheBench benchmark both in and out of the Xen VMs to characterise the memory performance of each machine [23]. The results are displayed in Fig. 5.4. Inspection of Figs. 5.4.a and 5.4.b reveals that Machine 1 exhibits a performance degradation of roughly 10%, whereas Machine 2 has nearly identical memory performance under Xen 4.1. That disparity is also reflected in Figs. 5.1 and 5.2, which show that the Xen VM experienced performance overhead in Machine 1 (also close to 10%), but not in Machine 2.
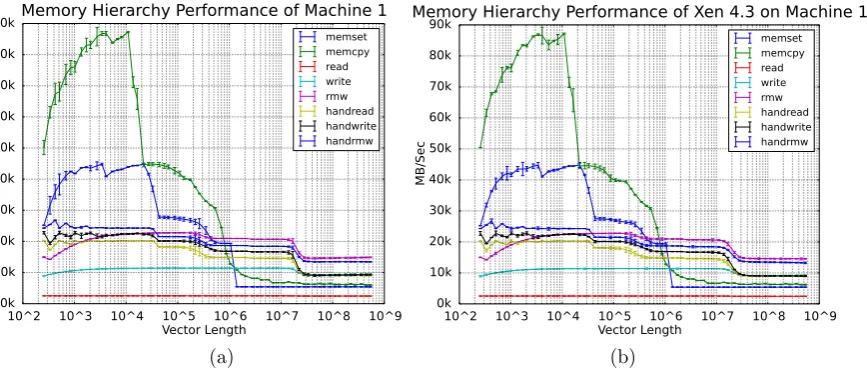
While investigating the cause for the disparity in Xen performance across machine types, we experimented with different versions of Xen. After upgrading to Xen 4.4, we reran CacheBench, and the results for Machine 1 demonstrated no overhead. The CacheBench experiments were repeated for all minor versions of Xen, and it was confirmed that the performance on Machine 1 changed with version 4.3; the results are presented in Fig. 5.5. Contrasting the axes with those of Fig. 5.4, it is apparent that Xen 4.3 now matches the physical server performance (as Machine 2 did in Figs. 5.4.c and 5.4.d).
The 4.3 version of Xen included many performance enhancements, but the most notable is the more NUMA-aware scheduler it introduced.7
Since forcing appropriate NUMA placement results in large improvements to applications running in KVM, it is not surprising that a more NUMA-aware scheduler would be helpful for a two-CPU-socket machine running Xen.
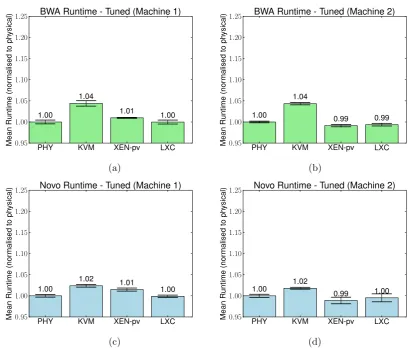
5.2.3. Overall Runtime after Tuning. Fig. 5.6 shows the relative (to the physical server) performance of BWA and Novoalign on all platforms after tuning. The tuning included NUMA node pinning for the physical server and LXC. As can be seen, performance ordering is now consistent across both machine types, and all VMs have single-digit percent overheads.
7
10^2 10^3 10^4 10^5 10^6 10^7 10^8 10^9Vector Length 0k
10k 20k 30k 40k 50k 60k 70k 80k 90k
MB/S
ec
Memory Hierarchy Performance of Machine 1
memset memcpy read write rmw handread handwrite handrmw10^2 10^3 10^4 10^5 10^6 10^7 10^8 10^9Vector Length 0k
10k 20k 30k 40k 50k 60k 70k 80k
MB/S
ec
Memory Hierarchy Performance of Xen 4.1 on Machine 1
memset memcpy read write rmw handread handwrite handrmw(a) (b)
10^2 10^3 10^4 10^5 10^6 10^7 10^8 10^9Vector Length 0k
10k 20k 30k 40k 50k 60k 70k 80k
MB/S
ec
Memory Hierarchy Performance of Machine 2
memset memcpy read write rmw handread handwrite handrmw10^2 10^3 10^4 10^5 10^6 10^7 10^8 10^9Vector Length 0k
10k 20k 30k 40k 50k 60k 70k 80k
MB/S
ec
Memory Hierarchy Performance of Xen 4.1 on Machine 2
memset memcpy read write rmw handread handwrite handrmw(c) (d)
Fig. 5.4.Results from CacheBench of llcbench run on Machines 1 (Sandy Bridge) and 2 (Westmere). Figs.(a)and(b)are
from Machine 1, and Figs.(c)and(d)are from Machine 2. While(a)and(b)may appear to be identical, note the difference in y-axis scales, representing a roughly 10% performance difference. Error bars indicate the 95% confidence interval calculated over 30 independent runs of the benchmark.
5.3. Execution Statistics. To better understand the characteristics of each application, we ran collectl8 during the execution of a single instance of each application on Machine 1 (physical). Collectl is a utility that collects OS statistics about a running system, such as CPU load and memory usage. We chose to measure CPU, memory and disk usage over time. The outputs from collectl during the execution of each application are graphed in Figs. 5.7.a and 5.7.b. The execution pattern in Fig. 5.7.a is consistent with the execution of BWA commands. As can be seen in Fig. 5.7.b, the firstaln command finished at roughly 40% of the total runtime and the SAM output is generated when sampe starts at roughly 90%, initiating the heavy disk activity. Fig. 5.7.b shows that Novoalign reads the input files all at once and performs its operations in-memory.
6. Analysis and Discussion. Analysing the data presented earlier, we make the following observations:
6.1. CPU pinning can be effective for managing resource contention. One surprising observation was that while modern OS schedulers (the Linux task scheduler schedules KVM vCPUs) are NUMA-aware and should attempt to keep processes running on the same CPU to avoid cache thrashing, we were still able to gain a considerable performance increase by manually placing vCPUs/processes. It should be noted that
8
10^2 10^3 10^4 10^5 10^6 10^7 10^8 10^9Vector Length 0k
10k 20k 30k 40k 50k 60k 70k 80k 90k
MB/S
ec
Memory Hierarchy Performance of Machine 1
memset memcpy read write rmw handread handwrite handrmw10^2 10^3 10^4 10^5 10^6 10^7 10^8 10^9Vector Length 0k
10k 20k 30k 40k 50k 60k 70k 80k 90k
MB/S
ec
Memory Hierarchy Performance of Xen 4.3 on Machine 1
memset memcpy read write rmw handread handwrite handrmw(a) (b)
Fig. 5.5.Results from CacheBench of llcbench run on Machine 1 with Xen 4.3. (a)shows the physical server and(b)shows
llcbench run under Xen 4.3, which alleviates the overhead seen in Figs. 5.4.a and 5.4.b. Error bars indicate the 95% confidence interval calculated over 30 independent runs of the benchmark
.
the machines were not maximally utilised in our studies, and more intensive workloads would likely exacerbate the performance loss of poorly placed processes. For the proper Xen versions, Xen did quite well in matching physical machine performance, and we attribute that to a more NUMA-aware scheduler.
6.2. Despite having a similar objective, alignment programs can utilise system resources in very different ways. Figs. 5.7.a and 5.7.b allow us to compare how the two alignment applications differ in their use of system resources. BWA periodically reads from the disk, while Novoalign reads all of its input in one shot. However, we expect that behaviour to change with datasets larger than system memory, and further experimentation is required. The applications’ differing behaviour provides evidence contrary to our hypothesis in Sect. 2.1 that alignment programs should utilise resources similarly. Therefore, users and system integrators should be careful to observe how their chosen application performs in a given environment.
6.3. Novoalign is efficient with system resources. Based on our observation of how the applications use resources, while Novoalign takes more than twice the time BWA does to finish execution on both systems, Novoalign is more efficient with system resources. One must remember that though the objective of these applications is the same, their outputs from the same input data are different. Fig. 5.7.a shows that BWA has a more bursty read/write pattern. It could fill caches and cause the application to block on I/O bandwidth. In Fig. 5.7.b, Novoalign can be seen to make many small writes (as is also evident from the constant steep increase of the buffer cache size). In addition to the battery-backed write cache on Machine 1’s RAID controllers, modern filesystems (e.g., the ext4 [21] filesystem used on both machines) have a delayed allocation cache strategy, and the many small writes that Novoalign performs would likely be more amenable to this strategy than to bursts of larger writes.
PHY KVM XEN-pv LXC 0.95
1 .00 1
.05 1.10 1.15 1
.20 1.25
Mean Runtime (nor malised to ph ysical) 1.00 1.04 1.01 1.00 BWA Runtime - Tuned (Machine 1)
PHY KVM XEN-pv LXC
0.95 1
.00 1
.05 1.10 1.15 1
.20 1.25
Mean Runtime (nor malis ed to ph ysical) 1.00 1.04 0.99 0.99
BWA Runtime - Tuned (Machine 2)
(a) (b)
PHY KVM XEN-pv LXC
0.95 1.00 1
.05 1
.10 1.15 1 .20 1 .25 Mean Runtime (nor malised to ph ysical) 1.00 1.02 1.01 1.00 Novo Runtime - Tuned (Machine 1)
PHY KVM XEN-pv LXC
0.95 1.00 1
.05 1
.10 1.15 1 .20 1 .25 Mean Runtime (nor malis ed to ph ysical) 1.00 1.02 0.99 1.00 Novo Runtime - Tuned (Machine 2)
(c) (d)
Fig. 5.6. Results from 10 samples of running BWA on simulated paired-end Chromosome 1 reads with the hypervisors tuned
for performance (see 5.2 for more details). The values indicate performance relative to a physical machine running on identical hardware with NUMA-aware CPU pinning. The error bars indicate the 95% confidence interval. (a)Machine 1 (Sandy Bridge R720), with a physical server runtime of 1954.93 (b)Machine 2 (Westemere workstation), with a physical server runtime of 2460.09. (c)and (d) show data for the same systems as(a) and (b)(respectively), but with Novoalign instead of BWA. For Novoalign, Machine 1 had a physical server runtime of 4212.19, and Machine 2 had a runtime of 5714.91. While KVM had no measurable overhead in the default configuration with Novoalign, when both PHY and KVM were tuned for NUMA, we observed a drop in the relative performance for KVM, even though it completes in 94% of the time of the original PHY measurement.
6.5. After tuning, performance ordering is the same across machine types. Keeping in mind the above observation and considering Figs. 5.1.a and 5.2.a, we see that in one case KVM is the slowest, and in the other case, Xen is the slowest. After VMMs were tuned, performance ranking became consistent across applications and machine types. It would take a more detailed study to confirm the generality of this observation.
6.6. The extent to which huge pages are beneficial is machine-dependent. In Fig. 5.3, one can see that Machine 2 benefits noticeably more than Machine 1 from using THP. Machine 1 has a larger cache size than Machine 2, so TLB misses are likely less expensive on Machine 1, as page table entries are more likely to reside in a lower-level cache on Machine 1.
0 20 40 60 80 100 0.0
0 .5 1.0 1.5
Active
CPUs
BWA System Statistics
User Sys
0 20 40 60 80 100
0 1 2 3
%
Memory
Used Mapped Cache
0 20 40 60 80 100
Run completion (%) 0
200 400 600
MiB/s
Read Write
0 20 40 60 80 100
0.0 0
.5 1.0 1.5
Active
CPUs
Novoalign System Statistics
User Sys
0 20 40 60 80 100
0 1 2 3
%
Memory
Used Mapped Cache
0 20 40 60 80 100
Run completion (%)
0 100 200 300 400
MiB/s
Read Write
(a) (b)
Fig. 5.7. Output from running collectl during a single-threaded execution of BWA (a) and Novoalign (b) on Machine 1.
CPU, memory and disk statistics were sampled and collected once per second. The CPU data were normalised to the number of available processing threads the system had, and ‘User’ refers to the time the CPU spends in userspace, ‘System’ refers to the time the CPU spends performing OS tasks. For memory, ‘Used’ refers to the percentage of system memory used by applications; ‘Cache’ corresponds to the amount used by the buffer cache (cleared immediately before each run), and ‘Mapped’ corresponds to the amount of memory used for memory-mapped files. The last plot in each set corresponds to disk I/O and shows the read/write throughput of the disks at each point in time. We remind the reader that the disk controller used on Machine 1 has an external 1GiB battery-backed cache.
As discussed in 6.2, Novoalign and BWA have different disk access patterns. We believe that Novoalign’s disk access pattern contributes to its having a smaller virtualisation performance cost than BWA. That access pattern causes Novoalign to become CPU/memory-bound after application start-up, and to be overall less sensitive to VMM hardware emulation overhead.
6.8. Linux Containers have near-zero performance overhead. Based on our data, it is clear that if one wishes to build a cloud computing environment with performance as the paramount concern, a cloud built using Linux Containers would be the best choice amongst the options presented here. That conclusion was expected, but the intention of performing the experiments with LXC was to demonstrate and quantify the performance improvement for a bioinformatics workload. But, anyone choosing to adopt a container-based solution should be aware that there are certain drawbacks. We tested with a newer version of libvirt (1.1.1), and the LXC driver still did not support vCPU pinning without manual modification of cgroups. Also, some cloud adopters see the ability to choose one’s entire software stack (including the OS kernel, especially if the users are interested in a particular version or tuning parameters) as an advantage of cloud computing, and it is impossible to do so when using LXC unless one has control over the host OS (which is not likely in a cloud scenario).
6.9. Paravirtualised Xen has extremely low overhead. After the appropriate version of Xen was chosen, it did exhibit an extremely small overhead. Xen has nearly the same performance as LXC, but with a much more robust isolation method.
7. Related Work. Cloud computing services have been available for quite some time now, and as these technologies have matured, more users are porting their workloads to cloud environments. Many studies have focused on quantifying the impacts of cloud computing’s underlining technologies, particularly virtualisation, to user applications. The results of these studies play an important role in guiding users to selecting or building the most suitable cloud for their workload.
KVM and Xen hypervisors in three aspects, namely overall performance, performance isolation and scalability (i.e., the ability to add virtual machines without losing performance). Based on standard benchmarks, such as Linux kernel compilation and IOzone, they did not reach a general conclusion as to whether KVM or Xen is better because the performance results are application-dependent. In the performance isolation test, KVM outperformed Xen. Meanwhile, Xen was demonstrated to be more scalable than KVM. Coming from a commercial landscape, both studies [24] and [31] compared the performance of XenEnterprise and VMWare ESX by using a set of industry-standard performance benchmarks, such as SPECcpu2000Integer, Passmark, Netperf and SPECjbb2005. The two studies presented an interesting competition between the two popular commercial offerings of hypervisors. In the first study [24], VMWare ESX 3.0.1 noticeably outperformed XenEnterprise 3.0.3 in majority of the tests. Interestingly, the second study [31] showed that XenEnterprise version 3.2 matched VMWare ESX 3.0.1 in most tests, with some exceptions where Xen performed better.
The traditional High Performance Computing (HPC) community has expressed their interest in cloud com-puting through many studies comparing HPC workloads on different types of VMMs. The common perception is that the expected performance overhead of∼10% is acceptable for these applications when not running tightly coupled MPI-style computations [9]. To put that number in perspective, however, for a sequencing workload that could take e.g. 1000 CPU Hours to complete, 10% would be equivalent to roughly 4 CPU days. The authors in [13] ran tightly coupled MPI-based applications and observed significantly degraded performance (6-20x) on EC2. In a study closer to what was done in this work, the author in [10] used WCD EST, an EST assembler (contrasted with the whole genome assemblers used here) to measure the performance of EC2 for scientific workloads. The author focused on scalability and variability, and showed that EC2 can achieve accept-able scalability. This work also highlighted many qualitative benefits of moving to the cloud vs. participating in a typical shared computing cluster.
A recent study investigated the potential use of container-based virtualisation in HPC [30]. However, that study focused on HPC benchmarks, whereas the work presented in this paper evaluates actual application performance. That work also demonstrated that LXC and a physical server have near-identical performance, but found that Xen was slower than LXC and the physical server by roughly a factor of 2. It is difficult to determine the cause of the stark difference between their results and those presented in this paper, but the version of Xen was similar (4.1.2 in the other work and 4.1.5 as we initially tested here). As presented in Sect. 5.2.2, future versions of Xen may yield significantly better results. Additionally, the operating system used in that study was Ubuntu 10.04 and potentially had less efficient para-virtualisation drivers.
In a similar effort, study [8] presented a performance comparison of KVM and Docker [12], which is built using Linux Containers. This study demonstrated that Docker’s performance is equal or better than KVM in most tests. In addition, the authors showed that there are opportunities for performance tuning in both KVM and Docker. Our study again confirmed this conclusion in the domain of the genomics software.
Our study focuses on comparing three popular open-sourced VMMs, which cover all three major virtuali-sation technologies, namely Type I hypervisors, Type II hypervisors and light-weight containers. Furthermore, we specifically tuned these virtualisation platforms for genomic workloads, and showed that this is a worthwhile effort.
8. Conclusions. The results presented here are useful for genomics researchers and clinicians who are considering adopting a cloud based solution, particularly those who elect to explore the option of building a private cloud. As expected, when workloads became more CPU intensive and less I/O bound, performance inside a VM is practically indistinguishable from a physical server. We have demonstrated that Novoalign falls strongly into this class of software and is amenable to virtualisation. After proper tuning, BWA essentially exhibits similar behaviour. This means that these applications are ideal for use in a cloud setting, but one must either build a private cloud or work with the cloud provider to ensure proper tuning has taken place as an ‘out-of-the-box’ solution may fall very short of the full potential of the system. From a performance perspective, We believe that the small overhead introduced by virtualisation leaves IaaS cloud computing as a viable solution for genomics workloads that have traditionally been run inside data centres.
National Science Foundation, in part by the Air Force Research Laboratory and the Air Force Office of Scientific Research, under agreement number FA8750-11-2-0084, in part a grant from Infosys technologies, and in part by a Faculty Award from the IBM Corporation. The U.S. Government is authorized to reproduce and distribute reprints for Governmental purposes notwithstanding any copyright notation thereon. Portions reprinted, with permission, from [7] c⃝2014 IEEE.
REFERENCES
[1] LXC container driver. Online,http://libvirt.org/drvlxc.html, 2014. [2] Novocraft technologies. Online,http://novocraft.com, 2014.
[3] P. Barham, B. Dragovic, K. Fraser, S. Hand, T. Harris, A. Ho, R. Neugebauer, I. Pratt, and A. Warfield,Xen
and the art of virtualization, ACM SIGOPS Operating Systems Review, 37 (2003), pp. 164–177.
[4] T. Broomhead, L. Cremean, J. Ridoux, and D. Veitch,Virtualize everything but time., in OSDI, vol. 10, 2010, pp. 1–6.
[5] T. Deshane, Z. Shepherd, J. Matthews, M. Ben-Yehuda, A. Shah, and B. Rao,Quantitative comparison of xen and
kvm, Xen Summit, Boston, MA, USA, (2008), pp. 1–2.
[6] J. T. Dudley, Y. Pouliot, R. Chen, A. A. Morgan, and A. J. Butte,Translational bioinformatics in the cloud: an
affordable alternative, Genome medicine, 2 (2010), p. 51.
[7] Z. Estrada, Z. Stephens, C. Pham, Z. Kalbarczyk, and R. Iyer,A performance evaluation of sequence alignment software
in virtualized environments, in Cluster, Cloud and Grid Computing (CCGrid), 2014 14th IEEE/ACM International Symposium on, May 2014, pp. 730–737.
[8] W. Felter, A. Ferreira, R. Rajamony, and J. Rubio,An updated performance comparison of virtual machines and linux
containers, technology, 28, p. 32.
[9] M. Fenn, M. A. Murphy, and S. Goasguen,A study of a kvm-based cluster for grid computing, in Proceedings of the 47th
Annual Southeast Regional Conference, ACM, 2009, p. 34.
[10] S. Hazelhurst, Scientific computing using virtual high-performance computing: a case study using the Amazon elastic
computing cloud, in Proceedings of the 2008 annual research conference of the South African Institute of Computer Scientists and Information Technologists on IT research in developing countries: riding the wave of technology, ACM, 2008, pp. 94–103.
[11] W. Huang, L. Li, J. R. Myers, and G. T. Marth,ART: a next-generation sequencing read simulator, Bioinformatics, 28
(2012), pp. 593–594.
[12] S. Hykers,What is docker? Online,https://www.docker.com/whatisdocker/, 2013.
[13] K. R. Jackson, L. Ramakrishnan, K. Muriki, S. Canon, S. Cholia, J. Shalf, H. J. Wasserman, and N. J. Wright,
Performance analysis of high performance computing applications on the Amazon web services cloud, in Cloud Computing Technology and Science (CloudCom), 2010 IEEE Second International Conference on, IEEE, 2010, pp. 159–168.
[14] M. Kerrisk,Namespaces in operation, part 1: namespaces overview. Online,http://lwn.net/Articles/531114/, 2013.
[15] A. Kivity, Y. Kamay, D. Laor, U. Lublin, and A. Liguori,kvm: the linux virtual machine monitor, in Proceedings of the
Linux Symposium, vol. 1, 2007, pp. 225–230.
[16] H. Li,Aligning sequence reads, clone sequences and assembly contigs with BWA-MEM, arXiv preprint arXiv:1303.3997,
(2013).
[17] H. Li and R. Durbin,Fast and accurate short read alignment with burrows–wheeler transform, Bioinformatics, 25 (2009),
pp. 1754–1760.
[18] H. Li, B. Handsaker, A. Wysoker, T. Fennell, J. Ruan, N. Homer, G. Marth, G. Abecasis, R. Durbin, et al.,The
sequence alignment/map format and samtools, Bioinformatics, 25 (2009), pp. 2078–2079.
[19] R. Love,CPU affinity, Linux Journal, (2003).
[20] P. Luszczek, E. Meek, S. Moore, D. Terpstra, V. M. Weaver, and J. Dongarra,Evaluation of the HPC challenge
benchmarks in virtualized environments, in Euro-Par 2011: Parallel Processing Workshops, Springer, 2012, pp. 436–445.
[21] A. Mathur, M. Cao, S. Bhattacharya, A. Dilger, A. Tomas, and L. Vivier,The new ext4 filesystem: current status
and future plans, in Proceedings of the Linux Symposium, vol. 2, Citeseer, 2007, pp. 21–33.
[22] P. Menage,CGROUPS. Online,https://www.kernel.org/doc/Documentation/cgroups/cgroups.txt, 2006.
[23] P. Mucci, Llcbench(low-level characterization benchmarks) home page, World Wide Web,
http://icl.cs.utk.edu/projects/llcbench/(July 2000), (2000).
[24] P. Muditha Perera and C. Keppitiyagama,A performance comparison of hypervisors. Online,http://www.vmware.com/
pdf/hypervisor_performance.pdf, 2007.
[25] X. Qiu, J. Ekanayake, S. Beason, T. Gunarathne, G. Fox, R. Barga, and D. Gannon,Cloud technologies for
bioin-formatics applications, in Proceedings of the 2nd Workshop on Many-Task Computing on Grids and Supercomputers, ACM, 2009, p. 6.
[26] S. Soltesz, H. P¨otzl, M. E. Fiuczynski, A. Bavier, and L. Peterson,Container-based operating system virtualization: a
scalable, high-performance alternative to hypervisors, in ACM SIGOPS Operating Systems Review, vol. 41, ACM, 2007, pp. 275–287.
[27] L. D. Stein et al.,The case for cloud computing in genome informatics, Genome Biol, 11 (2010), p. 207.
[28] A. Theurer, K. Rister, O. Krieger, R. Harper, and S. Dobbelstein,Virtual scalability: Charting the performance of
linux in a virtual world, in Linux Symposium, 2006, p. 393.
wiki/images/5/59/Kvm-forum-2011-performance-improvements-optimizations-D.pdf, 2011.
[30] M. G. Xavier, M. V. Neves, F. D. Rossi, T. C. Ferreto, T. Lange, and C. A. De Rose,Performance evaluation of
container-based virtualization for high performance computing environments, in Parallel, Distributed and Network-Based Processing (PDP), 2013 21st Euromicro International Conference on, IEEE, 2013, pp. 233–240.
[31] A. XenSource,Performance comparison of commercial hypervisors, 2007.