Lidia Usnarska-Zubkiewicz
1, A, C–F, Jadwiga Hołojda
2, B–C, F, Jakub Dębski
3, B,
Anna Zubkiewicz-Zarębska
4, E–F, Ewa Zagocka
3, B, Kazimierz Kuliczkowski
3, FAnalysis of Free Serum Light Chains in Patients
Suffering from Multiple Myeloma Complicated
by Light-Chain Amyloidosis
1 Clinic of Hematology, Blood Neoplasms and Bone Marrow Transplantation, Wroclaw Medical University, Poland 2 Department of Hematology, District Specialist Hospital, Legnica, Poland
3 Department of Hematology, Blood Neoplasms and Bone Marrow Transplantation, Wroclaw Medical
University, Poland
4 Department of Infectious Diseases, Hepatology and Acquired Immune Deficiencies, Wroclaw Medical
University, Poland
A – research concept and design; B – collection and/or assembly of data; C – data analysis and interpretation;
D – writing the article; E – critical revision of the article; F – final approval of article; G – other
Abstract
Background. AL amyloidosis is an acquired systemic disease in which a pathologic amorphous substance pro-duced as a result of abnormal protein metabolism is deposited in the extracellular space of various tissues.
Objectives. The aim of the study was to investigate the relationship between the kappa and lambda serum free light chains (sFLCs) and the development of AL amyloidosis in patients suffering from multiple myeloma (MM).
Material and Methods. The investigations included 70 MM patients, 40 females and 30 males, aged 28–83 years. In 37 persons, MM was had been diagnosed recently; 33 patients had been undergoing treatment. Amyloidosis was diagnosed in 18 patients (25.7%), including nine females, nine males; six had newly diagnosed disease. Fifteen patients developed kidney failure. The control group consisted of 10 healthy donors. The concentration of sFLC ls were determined using the immunonephelometric method and expressed in mg/L.
Results. In 18 MM patients with amyloidosis the concentration of κ sFLCs ranged from 0.3 to 4780 (x = 854.5, SD = 1289), and was significantly higher (p = 0.039) than in the group without amyloidosis, where the range was from 0.3 to 426.0 (x = 68.9, SD = 98.1). The highest concentration of κ sFLCs was observed in the group of five patients with amyloidosis and renal failure. The concentration of λ sFLCs in patients with amyloidosis ranged from 0.5 to 41600 (x = 3035.7, SD = 9735) and was higher than in MM patients without amyloidosis, where it ranged from 0.5 to 834.0 (x = 79.3, SD = 193). In amyloidosis patients, the concentration of λ sFLCs was significantly higher (p = 0.05) in cases of renal failure as compared with the patients with normal renal function.
Conclusions. The concentration of sFLCs is a strong indicator of amyloidosis development in MM patients (Adv Clin Exp Med 2014, 23, 4, 531–538).
Key words: multiple myeloma, amyloidosis, kappa and lambda serum free light chains.
Adv Clin Exp Med 2014, 23, 4, 531–538 ISSN 1899–5276
ORIGINAL PAPERS
© Copyright by Wroclaw Medical University
Amyloidosis is an inherited or acquired sys-temic storage disease in which a pathologic, amor-phous substance produced as a result of abnormal protein metabolism and resistant to proteolysis is deposited in the extracellular space of various tis-sues. It leads to the destruction of normal tissue structure and disturbs its function. The disease may affect one organ or several organs simulta-neously, and is always fatal [1–3]. In light-chain
demonstrated that 85% of all patients diagnosed with AL amyloidosis meet the criteria of various forms of plasma cell dyscrasias, while the remain-ing 15% lack clinical symptoms of clonal growth of plasma cells [2]. According to Abraham et al., all patients with AL amyloidosis reveal monoclonal gammopathy on the basis of evaluations of their serum free light chain levels [4]. AL amyloidosis affects organs originating from the mesoderm tis-sue (the heart, digestive tract, peripheral nervous system, skin and tongue).
In normal conditions, serum free light chains (sFLCs) are produced in the amount of approxi-mately 0.5–1.0 g/day and their half-life depends on kidney function.
Serum FLCs are filtered in the kidney glom-eruli and metabolized in nephron proximal tu-bules, in amounts as high as 10–30g of sFLCs/24 hours, which means that even at very high concen-trations, sFLC excretion with urine may be small. This suggests that FLC concentration in serum and not in urine is a disease indicator in plasma cell dy-scrasias [5, 6].
The first examination of sFLCs in AL amyloi-dosis was carried out in 2002 at the National Am-yloidosis Center in London [7]. In 262 out 265 pa-tients (98%), the presence of sFLCs was detected in the course of the disease. In another study car-ried on 110 AL amyloidosis patients, Katzmann et al. demonstrated that in serum, immunofixa-tion proved positive in 68% of the cases; in urine in 83%; and in a nephelometric test the κ/λratio exceeded the normal range in 91% of the cases [8]. Other authors’ studies have confirmed immuno-ephelometric test sensitivity in 68–86% of patients in whom both immunofixation and electrophore-sis proved negative [9].
The goal of this study was to investigate the relationship between kappa and lambda sFLCs, as well as the development of AL amyloidosis in pa-tients suffering from multiple myeloma (MM).
Material and Methods
Patients
The study was approved by the Bioethical Committee of Wroclaw Medical University (Wro-claw, Poland). It included 70 MM patients, 40 fe-males and 30 fe-males, aged 28–83 years. In 37 pa-tients, MM was had been diagnosed recently, while 33 patients had been undergoing treatment for 2 to 34 months. Kidney failure had developed in 15 pa-tients. Diagnoses of MM and solitary plasmocyto-ma were based on standard criteria (Table 1).
The diagnosis of amyloidosis was based on the
presence of green-colored amyloid deposits under polarized light microscope in the adipose tissue harvested from the abdominal fold. Amyloidosis was diagnosed in 18 patients (25.7%), nine males and nine females, six of whom had been newly di-agnosed MM and 12 in whom the disease had pro-gressed or recurred; their ages were from 47 to 83 years (x = 63.5 years, SD = 9.4). In 52 of the MM patients (74.3%), including 31 females aged 28–81 years, (x = 61.8 years, SD = 11.7), amyloidosis was not detected. Amyloidosis was not diagnosed in any patient suffering from solitary plasmocytoma, and due to the small number of these patients, they were included in the non-amyloid MM group.
The control group consisted of 10 volunteer donors, five females and five males, aged 19–32 years (x = 22.5; SD = 4.4).
An adipose tissue biopsy was performed on all patients. The aspirated material was mottled on a slide and after drying for one hour it was stained with Congo red and subsequently assessed under a polarized light microscope (Fig. 1).
The determination of the sFLC concentra-tion was performed by the immunonephelometric method using Freelite Human Kappa and Lambda Free kits (The Binding Site) applied in a Dade
Beh-ring BN II Nephelometer (Simens) and expressed
in mg/L.
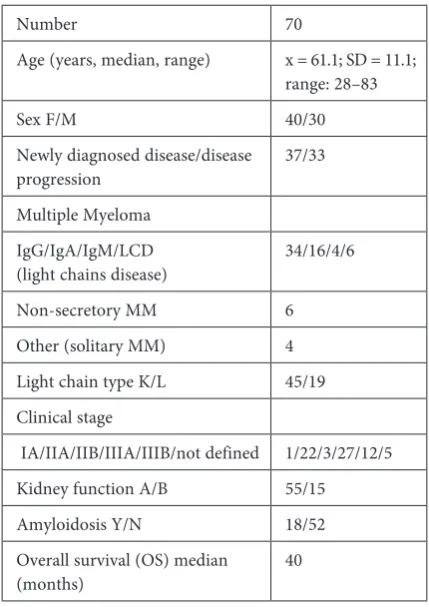
Table 1. Selected clinical and laboratory data of the patients in the study
Number 70
Age (years, median, range) x = 61.1; SD = 11.1; range: 28–83
Sex F/M 40/30
Newly diagnosed disease/disease
progression 37/33
Multiple Myeloma IgG/IgA/IgM/LCD
(light chains disease) 34/16/4/6
Non-secretory MM 6
Other (solitary MM) 4 Light chain type K/L 45/19 Clinical stage
IA/IIA/IIB/IIIA/IIIB/not defined 1/22/3/27/12/5 Kidney function A/B 55/15
Amyloidosis Y/N 18/52
Overall survival (OS) median
Freelite Human Kappa and Lambda Free kits are designed to determine sFLC concentration in the range 5.9–190 mg/L at a dilution of 1 : 100. At a sample dilution of 1 : 8000, concentrations up to 15.200 mg/L can be determined. The referential val-ue for free human kappa light chains (KF) is 3.300 to 19.400 mg/L; for free human lambda light chains (LF) it is 5.710 to 26.300 mg/L; and for the kappa/ /lambda ratio the referential value is 0.260 to 1.650.
Results
Analysis of κ sFLC
Concentrations in MM Patients
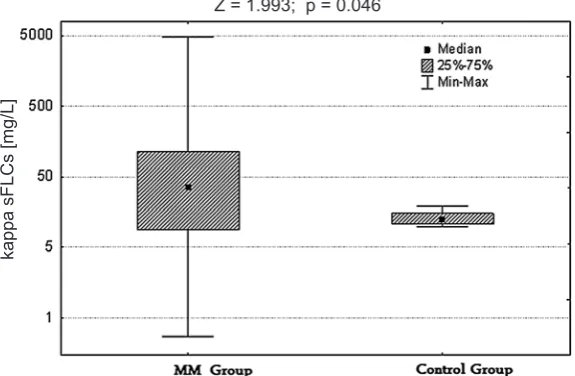
Concentrations of κ sFLCs in MM patients ranged from 0.3 to 4780.0 (x = 271, SD = 732) and was significantly higher (p = 0.0463) than the con-centration of these chains in the controls, (range:
3.8 – 19.1, x = 13, SD = 6.5) (Fig. 2). The concentra-tion of κ sFLCs in newly diagnosed patients ranged from 0.32 to 4780.0 (x = 253.0, SD = 802.0) and did not differ significantly from the value found in the patients who had already been treated, where it varied from 0.27 to 2670.0 (x = 291 SD = 658). The concentration of κ sFLCs in the 15 patients with renal failure ranged from 0.3 to 4780 (x = 336, SD = 816) and was significantly higher (p = 0.01) than the concentration found in the 55 patients with normal renal function (range: 13–113, x = 32, SD = 35.7).
Analysis of κ sFLC
Concentrations in MM Patients
with Amyloidosis
Concentrations of κ sFLCsof the 18 MM
pa-tients with amyloidosis ranged from 0.3 to 4780 (x = 854.5, SD = 1289) and were significantly higher (p = 0.039) than in the group without AL, where the concentrations ranged from 0.3 to 426 (x = 68.9, SD = 98.1) (Fig. 3).
The highest concentration of κ sFLCs was ob-served in the group of five MM patients with am-yloidosis and renal failure. It was significant-ly higher (p = 0.0008) than in renal dysfunction group without amyloidosis; the ranges were 0.27– 4780 (x = 1176, SD = 1398) and 0.27–426 (x = 76, SD = 108), respectively. It was also significantly higher (p = 0.001) in comparison with amyloido-sis patients with normal renal function (1.33–113, x = 38.5, SD = 36.8). The lowest concentration of κ sFLCs was found in patients without amyloido-sis or renal failure.
Amyloidosis occurred in 12 out of 45 dominant κ light chain MM patients and significantly more
Fig. 1. Amyloid deposits stained with Congo red under polarizing light microscope in a multiple myeloma patient
Fig. 2. Concentration of κ sFLCs in MM patients and in controls
kappa sFLCs [mg/L]
often in kappa IgG myeloma, (9/10 patients) than in kappa IgA patients (1/3 patients) (p = 0.05).
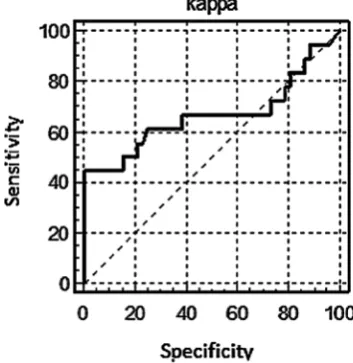
For the cut-off value k > 426 mg/L, sensitivity amounted to 44.4%, specificity to 100% and the area under the ROC curve (AUC) was 0.664 (Fig. 4).
For the cut-off value k > 94.7 mg/L,
sensitivi-ty amounted to 50.0% and specificisensitivi-ty to 80.8%. For this cut-off value, the odds ratio (OR) was 4.2 and the 95% confidence range extended from 1.33 to 13.30. This means that the probability of amyloi-dosis occurrence in MM patients with κ sFLCs > > 95 mg/L was over four times higher than in pa-tients with lower κ sFLC values. This difference was statistically significant (p = 0.05).
In the group of amyloidosis MM patients, the con-centration of κ sFLCs revealed positive correlations with lactate dehydrogenase (LDH) concentration in serum (r = + 0.2740, p = 0.003) and with beta2-m con-centrations in serum (r = + 0.3747, p = 0.03).
Fig. 3. Concentration of κ sFLCs in MM patients with and without amyloidosis
Fig. 4. ROC curve for κ light chains in 70 MM patients
Analysis of λ sFLCs
Concentrations in MM Patients
Concentrations of λ sFLCs in MM patients varied from 0.51 to 41600 (x = 839, SD = 5007) and were higher than the concentrations of λ chains in the healthy controls (range 5.7–23.4, x = 14.3, SD = = 5.9; p = 0.120) (Fig. 5). Concentrations of λ sFLCs in newly diagnosed patients did not differ signifi-cantly from the values observed in those who had already been treated. Concentrations of λ sFLCs in the 15 renal failure patients ranged from 0.5 to 41600 (x = 3434, SD = 10649) and were signifi-cantly higher than in the group with normal re-nal function (range: 0.5–3210, x = 132, SD = 507; p = 0.0037).
Analysis of λ sFLCs
Concentrations in MM Patients
with Amyloidosis
Concentrations of λ sFLCs in the 18 MM pa-tients with amyloidosis ranged from 0.5 to 41600 (x = 3035.7, SD = 9735); in the MM group without amyloidosis the range was 0.5–834, (x = 79.3, SD = 193). The difference was not statistically signifi-cant, probably due to the high values of standard deviation (Fig. 6).
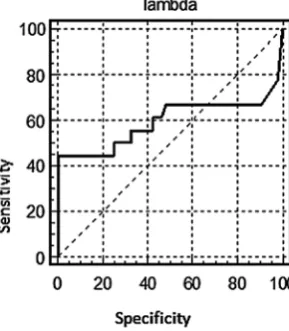
For cut-off value λ > 843 mg/L,
sensitivi-ty amounted to 27.8%, specificisensitivi-ty was 100%, and the area under the ROC curve (AUC) was 0.567 (Fig. 7). For cut-off value λ > 6.4 mg/L, sensitivity amounted to 55.6% and specificity was 48.1%. For this cut-off value, the OR was 0.86, and the 95% confidence range extended from 0.29 to 2.54.
Comparison of κ and λ sFLC
Concentration in Patients
Suffering from MM
with and Without Amyloidosis
and in the Controls
Abnormal concentrations of κ sFLCs were found in 16 patients with amyloidosis (88.8%); and abnormal λ sFLCs concentrations were found in 14 of them (77.8%). In the group of 52 patients with-out amyloidosis, abnormal concentrations of κ and λ sFLCs were detected in 44 patients (84.6%) and 24 patients (46.1%) respectively (p = 0.03) (Fig. 8).
Fig. 5. Concentration of λ sFLCs in MM patients and in controls
Fig. 6. Concentration of λ sFLCs in MM patients with and without amyloidosis
Fig. 7. ROC curve for λ light chains in 70 MM patients
Analysis of the κ/λ Ratio
in MM Patients
The value of the κ/λ ratio in MM patients var-ied from 0.00 to 5235 (x = 139.0, SD = 638.0), and it was significantly higher (p = 0.078) than the ra-tio in the controls (0.41–1.65, x = 0.97, SD = 0.23). The value of the κ/λ ratio in the 15 renal failure patients varied from 0.00 to 5235 (x = 175.8, SD = = 723.8) and was higher than in MM patients with normal renal function, (0.0 to 158.8, x = 14.8, SD = 40.8, p = 0.078).
Analysis of the κ/λ Ratio
in MM Patients
with Amyloidosis
The value of the κ/λratio in the amyloidosis group ranged from 0.0 to 5235 (x = 465.5, SD = = 1222) and it was significantly higher (p = 0.001) than in the group of MM patients without amy-loidosis (0.0–209, x = 26, SD = 46). In both sub-groups, the values were significantly higher than in the control group (p = 0.0001). The k/λ ratio in AL-complicated MM patients, both with and without renal failure, was significantly higher (p = = 0.0014 and p = 0.036 respectively) than in patients without amyloidosis in corresponding subgroups. The value of the κ/λ ratio in all MM patients, both with and without AL, exceeded normal values.
Discussion
Malignant plasma cells produce excessive amounts of one type of light chain, leading to ab-normal κ/λ ratio values. In the case of monoclonal
kappa proliferation, the ratio value increases, and with lambda proliferation it decreases. In the cur-rent study, abnormal concentrations of κ sFLCs were found in 60 out of 70 patients (85.7%). In 45 out of those 60 (75%), the κ sFLCs concentra-tion was above normal limits, and in the remaining 15 (25%) it was below. Abnormal concentrations of λ sFLCs were observed in 38 out of 70 patients (53.2%); in 20 of those 38 (50.5%) it was above normal limits and in 18 (49.5%) it was below. This means that in 65 of the MM patients (91.4%) both κ and λ sFLC concentrations were above the nor-mal limits. The concentration of κ sFLCs was sig-nificantly higher in comparison with healthy vol-unteers (p = 0.0463). However, no statistically significant difference was found between the pa-tients’ λ sFLC concentration in comparison with the healthy controls. In 53% of the patients, λ chains values were abnormal; in half of these the values were below normal limits. In 68 out of 70 patients (97.1%), the κ/λ ratio was abnormal. In 49 of them, it was above the values found in the control group and in 19 it was lower. These results are compatible with earlier measurements made in larger groups of patients. Snozek et al. detected
abnormal sFLCconcentrations in 95% of 576
pa-tients with newly diagnosed myeloma [10], and Dispenzieri et al. found abnormal κ/λ ratios in 96% of patients before treatment onset [11]. The par-ticipants in the current study included both newly diagnosed and relapse/progression cases; howev-er, the analysis did not reveal any significant dif-ferences between these two subgroups. In a study published by Mead et al., sFLCs levels were 84%, 92% and 94% of IgG, IgA and IgD myelomas re-spectively [12].In the present study, no significant differences in sFLCs concentration were observed in relation to the type of myeloma.
In the group of 18 amyloidosis patients, among whom there were 12 and 6 patients with kappa and lambda chains respectively, sFLC concentrations were observed to be significantly higher than in patients without amyloidosis. The first investiga-tion of sFLC concentrainvestiga-tions in AL amyloidosis was performed in London in 2003; that study revealed abnormal concentrations of sFLCs in 252 out of 262 patients (98%) [13]. Subsequent analyses by Katzmann et al. and Akar et al. confirmed a high percentage of positive sFLC results in amyloido-sis, but abnormal κ/λ ratios were detected in 89% and 73% of the patients respectively, depending on the light chain type [7, 14]. In contrast to the pres-ent study, those groups comprised patipres-ents whose amyloidosis was not coexistent with myeloma, which accounts for the smaller percentage of pa-tients in whom abnormal κ/λ ratios were detect-ed. According to Cohen et al., 10–15% of AL am-yloidosis patients may reveal minimally abnormal or increased sFLC concentrations with a κ/λ ra-tio within the normal limits [15]. In the present study, concentrations of sFLCs and κ/λ ratio val-ues, in both amyloidosis myeloma and non-amy-loidosis myeloma, were dependent on renal func-tion. The highest values of these parameters were observed in patients with both amyloidosis and renal failure. In an animal model, myeloma kid-ney occurs along with different concentrations of sFLCs, depending on the free chains’ physical and chemical qualities, their amino acid constellations or other factors like dehydration or hypercalcemia [16].In renal failure patients in whom glomeru-lous filtration has decreased, FLC clearance is low-ered, which leads to a prolonging to these chains’ half-life and a κ/λ ratio increase [16]. In 74% of amyloidosis patients who do not meet myeloma criteria, nephrotic syndrome develops; howev-er, kidney function may remain normal for some time. If amyloid fiber deposits are present mainly in the vessels, kidney lesions are manifested mainly by proteinuria [16]. In the present study, nephotic syndrome was not diagnosed in any of the pa-tients. Proteinuria and renal failure were observed in five amyloid patients and in 10 patients without this complication. The clinical profile may suggest that in the study group, myeloma-kidney-type le-sions developing with renal failure were more pre-dominant than glomerular lesions of the amyloi-dosis type developing with nephrotic syndrome. A final diagnosis would be possible on the basis of
a histopathological assessment of the kidneys, but no such tests were carried out.
A drop in the concentration of serum FLCs correlates with longer survival time, regardless of the chemotherapy applied [16]. In a study by Hutchinson et al., myeloma kidney patients were characterized by a higher sFLC concentration than myelomas with other pathological lesions in the kidneys [17]. A high concentration of serum FLCs is a bad prognostic factor. Dispenzieri et al. pub-lished the results of 119 AL amyloidosis patients who underwent megachemotherapy [18]. In the group with higher sFLC concentrations, they ob-served a significant increase in mortality, as well as a higher number of organ failures. Moreover, a positive correlation between sFLC level and tro-ponin concentration was observed [18]. In 301 analyzed myeloma cases, van Rhee et al. demon-strated that patients in whom sFLCs concentration was higher than 750 mg/L had the worst treatment outcomes. They had significantly higher concen-trations of creatinine, beta-2-microglobulin and LDH, as well as higher numbers of plasma cells in the bone marrow [19]. In the present study, in the group of MM patients with amyloidosis, kap-pa sFLC concentration was found to be correlat-ed positively with LDH and beta-2-microglobulin. Furthermore, the patients with the most advanced lesions due to the progression of amyloidosis had the highest concentration of sFLCs.
Data from Cohen et al. document the signifi-cance of free light chains in the development of yloidosis [20]. They demonstrated that 88% of am-yloidosis patients in whom sFLC concentration was reduced by over 50% due to treatment applied sur-vived 5 years. If the reduction in sFLCs was smaller, the five-year survival percentage decreased to 39% of the patients. Additionally, Cohen et al. demon-strated that reductions in sFLC concentration in-hibited the formation of new amyloid deposits and existing ones underwent partial regression.
The authors concluded that in myeloma pa-tients the concentration of kappa and lambda free light chains is increased. Amyloidosis is favored by more active myeloma development, which is as-sessed on the basis of serum LDH and beta-2-mi-croglobulin concentrations. In the data from the current study, the concentration of sFLCs, along with LDH and beta-2-microglobulin concentra-tion, is one of the strong discriminators of amyloi-dosis development in multiple myeloma patients.
References
Merlini G, Belloti V:
[1] Molecular mechanismus of Amyloidosis. N Engl J Med 2003, 349, 583–596.
Kyle RA, Gertz MA:
Pepys MB:
[3] Pathogenesis, diagnosis and treatment of systemic amyloidosis. Philos Trans R Soc Lond B Biol Sci 2001, 356, 203–210.
Abraham RS, Katzmann JA, Clark RJ, Bradwell AR, Kyle RA, Gertz MA:
[4] Quantitative analysis of serum free light chains. A new marker for the diagnostic evaluation of primary systemic amyloidosis. Am J Clin Pathol 2003, 119, 274–278.
Miyazaki NT, Takahashi H, Matsumori A,
[5] Maruyama T, Komoda T, Nagata A: Immunochemical quantification of free immunoglobulin light chain from an analytical perspective. Clin Chem Lab Med 2006, 44, 522–523.
Bradwell AR, Harding S, Drayson M, Mead G:
[6] Novel nephelometric assays give a sensitive measureof residual disease in multiple myeloma (MM). Br J Haemat 2008, 141, 39–42.
Katzmann JA, Clark RJ, Abraham RS, Bryant S, Lymp JF, Bradwell AR, Kyle RA:
[7] Serum reference intervals
and diagnostic ranges for the free κ and free λ immunoglobulin light chains. Relative sensitivity for detection of monoclonal light chains. Clin Che 2002, 48, 1437–1444.
Katzman JA, Abraham RS, Dispenzieri A, Lust JA, Kyle RA:
[8] Diagnostic performance of quantitative kappa and lambda free light chain assays in clinical practice. Clin Chem 2005, 51, 878–881.
Abraham RS, Geyer SM, Price-Troska TL, Allmer C, Kyle R, Gertz MA,
[9] Fonseca R: Immunoglobulin light chain variable (V) region genes influence clinical presentation and outcome in light chain – associated amyloidosis (AL). Blood 2003, 101, 3801–3808.
Snozek CLH, Katzmann JA, Kyle RA, Dispenzieri A, Larson DR, Clark RJ:
[10] Prognostic value of the serum free light chains ratio in newly diagnosed myeloma: proposed incorporation into the international staging system. Blood 2007, 110, 659a.
Dispenzieri A, Kyle RA, Katzmann JA,
[11] Therneau TM, Larson D, Benson J, Clark RJ, Melton LJ 3rd, Gertz MA, Kumar SK, Fonseca R, Jelinek DF, Rajkumar SV: Immunoglobulin free light chain ratio is an independent risk factor for progression of smoldering (asymptomatic) multiple myeloma. Blood 2008, 111, 785–789.
Mead GP, Carr-Smith HD, Drayson MT,
[12] Morgan GJ, Child JA, Bradwell AR: Serum free light chains for moni-toring multiple myeloma. Br J Haematol 2004, 126, 348–354.
Lachmann HJ, Gallimore R, Gillmore JD, Carr-Smith HD:
[13] Outcome in systemic AL amyloidosis in relation to changes in concentration of circulating free immunoglobulin light chains following chemotherapy. Br J Haemat 2003, 122, 78–84.
Akar H, Seldin DC, Magnani B
[14] O’Hara C, Berk JL, Schoonmaker C, Cabral H, Dember LM, Sanchorawala V, Connors LH, Falk RH, Skinner M: Quantitative serum free light chain assay in the diagnostics, evaluation of AL amyloidosis. Amyloid 2005, 12, 210–215.
Cohen AD, Comenzo R:
[15] Systemic Light-Chain Amyloidosis: Advances in Diagnosis, Prognosis and Therapy. Hematology 2010, 30, 287–294.
Rysava R:
[16] AL amyloidosis with renal involvement. Kidney Blood Res 2007, 30, 359–364.
Hutchison CA, Plant T, Drayson M
[17] Cockwell P, Kountouri M, Basnayake K, Harding S, Bradwell AR, Mead G:
Serum free light chain measurement aids the diagnosis of myeloma in patients with severe renal failure. Nephrology 2008, 9, 11–19.
Dispenzieri A, Lacy MQ, Katzmann JA, Rajkumar SV, Abraham RS, Hayman SR
[18] Hayman SR, Kumar SK,
Clark R, Kyle RA, Litzow MR, Inwards DJ, Ansell SM, Micallef IM, Porrata LF, Elliott MA, Johnston PB, Greipp PR, Witzig TE, Zeldenrust SR, Russell SJ, Gastineau D, Gertz MA: Absolute values of immunoglobulin free light chain are prognostic in patients with primary systemic amyloidosis undergoing peripheral blood stem cell transplantation. Blood 2006, 107, 3378–3383.
Rhee F, Bolejack V, Hollmig K,
[19] Pineda-Roman M, Anaissie E, Epstein J, Shaughnessy JD Jr, Zangari M, Tricot G, Mohiuddin A, Alsayed Y, Woods G, Crowley J, Barlogie B: High serum free-light chain levels and their rapid reduction in response to therapy Defie an aggressive multiple myeloma subtype with poor prognosis. Blood 2007, 110, 827–832.
Cohen AD, Zhou P, Chou J,
[20] Teruya-Feldstein J, Reich L, Hassoun H, Levine B, Filippa DA, Riedel E, Kewalramani T, Stubblefield MD, Fleisher M, Nimer S, Comenzo RL: Risk adapter autologous stem cell trans-plantation with adjuvant dexamathasone +/– thalidomide for systemic light chain amyloidosis: results of a chase II trial. Br J Haemat 2007, 139, 224–233.
Address for correspondence:
Lidia Usnarska-Zubkiewicz
Clinic of Hematology, Blood Neoplasms and Bone Marrow Transplantation Wroclaw Medical University
Wybrzeże L. Pasteura 4 50-367 Wrocław Poland
E-mail: [email protected]
Conflict of interest: None declared