Research Journal
Volume 12, No. 2, June 2018, pages 197–205
DOI: 10.12913/22998624/91890 Research Article
THE EFFECTIVENESS OF STRATEGIES PRINTING PRINTER EASY 3D MAKER
Jiří Kratochvíl1, Marek Sadílek1, Václav Musil1, Marek Pagáč1, Dana Stančeková2
1 VŠB – Technical University of Ostrava, Faculty of Mechanical Engineering, 17. listopadu 15/2172, 708 33
Ostrava-Poruba, Czech Republic, e-mail: [email protected].
2 University of Žilina, Faculty of Mechanical Engineering, Univerzitna 1, 010 26, Žilina, Slovak Republic, e-mail:
ABSTRACT
The article tackles the possibilities and effectiveness of different printing strategies on Easy 3D MAKER printer. This printer uses Fused Deposition Modeling (FDM) method. The operating software of the 3D printer offers various settings, which influ-ence the quality and efficiency of printing. In the article there is described the printing of a sample with all fillament print strategies available in the 3D maker software. The fillament print strategy of the printed model fundamentally influences the consump-tion of printing material and time at printing the component. The consumpconsump-tion of printing material was assessed indirectly by weight of particular printed samples. For each printing strategy there were 5 samples printed out. The Octagramspiral strategy resulted as the best in material consumption aspect. The most effective strategy in printing time perspective is the Concentric strategy.
Keywords: 3D print, strategy of 3D print.
INTRODUCTION
FDM (Fused Deposition Modeling) is today one of the most widespread methods of 3D print. This method was at the origins of cheap 3D print -ers, which are suitable for small companies and domestic use. In 1989 this technology was pat -ented by S.Scott Crump [7].
Additive manufacturing method in which a detail layer by layer is created by a plastic wire is melted and applied through a heated nozzle. (Fig. 1). The product is formed on a movable platform (1). A plastic thread (2) is fed through rolls (3) that presses the yarn through a heated die (4). Where the wire is heated up and is then discharged from the nozzle at a constant speed and a cross section of a CAD model is built up. After each layer building platform is lowered and the next layer is added. If necessary, a supportive structure like (5) is also printed to allow over -hang. Finishing in the form of removal of these support structures are required [4].
Each 3D printer uses its own software, in which loading of STL model and setting of printing para -menters takes place and the model is positioned in a printable area. The parameters to be set are: • Temperature of extruder,
• Velocity of feeding the extruder, • Thickness of particular printing layers, • Scaling factor and position of the model on a
printing platform,
• Filling of the model in %, • Choice of printing strategy, • Number of circuits.
3D printed objects are typically not 100% filled solids. Instead they are adhered with the help of a grid structure. Printing with higher density of filler gives the model higher toughness, but at the cost of material consumption and longer printing time.
CONDITIONS OF EXPERIMENT
The experiment was performed on printer EASY 3D MAKER and with software 3D MAK
ER from a German company LMB-Factories GmbH [11]. The software requires choosing the strategy of full layer and strategy of printing the filler. Printing strategy of full layer actually means printing the lower and upper side of the model and printing the filler means printing of the inside of the model. For analysis of effectivity of print -ing strategies 5 blocks 20x20 mm with height 10 mm were printed by all printing strategies of the filler, which are enabled by 3D MAKER software [2]. This article copes with assessment of the fill -er printing effectivity. The effectivity of printing strategy is the most significantly demonstrated right on the filler of the model.
The used fillament was plastic ABS with wire diameter 1.6 mm. The lower and upper layer was printed with concentric strategy at all samples
Fig. 1. FDM technology principal [3]
printed with different filler strategies with enter -ing 50% of the filler.
The time t (min) at printing each of the blocks was measured with stopwatch and each printed sam -ple was subsequentially weighed 5 times. The aver -age sample weight m (g) and variance of meassured values at print with given strategy was calculated.
INDIVIDUAL PRINTING STRATEGIES
ON 3D PRINTER EASY 3D MAKER WITH
MEASSURED VALUES
Rectilinear Strategy
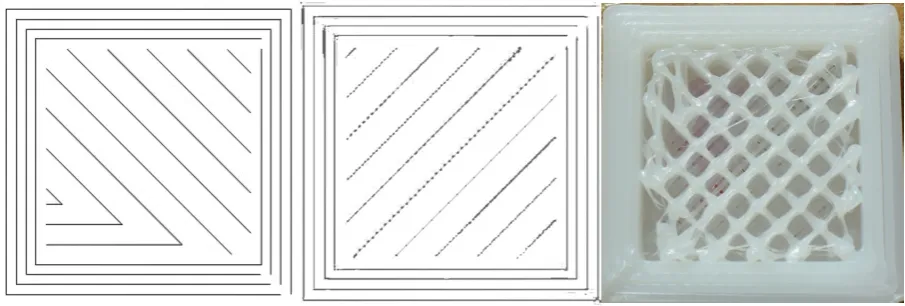
This filler is composed of parallel lines, which are generated at an angle 45°. They con-nect two adjacent sides together. The lines at the margin copy the perimeter so long, until it gets to the difference, which is given by the distance of the parallel lines according to the filler. In the next layer the lines cross each other and they are turned against the previous layer about 90°.
The distance of these parallels comes out of the percentage of the filler. This strategy creates squares, which are connected at their sides (Fig. 2) [3, 6].
With this strategy 5 samples were printed and they were marked by letters A-E at the terms described in the conditions of experiment. The time of printing the single samples measured with stopwatch is introduced in Table 1. Afterwards each printed sample was weighed 5 times, the weighing is marked by roman numerals I-V. The measured values can be found in Table 1.
Linear Strategy
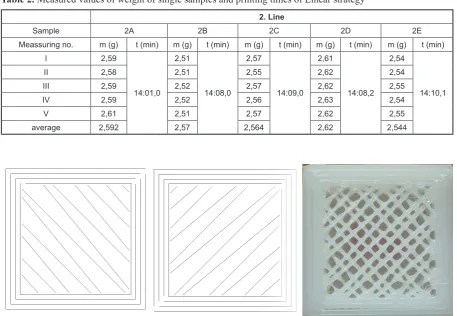
This printing strategy is formed by straight lines (see Fig. 3), which fill out the shape of the
layer according to the specified percentual fill. The line leads onto the layer edge, where it copies the shape of the outline and then it breaks back from the layer edge. Odd lines are parallel to each other, the same as the even lines. This filler changes the directions vertically at particular lines in each con -secutive layer. The main advantage of this filling type is that the lines at extruding never directly relate with the lines in already printed layers. This can help with printing of very thick layer [1, 6].
With this strategy 5 samples were printed and they were marked by letters A-E at the terms
described in the conditions of experiment. The time of printing the single samples measured with stopwatch is introduced in Table 2. Each printed sample was afterwards weighed 5 times and the weighing is marked by roman numerals I-V. The results of single measurements are dis -played in Table 2.
Concentric Strategy
With this method of setting there is higher importance of the shape of the printed layer. Table 1. Measured values of weight of single samples and printing times of Rectilienar strategy
1. Rectilinear
Sample 1A 1B 1C 1D 1E
Meassuring no. m (g) t (min) m (g) t (min) m (g) t (min) m (g) t (min) m (g) t (min)
I 2,75
14:23,8 2,58
14:22,7 2,68
14:20,8 2,56
14:18,5 2,66
14:20,3
II 2,71 2,59 2,67 2,57 2,67
III 2,71 2,58 2,69 2,56 2,67
IV 2,72 2,58 2,68 2,56 2,67
V 2,73 2,59 2,69 2,54 2,67
average 2,724 2,584 2,682 2,558 2,668
Fig. 3. Mapping of layer patterns from 3D MAKER software and printed model of Linear strategy [2]
Table 2. Measured values of weight of single samples and printing times of Linear strategy
2. Line
Sample 2A 2B 2C 2D 2E
Meassuring no. m (g) t (min) m (g) t (min) m (g) t (min) m (g) t (min) m (g) t (min)
I 2,59
14:01,0 2,51
14:08,0 2,57
14:09,0 2,61
14:08,2 2,54
14:10,1
II 2,58 2,51 2,55 2,62 2,54
III 2,59 2,52 2,57 2,62 2,55
IV 2,59 2,52 2,56 2,63 2,54
V 2,61 2,51 2,57 2,62 2,55
The jet follows this shape according to the per -centage of filling and it gradually decreases to the middle of the area (Fig. 4). If there is a square shaped layer, the jet forms a square, which gradually shrinks. With circle part the jet keeps moving in declining circles. The distance between the patterns is given by a percentage of filling. The bigger the percentage, the more patterns in one layer. This model can be used to
reduce the inner tension in a complex part with many small or curved sections. This can elimi -nate the deformation, but the sample needs to have a sufficient density [1, 6].
With this strategy 5 samples were printed and they were marked by letters A-E at the terms described in the conditions of experiment. The time of printing the single samples measured with stopwatch is introduced in Table 3. Each printed
Fig. 4. Mapping of layer pattern from 3D MAKER software and printed model of Concentric strategy [2]
Fig. 5. Mapping of layer pattern from 3D MAKER software and printed model of Honeycomb strategy [2]
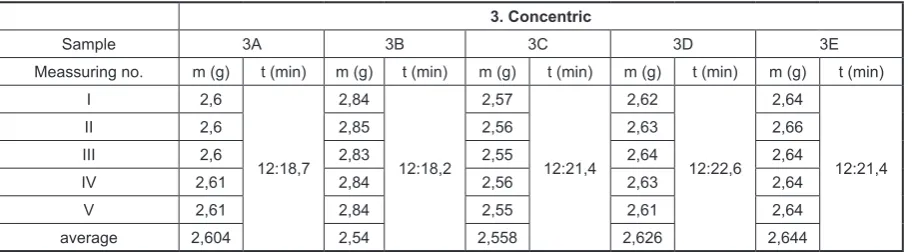
Table 3. Measured values of weight of single samples and printing times of Concentric strategy
3. Concentric
Sample 3A 3B 3C 3D 3E
Meassuring no. m (g) t (min) m (g) t (min) m (g) t (min) m (g) t (min) m (g) t (min)
I 2,6
12:18,7 2,84
12:18,2 2,57
12:21,4 2,62
12:22,6 2,64
12:21,4
II 2,6 2,85 2,56 2,63 2,66
III 2,6 2,83 2,55 2,64 2,64
IV 2,61 2,84 2,56 2,63 2,64
V 2,61 2,84 2,55 2,61 2,64
sample was afterwards weighed 5 times and the weighing marked by roman numerals I-V as dis -played in Table 3.
Honeycomb Strategy
This strategy divides the model layer by layer into hexagonals (Fig. 5), which touch themselves and they form a honeycomb. The extruder per -forms motion in the X and Y axe in lines, which represent the sides of the hexagonals mutually forming the angle of 60°. This action repeats in
the next layer. The length of the hexagonal side is influenced by a percentage of filling by the fil -lament. At the edges of the model there are usu -ally not hexagonals, but only their parts created. The printed area cannot always be divided to the whole patterns [6, 12].
With this strategy 5 samples were printed and they were marked by letters A-E at the terms described in the conditions of experiment. The time of printing the single samples measured with stopwatch is introduced in Table 4. Each printed sample was afterwards weighed 5 times. Table 4. Measured values of weight of single samples and printing times of Honeycomb strategy
4. Honeycomb
Sample 4A 4B 4C 4D 4E
Meassuring no. m (g) t (min) m (g) t (min) m (g) t (min) m (g) t (min) m (g) t (min)
I 3,01
14:38,0 2,84
14:37,2 2,91
14:36,5 2,87
14:37,2 2,94
14:36,3
II 3 2,85 2,91 2,88 2,93
III 3,01 2,83 2,9 2,88 2,94
IV 3,01 2,84 2,9 2,86 2,95
V 3 2,84 2,89 2,86 2,94
average 3,006 2,84 2,902 2,87 2,94
Table 5. Measured values of weight of single samples and printing times of Hilbertcurve strategy
5. Hilbertcurve
Sample 5A 5B 5C 5D 5E
Meassuring no. m (g) t (min) m (g) t (min) m (g) t (min) m (g) t (min) m (g) t (min)
I 2,47
14:12,9 2,57
14:35,6 2,47
14:15,6 2,51
14:18,2 2,5
14:17,6
II 2,47 2,57 2,48 2,5 2,49
III 2,46 2,57 2,45 2,51 2,5
IV 2,47 2,56 2,46 2,5 2,51
V 2,47 2,57 2,47 2,5 2,5
average 2,468 2,568 2,466 2,504 2,5
The individual weighing marked by roman nu -merals I-V including measured values are re -corded in Table 4.
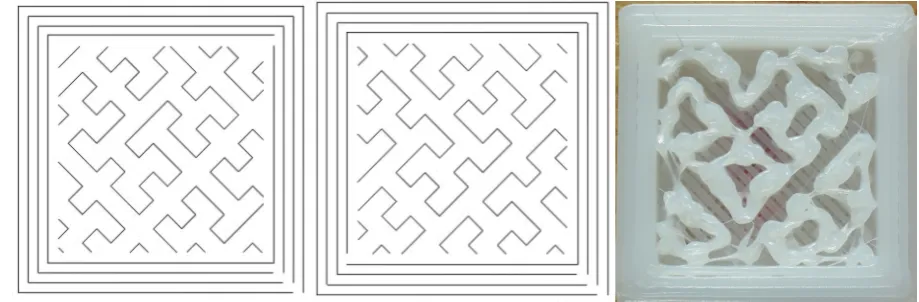
Hilbertcurve Strategy
It is a curve filling out the area with on a first sight difficult pattern. This pattern is, however, generated by the repetitive usage of simple rules. The pattern was created by the mathematician David Hilbert in 1891. It reminds of a continu -ous line of an impassable labyrinth. The curve is made of unfinished squares, which means a squa -re with only th-ree sides. Meaning that it forms a U-shape, see Fig. 6 [4, 6].
With this strategy 5 samples were printed and they were marked by letters A-E at the terms described in the conditions of experi -ment. The time of printing the single samples measured with stopwatch is introduced in Table 5. Each printed sample was afterwards weighed 5 times and the weighing is marked by roman numerals I-V. The Table 5. shows the printing time at each strategy and measured weight of particular samples.
Archimedeanchords Strategy
This pattern is one of the most complex. In G3DMAKER programm the strategy is consi -dered slower in comparison to the straight ones, because of the longer printing time. It is com -piled by a part of Archimedes´ spiral creating arcs on the printed area. It is naturally influen -ced by the setting of filling percentage, which defines the size of spiral printed inside of the layer. In the second layer the middle of the spi -ral takes place in a different point, which creates the arcs turned about 90° to the previous layer. Fig. 7 shows parts of the spiral from the printing software 3D MAKER [3, 6].
With this strategy 5 samples were printed and they were marked by letters A-E at the terms described in the conditions of experi -ment. The time of printing the single samples measured with stopwatch is introduced in Table 6. Each printed sample was afterwards weighed 5 times. The single weighings are marked by roman numerals I-V and their re -sults are displayed in Table 6.
Fig. 7. Mapping of layer patterns from 3D MAKER software and printed model of Archimedeanchords strategy [2]
Table 6. Measured values of weight of single samples and printing times of Archimedeanchords strategy
6. Archimedeanchord
Sample 6A 6B 6C 6D 6E
Meassuring no. m (g) t (min) m (g) t (min) m (g) t (min) m (g) t (min) m (g) t (min)
I 2,49
13:20,4 2,47
13:21,6 2,47
13:20,0 2,56
13:20,7 2,55
13:20,0
II 2,48 2,47 2,48 2,56 2,53
III 2,5 2,46 2,48 2,57 2,54
IV 2,5 2,47 2,49 2,57 2,55
V 2,49 2,47 2,5 2,57 2,55
Octagramspiral Strategy
This printing strategy is based on straight li -nes, which form an angle 90°. Optically they look like arrows. They are always started from one edge under the angle of 45° up to the half of the given area in the X axe, where the straight line breaks in 90° and it turns back to the opposite edge. Depending on the density of the filler the arrows can come up from the lower edge and they can finish there as well. After printing each layer the strategy turns about 90°. The density, resp. distance between the arrows is decided by the size of the fillament in percentage. In Fig. 8 we can see the arrow pattern starting in one layer only in the lower part, while it is not present at the other one at all. This phenomenon may be caused by smaller format of the sample, where the 3D MA -KER program is able to create the pattern only at bigger dimensions [5, 6].
With this strategy 5 samples were printed and they were marked by letters A-E at the terms described in the conditions of experiment. The time of printing the single samples measured with stopwatch is introduced in Table 7. Each printed
sample was afterwards weighed 5 times. Please see Table 7 for measured values of individual weighings marked with roman numerals I-V.
COMPARISON OF THE INDIVIDUAL
STRATEGIES
For evaluation of printing strategies we com -pare the weight of samples in order to com-pare the consumption of the fillament. We come out of the presumption that the bigger expenditure of fil -lament, the bigger the weight of the printed mod -el. Further the printing time was measured. The graphical comparison of printing strategies can be seen in Fig. 9. It comes out from the diagram that there are significant differences between the strategies in time as well as weight.
From the point of view of consumption of the fillament the octagramspiral printing strat -egy appears to be the best and worst is honey -comb printing strategy. The difference in aver -age weights of those two printing strategies is 0.56 g, which is 19% of average weight of the honeycomb strategy printed samples. From the point of view of time demandingness of the Table 7. Measured values of weight of single samples and printing times of Octagramspiral strategy
7. Octagramspiral
Sample 7A 7B 7C 7D 7E
Meassuring no. m (g) t (min) m (g) t (min) m (g) t (min) m (g) t (min) m (g) t (min)
I 2,38
12:22,8 2,3
12:23,9 2,36
12:23,2 2,3
12:24,1 2,42
12:24,2
II 2,38 2,3 2,36 2,29 2,41
III 2,38 2,3 2,36 2,3 2,41
IV 2,39 2,3 2,37 2,29 2,41
V 2,38 2,29 2,35 2,29 2,42
average 2,382 2,298 2,36 2,294 2,414
printing strategies the concentric strategy is the most preferable. The difference between maxi -mum printing time i.e. the honeycomb strategy and the concentric strategy is 2 min 17 s, which totals at 16% of the average printing time of honeycomb strategy.
If we add ranking of the best strategies ac -cording to the material consumption and we do the same for the time demandingness, with the sum of ranking we can find the overall most ad -vantageous strategy. From the table Table 8. it clearly comes out that for this type of a sample the octagramspiral strategy is optimal.
CONCLUSIONS
The article compares the printing strategies of filling the block 20x20x10 mm. The Octagramspiral strategy seems to be the optimal strategy for printing
this sample. By comparison of individual strategies we found significant time and material savings even at such a small sample. The worst strategy according to the measured aspects is the Honeycomb strategy.
From the time-consumption perspective the most favourable strategy of printing the sample is the Concentric strategy. By printing with this strategy 16% time savings were reached in com -parison to the longest printing strategy, i.e. Hon -eycomb strategy. It means the highest time sav -ings of all. The 3D print of models for practical utilization is usually bulkier and the print is more time demanding. Even at printing the same com -ponent with double dimensions i.e. 40x40x20 mm and expected printing time 1h the reduction could be around 9,6 min.
Considering the printing material consump -tion, which was assessed indirectly by weighing Table 8. Assessment of strategies according to ranking
Ranking
Printing Strategy
Ranking of weight Ranking of print. time Reached points Final ranking
1. Rectilinear 6 6 12 6.
2. Line 4 4 8 5.
3. Concentric 5 1 6 2.-3.
4. Honeycomb 7 7 14 7.
5. Cilbertcurve 2 5 7 4.
6. Archimedeanchord 3 3 6 2.-3.
7. Octagramspiral 1 2 3 1.
the individual samples, the Octagramspiral strat -egy was identified as optimal. The reduction of 19% was reached compared to average weight of the printed samples from Honeycomb strategy, which sample was the heaviest.
The saving in printing spatially bigger parts would be yet more remarkable. Of course the print -ing of a particular part with different dimensions, ir -regular shape or other differencies can make use of other preferable strategy, especially with focus on time as well as material consumption aspects. In 3D print and primarilly in practical usage of the printed models this comparison can be a direction towards decreasing the material consumption and the print -ing time especially with frequent repeat-ing of print for the same part. The models printed with 3D print often fulfill only visual function and there are no special requirements on their mechanical character-istics. Therefore, this article does not evaluate me -chanicle features of particular samples and the em -phasis is given to material and time consumption.
ACKNOWLEDGEMENT
Article has been done in connection with proj -ects Education system for personal resource of de -velopment and research in field of modern trend of surface engineering - surface integrity, reg. no. CZ.1.07/2.3.00/20.0037 financed by Structural Founds of Europe Union and from the means of state budget of the Czech Republic and by proj -ect Students Grant Competition SP2017/147 and SP2017/149 financed by the Ministry of Educa -tion, Youth and Sports and Faculty of Mechanical Engineering VŠB-TUO.
REFERENCES
1. Brubaker, Lars. Mattercontrol Delivers Optimized Hexagoninfill [online]. In: . 2015 [cit. 2017-03-22]. Available at: https://www.matterhackers. com/news/mattercontrol-delivers-optimized-hexagoninfill.
2. Easy3DMaker [online]. [cit. 2017-04-24]. Dostup-né z: http://www.3dfactories.com/3d-printers/ea-sy3dmaker/.
3. Evans, Brian. Practical 3D printers: The Science and Art of 3D Printing [online]. New York: Dis-tributed to the book trade world wide by Spring-er Science Business Media, 2012, s. 55-61 [cit. 2017-05-25]. Technology in action. ISBN 1430243929. Available at: https://books.google. cz/books?id=FPSsCTE9KpgC&pg=PA60&lpg= PA60&dq=rectilinear+infill&source=bl&ots=b gAOhyWrod&sig=82yVXOc-Bdmtp0sQdLovb 0bAs&hl=cs&sa=X&ved =0ahUKEwjA09-6h-PLAhWkJoKHe2GD1s4ChDoAQheMAc#v=on epage&q =rectilinear%20infill&f= false. 4. Hilbert Curves [online]. [cit. 2017-03-22].
Avail-able at: http://datagenetics.com/blog/march22013/ index.html.
5. Infill [online]. [cit. 2017-03-22]. Available at: http:// manual.slic3r.org/expertmode/images/infills.png. 6. Manual typ: EASY3DMAKER [online]. 2013
[cit. 2017-03-27]. Available at: http://eshop. svet-3dtisku. cz/user/upload/návody%20pro%20 3Dfactories/Uživatelská%20příručka%20 Easy-%20verze_7_2013.pdf.
7. Phoenix Analysis & Design Technologies: Fused Deposition Modeling [online]. [cit. 2017-10-8]. Dostupné z: http://www.padtinc.com/services/ra-pid-prototyping/fused-deposition-modeling-FDM. html. /.
8. Scott, Clare. Thales Alenia Space Looks to Space with Large Qualified 3D Printed Satellite Com-ponents and a New Collaboration. 3DPrint.com | The Voice of 3D Printing / Additive Manufacturing [online]. 13. červenec 2016 [cit. 2017-07-12]. Do-stupné z: https://3dprint.com/142012/thales-ale-nia-components/.
9. Tiskové materiály. [online]. 2010 [cit. 2016-10-23]. Dostupné z: http://www.easycnc.cz/rubrika/ tiskove-materialy/.
10. What is 3D Printing? The definitive guide. 3D Hubs [online]. [cit. 2017-01-09]. Dostupné z: https://www.3dhubs.com/what-is-3d-printing. 11. 3dfactories [online]. [cit. 2017-09-8] http://
www.3dfactories.com/3d-printers/easy3dmaker/. 12. 3D Printing a 3D Honeycomb Infill concept.
![Fig. 2. Mapping of layer patterns from 3D MAKER software and printed model of Rectilinear strategy [2]](https://thumb-us.123doks.com/thumbv2/123dok_us/8806483.1774837/2.595.89.271.70.288/mapping-layer-patterns-maker-software-printed-rectilinear-strategy.webp)
![Fig. 7. Mapping of layer patterns from 3D MAKER software and printed model of Archimedeanchords strategy [2]](https://thumb-us.123doks.com/thumbv2/123dok_us/8806483.1774837/6.595.64.525.592.741/mapping-layer-patterns-maker-software-printed-archimedeanchords-strategy.webp)