Abstract: Condition monitoring and protection methods based on the analysis of the machine's current are widely used according to non-invasive characteristics of current transformers. It should be noted that, these sensors are installed by default in the machine control center. On the other hand, condition monitoring based on mathematical methods has been proposed in literature. However, they are model based and are too com-plex. Artificial neural network (ANN) methods are robust and less model dependent for fault diagnosis when the fault signature can be directly achieved using the sampling data. In this procedure, the state of internal process will be ignored. Therefore, generalized regression neural network (GRNN) based method is pre-sented in this paper that uses negative sequence currents (calculated from the machine's currents) as inputs to detect and locate an inter-turn fault in the stator windings of the induction motor. Turn-to-turn fault by changing the contact resistance and various numbers of shorted turns for realizing the fault severity has been modeled by Matlab/Simulink. The simulation and experimental results show that the proposed method is effective for the diagnosis of stator inter-turn fault in induction motor under the supply voltage unbalances.
Keywords:Diagnosis, Induction machine, turn-to-turn fault, GRNN, non-invasive method, negative se-quence current.
1. Introduction
Induction motors are widely used in a variety of appli-cations as a means of converting electric power to me-chanical work and range in size from a few watts to 10000 hp. These motors, indeed, are the workhorse of industrial plants [1]. Their failure and unexpected downtime can cause severe damage to the machine, interruption of pro-duction, and pursuing economic loss. Therefore, a condi-tion monitoring system is essential for modern industrial plants and manufacturing systems, which have to work continuously for extended hours [2]. Electrical faults of the induction motor can be classified into the rotor and stator faults and the most common electrical failure in this motor are stator-related faults, which are about 30%-40% [3], [4]. When inter-turn fault happens, the faulted turn will act as the secondary winding of an autotransformer and a very large circulating current will flow in the shorted turns. Therefore, it is very important to have a
careful analysis of the internal faults in induction motors to increase their useful life and reliability.
Consequently, during the last two decades, substantial investigations have been performed based on many fault indicators for the development of various methods in the area of fault diagnosis of electrical machines. Reference [4] classified the most important of these indicators as electromechanical, like magnetic leakage and linkage fluxes, currents, voltages, partial discharges, surges and mechanical, like acoustic, speed fluctuations and vibra-tions. It is worth mentioning that in fault diagnosis sys-tems, the sensing and analysis of fault indicator signals that include specific information is very important. When the most suitable monitoring method is selected, a variety of factors need to be considered. In the following, the most significant of these factors are presented [4], [5]:
The sensor should be simple and non-invasive. Fur-thermore, the sensor, measurement and fault diagnosis systems must be reliable and consistent. It should be noted, the severity of the fault and remaining run-life of the machine need to be quantified. Another point worth highlighting is, it is very hard and, in most situations, im-practical to satisfy all mentioned criteria, due to the com-plexity of the failure mechanisms and the nature of the fault. On the other hand, since the current transformers are usually installed by default in the machine control
cen-Stator Turn-to-Turn Fault Detection of Induction Motor
by Non-Invasive Method Using Generalized Regression
Neural Network
H. Yaghobi*(C.A.)
Iranian Journal of Electrical & Electronic Engineering, 2017. Paper received 31 July 2016 and accepted 8 April 2017.
*The authors is with the Faculty of Electrical and Computer Engineer-ing, Semnan University, Semnan, Iran.
E-mail: [email protected]. Corresponding Author: H. Yaghobi.
ter for different purposes, the monitoring schemes that de-pend on the study of these inputs (global external vari-ables) are mostly being notified [4].
In addition, this popularity is since the current sensors are entirely non-invasive. It has been proven that the con-dition monitoring of electrical machines based on current signature analysis method is an efficient technique for fault detection in industrial plants [6], [7]. This technique has been used successfully for the detection of broken rotor bars [8]–[10], eccentricity [11], bearing faults [12], and inter-turn short circuit faults [13]. It should be noted, a variety of methods are proposed to analyze internal faults based only on the global external variables such as the stator current signature analysis [14]-[16]. Internal fault diagnosis by negative sequence current or impedance is usual methods used due to the significant increase of these components under internal fault [17]. In fact, turn-to-turn faults in stator winding of induction motor can be detected by monitoring of the negative sequence current. More details about this indicator have been explained sec-tion 2.
In [18], the monitoring of the third harmonic of the motor supply current was also found to be an effective technique for the detection of the presence of stator faults. However, some motors usually have appreciable levels of inherent asymmetries and it may be possible that the residual asymmetries of the motor may lead to the appear-ance of the third harmonic component in the supply cur-rents, even when no faults are present in the motor. Therefore, this technique is only recommended when a high degree of inherent asymmetry of the motor is not ex-pected [4]. Furthermore, reference [17] proposed the pos-itive and negative sequence third harmonics (±3f) of line current as a criterion for stator inter-turn fault detection.
On the other hand, Artificial Intelligence (AI) methods for fault diagnosis and remaining useful life prediction of electrical machines have received considerable attention in recent years [19]. Different kinds of fault criteria have been used as ANN inputs in many investigations based on these techniques. The use of three currents [20], three voltages [21], three-phase shifts between the current and the voltage [22], and the magnetic flux linkages [23], [24] were reported.
This popularity is due to their generalization ability during fault detection that means ANNs are able to do sat-isfactorily even for unobserved fault. In addition, the sec-ond is their capability to be trained from the patterns of the relationships between the fault signatures and the re-lated operating situations of the system. It is worth men-tioning that in this procedure, the state of internal process is ignored. Consequently, the ANN method is robust and is an approach less model dependent for fault diagnosis when the fault signature can be directly achieved using the sampling data. In the other words, AI methods are of great useful methods in engineering to solve different dif-ficult problems such as fault detection. These techniques
significantly improve the accuracy of fault detection. However, the main issues raised by critics about the AI methods are the need of these methods to a large training time for learning the several possible combinations of the operating scenarios of the system. Therefore, in order to overcome the issues associated with the AI methods, a new method based on the using of the generalized regres-sion neural network (GRNN) has been proposed in this paper.
It is worth highlighting that the main characteristic of the GRNN compared to other networks is due to GRNN’s one-pass instantaneously learning [25]. The inherently parallel structure and the fast training procedure of the GRNN make it suitable for fault diagnosis problems in real time (especially when implemented on hardware sys-tems). In this paper, a non-invasive fault indicator based on negative sequence current for the diagnosis of turn-to-turn stator winding fault in an induction motor is pre-sented. In fact, negative sequence current will be produced by various factors, including supply unbalance and non-linearity motor effects. Therefore, before making any decision about the machine situation from monitoring of this criterion, negative sequence current arising from other effects must be eliminated. The aim of this paper is to present a reliable method with simple algorithm which eliminates these nuisance effects. These nuisance effects are eliminated by using GRNN in which, the state of in-ternal process will be ignored. The proposed method does not require the mathematical model and this makes its ap-plication simple and straightforward.
2. Monitoring of the negative sequence current for turn-to-turn fault detection
As stated earlier, turn-to-turn faults in stator winding of induction motor can be detected by monitoring of the negative sequence current. However, there are two main concerns for this detection. The first one is the three-phase supply voltage unbalance that generates negative se-quence current in a healthy motor. The second one is the non-linearity induction motor effects (saturation, rotor static eccentricity) and load variations that also produce negative sequence current [14]. Therefore, it is essential to separate out the negative sequence currents arising from supply voltage imbalance or from turn-to-turn fault in the motor. Reference [14] classified these causes that are capable of producing a negative sequence current. Measured negative sequence current in the motor can be expressed as follows [14]:
(1)
where, Isnis the negative sequence current arising from imbalance in the supply voltage, and Imnis the negative sequence current caused by the turn-to-turn fault in the motor. In the following, a procedure to calculate these
mn sn
n I I
I
negative sequence currents has been presented. First, volt-ages and currents of the stator in the abc reference frame are transferred to the qd0 reference frame and ids, iqs, vds, vqscan be obtained. Then positive and negative sequence components of phase voltages and currents have been cal-culated by the power decomposition method (PDT) [14]. The positive and negative sequence components can be written as follows:
(2)
(3)
Furthermore, equivalent circuit of induction motor cor-responds to a negative sequence component is presented in Fig. 1 (a). In addition, Fig. 1 (b) illustrates in a healthy motor how the negative sequence voltage Vsnaffects on the negative sequence current Isn. From Figs. 1 (a) and (b), (4)-(6) can be derived as:
(4)
(5)
(6)
Finally, the negative sequence current caused by the turn-to-turn fault (Imn) can be calculated as follows:
(7)
It should be noted, negative sequence current may arise because of several asymmetries.
Consequently, these effects must be eliminated from the negative sequence current before making any deci-sion. In some references [14], mathematical method is used to remove these effects from the measured negative sequence current and various aspects of this subject under different conditions were investigated. A brief explanation of this method is described here.
To remove the effects according to variations in load and voltage, it must find out how Imnchanges with load and voltage. This procedure is named characterization of the motor. In the following, Imnlstates the dependence of Imnon load variation, and Imnvstates the dependence of Imnon voltage variation. Furthermore, behavior of Imnl and Imnvis approximated by the positive sequence cur-rents Ipxand Ipyrespectively. Ipxestimates the active load. In fact, Ipxis in phase with supply voltage. Ipy approxi-mates magnetization current. In fact, Ipy represents the effects correspond to saturation in the motor, and Ipyis in quadrature with supply voltage. It is worth to note that, these two components (Ipxand Ipy) represent the negative sequence currents of the motor under healthy conditions created by load and voltage variation, i.e. [14]:
(8)
(9)
By using the (8) and (9), Imnlvhas been defined as: Imnlv=Imnl+Imnv. Factors β0, β1, β2, λ0, λ1and λ2are con-stants, which have been estimated by using the least squares method with the collected data. Therefore, the negative sequence current caused by turn-to-turn fault can be written as follows:
(10)
The final fault signature is given as:
(11)
On the other hand, the dependence of negative se-quence current on supply voltage imbalance, other non-linear motor effects (saturation, rotor static eccentricity) and load variations that also produce a negative sequence current must be eliminated. For this purpose, the negative sequence reactance can be written as [14]:
(12)
where, 1/γ0is the fundamental value of the negative se-quence reactance, γ1Vsnis for small dependence on Vsn, py
px p ny nx
n I jI I I jI
I ,
spy spx
sp sny snx
sn V jV ,V V jV
V n n r s r s
n j X X R jX
s R R z | ( ) 2 ) sin( n sn n sn n sn n sn
sn I R jI X I X V
V , T
) R X ( , ș
X ) (ș V I n n n n n sn sn arctan sin sn n
mn I I
I
mnlv sn
n
mn I I I
I* mnlv mn mnv mnl mn
mn I I I I I
I* ( )
py py
mnv I I
I O0 O1 O2 2
px px
mnl I I
I E 0 E1 E 2 2
py px n n sn n I I V X 2 5 4 3 2 1 0 1 2 cos 2 sin J J M J M J J J | (a) (b)
Fig. 1.(a) Steady state negative sequence equivalent circuit of induction motor. (b) Phasor diagram corresponds to negative
sequence components [14].
term γ2sin2φn+ γ3cos2φn is related to static eccentricity, γ4Ipxcorrespond to the change of the reactance with load and γ5I2
pycorrespond to the change of the reactance due
to flux saturation. Finally, by using the equations (8)-(11) and (6), (12), the negative sequence current caused by turn-to-turn fault can be written as follows:
(13)
It should be noted, in reference [14] it has been claimed that this technique is capable to detect single-turn faults. As has been noted by the authors, 2 steps are required for this method. First, factors γ0 –γ5 are estimated under changing supply voltage imbalance, and then, factors β0, β1, β2, λ0, λ1and λ2are estimated under the situation of load and voltage variation. In fact, a mathematical method based on equations (8)-(13) for elimination of nuisance effects has been proposed which will necessarily increase the computation time required for fault diagnosis. How-ever, it can be clearly seen that the use of this method for detection is a complicated and time-consuming procedure that may limit its application [17].
3. Modeling of Induction Motor
The model of a symmetrical three-phase induction ma-chine is well-known and is presented in [1] with sufficient details. On the other hand, turn-to-turn fault is one of the most complicated failures to detect. In fact, the variations of stator inductance due to turn-to-turn short circuit have to be taken into account.
Accurate calculation of the inductances of the faulty windings is the key for modeling the inter-turn short cir-cuit faults. Useful and straightforward model of an asym-metrical induction motor having inter-turn short circuits on the stator winding is presented in [16]. This model is based on general motor parameters; consequently it is not required to know detailed machine geometry or physical layout of the machine windings.
Two orthogonal axis models for simulation of an in-duction machines considering asymmetrical windings and inter-turn fault in the stator windings is presented in this reference. The first model supposes that an induction ma-chine has a different number of turns on each stator phase winding. Then, in order to model turn-to-turn fault, the second model supposes phase a (on the stator winding) has two windings in series, including un-shorted portion and shorted portion. In the other words, in this method mutual interaction between neighboring portions will be considered that is the important factor for modeling the inter-turn short circuit faults. However, magnetic satura-tion is not considered within this reference [16]. There-fore, this model has been developed by considering the saturation effect for the simulations in this paper. For this machine with a uniform air-gap, it has been assumed that iron saturation affects the q- and d-axis components in the same manner, so that a common saturation characteristic like the one shown in Fig. 2 (a) can be used for both these components. The matrix equation governing the flux link-age-current relationship of the machine can be expressed as follows:
(14)
where ψ=wbλ, and wbis the base frequency at which the reactance is computed. Furthermore,
(15) (16) » » » » » » » » ¼ º « « « « « « « « ¬ ª » » » » » » » » ¼ º « « « « « « « « ¬ ª » » » » » » » » ¼ º « « « « « « « « ¬ ª ' ' ' ' ' ' 0 0 0 0 0 0 0 0 0 0 0 0 0 or dr qr os ds qs ' lr m ' lr m m ' lr m ls m m ls m m ls or dr qr os ds qs i i i i i i x x x x x x x x x x x x x x 0 0 0 0 0 0 0 0 0 0 0 0 0 \ \ \ \ \ \ ) ( ), ( ' ' ' ' lr dr ls s ds lr qr ls s qs x x m s md x x m s
mq X X
\ \ \ \ \ \ ) ( ( ] 2 cos 2 sin )[ sin( 2 2 1 0 2 2 1 0 2 5 4 3 2 1 0 * py py p px py n n sn n sn n mn I I I I I I V V I I O O O E E E J J M J M J J J T
)
(
' 1 1 1 1 lr ls mm x x x
X
(a)
(b)
Fig. 2.(a) Saturation characteristic. (b) Approximation of sat-uration in qd components [1].
Consequently, the currents of the stator and rotor wind-ings can be calculated as follows:
(17)
(18)
Denoting the saturated value of the mutual flux link-ages by the superscript, sat, the saturated value of the mu-tual flux linkages per second in the q-axis is given by:
(19)
Grouping like terms and using (16), the above expres-sion can be written as:
(20)
Similarly, the saturated value of d-axis mutual flux linkage is given by:
(21)
In addition, according to Fig. 2 (b), the following rela-tionships can be obtained.
(22)
and )
ȥ
(ȥ i
)
ȥ
(ȥ
i s
md
s
ds x s
ds s mq
s
qs x s
qs ls ls
1
1 ,
) ȥ (ȥ
i ) ȥ (ȥ
i s
md 's dr x s dr s mq 's qr x s
qr lr' lr'
1 ' 1
'
,
) i (i x
ȥ 's
qr s qs m s mq s mq s
mq sat
mq \ '\ ,
\
s mq m
m s qr lr
m s qs ls
m sat
mq
x X x
X x
X
\ \
\
\ ' '
'
s md m
m s dr lr
m s ds ls
m sat
md
x X x
X x
X \ \ \
\ ' ' '
m sat m sat mq s
mq \
\ \
\ '
' , sat m
m sat md s
md \
\ \
\ '
'
(a)
(b)
Fig. 3.(a) Block diagram of the saturation module [1]. (b) Internal structure of the negative sequence current module.
(23)
The relationship between Δψ and ψmsatcan be deter-mined from the no-load test curve of the machine, as shown in Fig. 2 (a). Block diagram of the saturation mod-ule is presented in Fig. 3 (a). The part of the machine that is affected by saturation is highlighted in this figure. Based on the above discussions, the model of an induction machine that is presented in [16] has been developed by considering the saturation effect. It should be noted, by changing the number of shorted turns and by a current limiting resistance, the fault severity can be controlled in the model. This model is simulated and implemented in "Simulink" under the environment of Matlab. In this model, there are some main modules: the park transfor-mation module, the torque/speed module, the flux linkage module and the negative sequence current module. For in-stance, the internal structure of the negative sequence cur-rent module (one of the main module in this work) is shown in Fig. 3 (b). The content of this module is given in equations (1)-(7).
4. Simulation and experimental results
In this section, the relation between the different neg-ative sequence currents (In, Imn, Isn) and number of shorted turns based on extensive tests under normal and faulty operations have been determined.
4. 1. Structure of the stator turn-to-turn fault detec-tion, simulation measurement
In the following, the structure of turn-to-turn fault de-tection has been presented. First, faulty phase has been detected by the maximum peak value in the stator current. Then, the fault severity has been quantified based on neg-ative sequence current criteria. The machine used in this study is a 3 hp, 420V, 4-pole, 50 Hz. This induction motor is a star connected, squirrel cage and has 252 turns per phase on the stator.
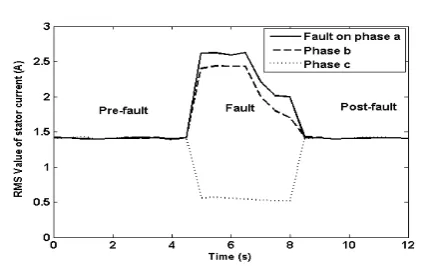
Figs. 4 (a) and (b) show the simulated RMS value of three-phase current of the stator at no-load and full-load under normal condition, respectively, while Figs. 4 (c) and (d) show these RMS values with 20 shorted turns in phase a respectively. According to Figs. 4 (c) and (d), it can be clearly seen that turn-to-turn fault occurring on one of the three-phases, causes a significant current appears in the corresponding phase. In fact, in the case of a turn-to-turn fault on one of the three-phases; the maximum peak value in the stator current is upon the phase where the fault has happened. With this indicator, the faulty phase can be lo-calized. Furthermore, the effect of this fault on other stator phase currents is smaller than the effect on current of the faulty phase. Then in the next step, by extensive
simula-tions the relation between the different negative sequence currents (In, Imn, Isn) and number of shorted turns have been determined.
As representative examples of the many simulations performed on this induction motor, some records due to space limitations are presented in Tables 1 and 2. In fact, the studied machine can be characterized by using these data. These data were obtained during acceleration from standstill to full speed. For example, negative sequence current vs. shorted turns arising from different causes under no-load and full-load conditions for 2.5% supply imbalance is presented in Fig. 5 (a). According to this fig-ure, it is obvious that the negative sequence current caused by the turn-to-turn fault (Imn) is proportional to the num-ber NS of shorted turns, i.e.
(24)
where k is constant and NS is number of shorted turns. Furthermore, a zoom in on the negative sequence cur-rent vs. shorted turns caused by diffecur-rent supply imbal-ances under full-load have been presented in Fig. 5 (b). As it can be seen from this figure, Isn is independent of the number of shorted turns in balanced supply condition. This is as predictable because this negative sequence cur-rent is related to supplying imbalance.
) (NS k
Imn
2 2
) ( )
( msaqt msadt
sat
m \ \
\
(a) Under normal condition at no-load.
(b) Under normal condition at full-load.
Furthermore, it can be clearly seen that unbalanced supply conditions can produce a comparable negative se-quence current and this current is approximately inversely proportional to the shorted numbers of turns in different supply unbalanced conditions. This means that stator turn-to-turn faults detection under unbalanced supply voltage conditions due to this non-linearity relationship is very difficult. In fact, the fault diagnosis method based on neg-ative sequence current should be able to discriminate be-tween the effects of turn shorts and supply imbalances. It should be noted that In, in Fig. 5 (a) is the total negative sequence current (sum of components Isn and Imn). Fig. 5 (c) shows the Imn vs. shorted turns under different sup-ply imbalances for full-load. Moreover, Fig. 5 (d) illus-trates this characteristic under different load conditions. According to these figures, Imn vs. shorted turns under different supply imbalances and different load situation is linear with the fault severity.
4. 2. Experimental test setup, implementation of faults and numerical measurement
In order to validate the structure of the proposed method in this paper, experimental data are also used. For this aim, some tests are performed on an experimental test (c) Under turn-to-turn fault on phase a, with 20 shorted turns
at no-load.
(d) Under turn-to-turn fault on phase a, with 20 shorted turns at full-load.
(a) Arising from different causes for 2.5% supply imbalance.
(b) Caused by different supply imbalances under full-load.
(c) Caused by turn-to-turn fault under full-load.
(d) Caused by turn-to-turn fault for 2.5% supply imbalance. Fig. 5.Negative sequence current vs. shorted turns.
bed. Experimental test setup is illustrated in Fig. 6. This test bed is designed to study the behavior of induction motor under different stator turn-to-turn fault from both balanced and different unbalanced supply voltages. In fact, a usual commercially accessible motor was disas-sembled and by rewinding its stator with several taps on each phase, different turn-to-turn fault is produced. The squirrel cage induction motor utilized in these tests is a three-phase, 50 Hz, and 3 hp.
This motor is loaded by an AC generator. Designed data acquisition card is used for sampling the stator cur-rent signals. Serial port interface has been utilized for con-necting the data acquisition card to the computer and these data are communicated to the computer. Then these data are processed and analyzed using the environment of Mat-lab. In order to compare the experimental and the simu-lated measurement, the some characteristics of the experimental data for different conditions are presented in Fig. 7. For instance, Figs. 7 (a) and (b) show the exper-imental RMS value of three-phase current of stator with 20 shorted turns on phase a under different conditions. Simulated one for these data is shown in Fig. 4. In addi-tion, Figs. 7 (c) and (d) show the negative sequence cur-rent vs. shorted turns arising from diffecur-rent causes under different conditions. A similar behavior is seen in Figs. 5 (a) and (c) respectively. The small difference between the experimental and the simulated measurement may be caused by the following reasons. The actual machine may have little abnormalities in assembling or construction. In addition, internal errors of sensors, different parameters used in simulation and measurement errors have an effect on this difference. However, regardless of these differ-ences, the curves of the simulated and experimental data have similar behavior.
5. Design of Fault Diagnosis System with the Aid of GRNN
The main issues raised by critics about the ANN based methods are the need of these techniques to an enormous training effort to train for all possible fault scenarios that is a complicated and time-consuming procedure [26]. However, it is worth highlighting that the key feature of the GRNN is the speed at which the neural network can be trained.
In the training procedure of these types of neural net-works, there are no training parameters, such as momen-tum and learning rate as in the case of the multilayered perceptron (MLP) neural network. The main feature of the GRNN compared to other networks is due to GRNN’s one-pass instantaneously learning [25], [27]. In fact, the
NS No-Load (mA) Full-Load (mA)
In Isn Imn In Isn Imn
0 0.0007 0 0.0007 0.0007 0 0.0007
2 107 0 107 110 0 110
4 215 0 215 222 0 222
6 326 0 326 336 0 336
8 439 0 439 452 0 452
10 554 0 554 570 0 570
12 671 0 671 690 0 690
14 791 0 791 812 0 812
16 912 0 912 936 0 936
18 1035 0 1035 1062 0 1062
20 1161 0 1161 1190 0 1190
Table 1. Supply imbalance-0%
NS No-Load (mA) Full-Load (mA)
In Isn Imn In Isn Imn
0 197.5 197.4 0.0076 197.3 197.3 0.01
2 291.2 164.8 126.3 294.1 164.1 130
4 394.9 145.3 249.6 401.1 144.6 258.5
6 504 133.4 370.6 513.3 132.7 380.6
8 616.7 125.6 491 629.1 125.1 504
10 732.4 120.4 612 747.8 119.9 627.9
12 850.8 116.7 734 869 116.3 752.7
14 971.7 114.2 857.5 992.6 113.7 878.9
16 1095 112.3 982.6 1119 111.9 1007
18 1221 111 1110 1247 110.6 1136
20 1349 110.2 1238 1377 109.7 1268
Table 2. Supply imbalance-2.5%
Fig. 6.Experimental test setup. (a) Experimental RMS value of three-phase current of stator with 20 shorted turns on phase a under no-load condition.
inherently parallel structure and the fast training proce-dure of the GRNN make it suitable for fault detection problems in real time. Some advantages of the GRNN over other artificial neural networks are summarized in the following [27], [28].
•The GRNN networks don’t require pre-decision on
the number of layers and hidden neurons.
•There is no require setting the initial weights and no connection exists between learning and recalling proce-dures in these kinds of neural networks.
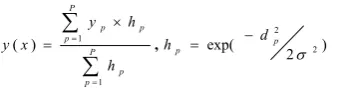
Therefore, in this research, GRNN is used in the design of fault diagnosis system and non-invasive criterion, i.e. negative sequence current is considered as efficient indi-cators of stator fault. GRNN is a kind of RBF neural net-work suitable for function approximation and performs regression where the target variable is continuous. The structure of the GRNN is presented in Fig. 7. This archi-tecture includes input, pattern, summation and output layer. The first layer is the input-layer and nodes in this layer do not perform any computation. The number of neurons in this layer is equal to the number of independent features and neurons in input-layer merely distribute input features to all the nodes in the pattern layer. Pattern layer calculates the Euclidean distance between input vector values and centers of radial basis functions. The third layer is summation layer and there are two nodes in this layer. One node is the denominator unit, and the other node is the numerator unit. The denominator unit adds to-gether the weight values coming from each of the pattern nodes. The numerator unit adds together the weight values multiplied by the aim value for each pattern node. The fourth layer is the decision or output layer. This layer di-vides the value collected in the numerator unit by the value in the denominator unit and uses the consequence as the predicted aim value [27]. The foundation for re-gression is finding relations between output values Y and input patterns X. If it is assumed that X is new input vari-able containing known inputs, it is possible to define the Euclidean distance as in (25):
(25)
Using this Euclidean distance, GRNN estimates the output vector Y of the pattern X as in (26):
) .(
) (
2
p T
p
p x x x x
d
(b)Experimental RMS value of three-phase current of stator with 20 shorted turns on phase a under 20% rated load
condi-tion.
Fig. 8.The architecture of the GRNN [27].
(c) Negative sequence current vs. shorted turns under full-load.
(d) Negative sequence current vs. shorted turns under 2.5% supply imbalance.
Fig. 7.Experimental RMS value of three-phase current of sta-tor and negative sequence current vs. shorted turns under
dif-ferent conditions.
(26)
where, is an adjustable smoothing parameter.
After the GRNN is trained, the next step is to ensure its performance, i.e. how it behaves to an arbitrary input which is not in the training set. In order to verify this per-formance, various sets of inputs are selected. As represen-tative examples of the many tests performed to evaluate the performance of GRNN, details of the two test cases due to space limitations is presented in Tables 3 and 4.
These test points that are obtained by the simulated measurement with different contact resistance are consid-ered as inputs for testing the GRNN. Then the GRNN es-timates the number of shorted turns. Test results show that the GRNN is able to approximate the number of shorted turns in an acceptable error.
5. 1. Training database
According to extensive simulations, the following set
of diagnostic features has been proposed for data process-ing.
Isn: is the negative sequence current arising from im-balance in the supply voltage, Imn: is the negative se-quence current caused by the turn-to-turn fault in the motor, In: is the total negative sequence current (sum of components Isn and Imn), rext:is the contact resistance, NS: Number of shorted turns, L: Load, V: supply voltage, Si: supply voltage imbalance.
In the other words, data sets for GRNN have been pre-pared, based on these diagnostic criteria, i.e. the following vectors are defined as input and target data for training and testing the GRNN:
Input data: V, rext , In, Isn, Imn, and Target data: NS, L, Si.
Input vectors for training and testing procedure of GRNN have been obtained from simulation's measure-ments of the motor under different load conditions and supply voltage imbalances. In addition, stator inter-turn faults with different severity are considered in this motor.
An extensive database, containing 8400 records has been created. Training data contained 5600 input records; however, testing data had 2800 records. These data for training and testing procedure are independent. In order to build these data, the variation range of load conditions, supply voltage imbalances, contact resistance and short circuit turn ratio needs to be determined first. In this re-search, the variation range of the load is set as 0, 25%, 50%, 75%, and 100%, the variation range of the contact resistance is set as 0, 0.1, 0.2, and 0.5 ohm and the short circuit turn ratio varies from 0% to 40% by 2% step size. Furthermore, supply voltage imbalances have been varied from -2.5% to 2.5% by 0.25% step size. So total, 8400 cases that 8400=5 (different load conditions) 4 (different contact resistance) 21 (short circuit turn ratio) 20 (supply voltage imbalance) have been considered to build the training and testing data.
5. 2. Evaluate the performance of the fault diagnosis system
Designed fault diagnosis system was tested due to the cross-validation technique. The data for training and test-ing procedure was separated into 3 portions; two of them were used for training procedure; the third was used for the testing procedure. The GRNN training process is usu-ally carried out in 2 steps. A serious aspect of the training process is mainly represented by efficient selection of the center and standard deviation of the Gauss function, as this choice may effectively influence errors made by the estimator [27]. So, in designing of the GRNN, it is very significant to choose the optimum value of the (spread parameter). Procedure of approximation begins with find-ing the best spread value for GRNN to control the spread of the RBF functions. If spread value is small the activa-tion funcactiva-tion is very steep, consequently, the neuron with the weight vector nearby to the input will have a greater
) 2 exp( )
( 2
2
1 1
V
p p
P
p p
P
p
p p
d
h h
h
y x
y
u
¦
¦
,
Supplyimbalance=2.5 %, No-Load,rext= 0 (ohm)
In
(mA) Isn
(mA) Imn
(mA)
Actual NS
Predicted NS
197.5 197.4 0.0076 0 0
448.9 138.7 310.2 5 5
732.4 120.4 612 10 9.92
1033 113.2 919.8 15 14.85
1349 110.2 1238 20 20.01
1678 109.2 1569 25 25.02
2023 109.4 1913 30 29.83
2381 110.3 2271 35 34.92
2755 111.5 2643 40 40.08
Table 3.Number of shorted turns (NS) predicted by GRNN for Case 1
( ) p y
Supplyimbalance=2.5 %, No-Load,rext= 0.2 (ohm)
In
(mA) Isn
(mA)
Imn
(mA)
Actual NS
Predicted NS
197.5 197.4 0.00765 0 0
270 171.7 98.26 5 4.98
431.7 140.8 290.9 10 9.965
646.4 122.9 523.5 15 14.89
896 113.4 782.6 20 19.96
1172 108.4 1063 25 24.95
1469 106 1363 30 29.91
1786 105 1681 35 35.05
2122 105 2017 40 39.87
Table 4.Number of shorted turns (NS) predicted by GRNN for Case 2
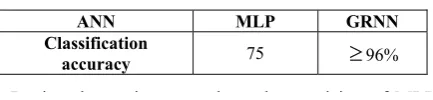
output than other neurons. The GRNN tends to react with the target vector associated with the nearest design input vector, and the accuracy of the detection will be increased but the generalization ability of the GRNN will be re-duced. As smoothing value becomes larger, more neurons contribute to the average and the slope of the activation function becomes smoother. The GRNN then operates as if it is taking a weighted average between target vectors whose design input vectors are nearby to the new input vector. In this condition, the generalization ability of the GRNN will be increased and the accuracy of the detection will be reduced. In this study, the traditional trial-and-error technique is utilized to find the optimum spread value. To evaluate the proficiency of GRNN, its results are compared with MLP neural network. MLP network is trained and then tested with the same data due to a similar process that has been mentioned before. First fault detector uses MLP, and the second detector uses GRNN. The MLP is trained with the Batch Gradient Descent with Momentum. The results of the evaluation are shown in Table 5.
During the testing procedure, the precision of MLP neural network is around 75% (2100/2800) because the results of 700 testing data were incorrect in this neural network. Furthermore, the results of 112 testing data were incorrect in GRNN. Consequently, the accuracy is 96% (2688/2800). In fact; the results illustrate that the perform-ance of GRNN is better than MLP in terms of accuracy.
6. Conclusion
Detection of stator turn-to-turn faults occurrence and its exact location under supply voltage unbalances are too complex. This mainly because the effect caused by turn-to-turn faults and supply voltage unbalances on the stator current is similar. This paper presents, the application of GRNN to the development of a new approach to detect and locate stator turn-to-turn fault in the induction motor under supply voltage unbalances. On the other hand, ANN based methods suffer from the drawback that they need large learning time for training the all possible fault sce-narios. Consequently, in order to overcome this problem, the proposed method uses a GRNN. It is worth highlight-ing that GRNN networks with high generalization ability, are able to do satisfactorily even for unobserved scenario. Another point worth highlighting is the GRNN trains in-stantaneously in one-pass which causes them faster to train, compared to other neural networks. The required decision in the proposed method is made using negative sequence current analysis. The main feature of the
pro-posed technique is its ability to detect the stator turn-to-turn fault using the non-invasive method. A possibility of identifying the location of the faulty phase, the fault sever-ity and the degree of supply voltage unbalance is the other features of the proposed technique. Finally, the satisfac-tory operation of the proposed technique has been verified via both simulation and experimental results under the load variations and supply voltage unbalance.
Acknowledgment
The author wishes to thank Mr. Ghanbari in providing the experimental test setup and testing laboratory.
References
[1] C. M. Ong, “Dynamic simulation of electric ma-chinery using Matlab/Simulink,” 2nd ed., Prentice Hal, New Jersey, 1998.
[2] R. Roshanfekr, and A. Jalilian, “Analysis of rotor and stator winding inter-turn faults in WRIM using simulated MEC model and experimental results”, Electric Power Systems Research, Vol. 119, pp. 418-424, 2015.
[3] F. Bagheri, H. Khaloozadeh, and K. Abbaszadeh,“Stator fault detection in induction machines by parameter estimation using adaptive kalman filter”, Iranian Journal of Electrical & Elec-tronic Engineering, Vol. 3, Nos. 3& 4, pp. 72-82, Jul. 2007.
[4] M. D. Negrea, “Electromagnetic flux monitoring for detecting faults in electrical machines,” Ph.D.dissertation, Helsinki University of Technol-ogy, Laboratory of Electromechanics, Helsinki, Finland, 2007. Available at http://lib.tkk.fi/Diss/isbn9512284774.
[5] H.Yaghobi, K.Ansari, and H.Rajabi mashhadi, “Stator Turn-to-Turn Fault Detection of Synchro-nous Generator Using Total Harmonic Distortion (THD) Analyzing of Magnetic Flux Linkage”, Iran-ian Journal of Science and Technology Transac-tions of Electrical Engineering (IJSTE), 2013, Vol. 37, No. E2, pp 161-182.
[6] L. Xu, L. Sun, L. Xu, and G. Xu, “ Improvement of the Hilbert method via ESPRIT for detecting rotor fault in induction motors at low slip,” IEEE Trans. Energy Convers., Vol. 28, No. 1, pp. 225–233, 2013.
[7] M.P. Sanchez, and et al. , “ Application of the tea-ger–kaiser energy operator to the fault diagnosis of induction motors,” IEEE Trans. Energy Con-vers., Vol. 28, No. 4, pp. 1036-1044, 2013. [8] B. Xu, L. Sun, L. Xu, and G. Xu, “ An
ESPRIT-SAA-based detection method for broken rotor bar fault in induction motors,” IEEE Trans. Energy Convers., Vol. 27, No. 3, pp. 654-660, 2012. [9] J. Martinez, A. Belahcen, and A. Arkkio, “Broken
bar indicators for cage induction motors and their
ANN MLP GRNN
Classification
accuracy 75
t
96%D i h i d h i i f MLP
Table 5. The results of the evaluation
relationship with the number of consecutive broken bars”, IET Electr. Power Appl., Vol. 7, No. 8, pp. 633-642, 2013.
[10] S. M. A. Cruz, “An active-reactive power method for the diagnosis of rotor faults in three-phase in-duction motors operating under time-varying load conditions,” IEEE Trans. Energy Convers., Vol. 27, No. 1, pp. 71-84, 2012.
[11] T. Ilamparithi, and S. Nandi, “Detection of eccen-tricity faults in three-phase reluctance synchronous motor,” IEEE Trans. Ind. Appl.,Vol. 48, No. 4, pp. 1307-1317, 2012.
[12] E. Bouchikhi, V. Choqueuse, and M. Benbouzid, “Current frequency spectral subtraction and its contribution to induction machines bearings con-dition monitoring,” IEEE Trans. Energy Convers., Vol. 28, No. 1, pp. 135-144, 2010.
[13] P. C. M. Lamim Filho, R. Pederiva, and J. N. Brito, “Detection of stator winding faults in induction ma-chines using flux and vibration analysis- A review,” Mechanical Systems and Signal Processing, Vol. 42, pp. 377–387, 2014.
[14] M. Arkan, D. Kostic-Perovic, P. J. Unsworth, “On-line stator fault diagnosis in induction motors,” IET Electr. Power Appl., Vol. 148, No. 6, pp. 537–574, 2001.
[15] S. Chen, and R. Zivanovic, “Modelling and simu-lation of stator and rotor fault conditions in induc-tion machines for testing fault diagnostic techniques,” International Transactions on Electri-cal Energy Systems, Vol. 20, pp. 611-629, 2010. [16] M. Arkan, D. Kostic-Perovic, and P. J. Unsworth,
“Modelling and simulation of induction motors with inter-turn faults for Diagnostics,” ELSEVIER, Electric Power Systems Research, Vol.75, No.1, pp. 57-66, 2005.
[17] Q. Wu, and S. Nandi, “Fast single-turn sensitive stator inter-turn fault detection of induction ma-chines based on positive- and negative-sequence third harmonic components of line currents,” IEEE Transactions on Industry Applications, Vol. 46, No. 3, pp. 974-983, Jun. 2010.
[18] S. M. A. Cruz, A. J. M. Cardoso, “Diagnosis of sta-tor inter-turn short circuits in DTC induction mosta-tor drives,” Proc. of Int. Conf. Rec. IEEE IAS Annu. Meeting, pp. 1332–1339, 2003.
[19] J. B. Ali, B. C. Morello, L.Saidi, S. Malinowski, and F. Fnaiech, “Accurate bearing remaining useful life prediction based on weibull distribution and ar-tificial neural network,” Mechanical Systems and Signal Processing, Vol. 57, pp. 150-172, 2015. [20] Y. D. Nyanteh, S. K. Srivastava, C. S. Edrington,
and D. A. Cartes, “Application of artificial intelli-gence to stator winding fault diagnosis in perma-nent magnet synchronous machine,” Electric Power Systems Research, Vol. 103, pp. 201-213, 2013.
[21] Z. Chilenguea, J. A. Denteb, and P. J. Costa Bran-cob, “An artificial immune system approach for fault detection in the stator and rotor circuits of in-duction machines,” Electric Power Systems Re-search, Vol. 81, pp. 156-169, 2011.
[22] M. Bouzid, G. Champenois, N. Bellaaj, L. Signac, and K. Jelassi, “An effective neural approach for the automatic location of stator inter-turn faults in induction motor,” IEEE Trans. Ind. Electron., Vol. 55, No. 12 ,pp.4277–4289, Dec. 2008.
[23] H. Yaghobi, H.R.Mashhadi, and K.Ansari, “Artifi-cial neural network approach for locating internal faults in salient-pole synchronous generator”, EL-SEVIER, Expert Systems with Applications, Vol. 38, pp.13328–13341, 2011.
[24] H. Yaghobi, K.Ansari, and H.Rajabi mashhadi, “Analysis of Magnetic Flux Linkage Distribution in Salient-Pole Synchronous Generator with Dif-ferent Kinds of Inter-Turn Winding Faults”, Iranian Journal of Electrical & Electronic Engineering, Vol. 7, No. 4, pp.260-272, Dec. 2011.
[25] J. Z. Sikorska, M. Hodkiewicz, and L. Ma,“ Prog-nostic modelling options for remaining useful life estimation by industry ,”Mechanical Systems and Signal Processing, Vol. 25, pp. 1803-1836, 2011. [26] M. R. Aghamohammadi, “Static security
con-strained generation scheduling using sensitivity characteristics of neural network,” Iranian Journal of Electrical & Electronic Engineering, Vol. 4, No. 3, pp. 104-124, Jul. 2008.
[27] K. Seethalekshmi, S. N. Singh, and S. C. Srivas-tava, “Synchrophasor assisted adaptive reach set-ting of distance relays in presence of UPFC,” IEEE System Journal, Vol. 5, No. 3, pp.396–405, 2011. [28] P. Picton, Neural networks, Palgrave Macmillan
Publisher, pp.102–109, ISBN: 9780333948996, 2000.
Hamid Yaghobi was born in Sari, Iran on 1978. He received his B.Sc. degree in Electrical Engi-neering from K.N.Toosi Univer-sity of Technology in 2000, Tehran, Iran, M.Sc degree in Elec-trical Engineering from Ferdowsi University in 2002, Mashhad, Iran and his Ph.D. in electric machinery from the Department of Electri-cal Engineering of Ferdowsi University, Mashhad, Iran in 2011. He is currently an Assistant Professor at Semnan University. His research interests are modeling and fault diagnosis, design and protection of electrical machines.
![Fig. 1. (a) Steady state negative sequence equivalent circuit ofinduction motor. (b) Phasor diagram corresponds to negativesequence components [14].](https://thumb-us.123doks.com/thumbv2/123dok_us/27559.2003137/3.595.62.282.458.711/steady-negative-sequence-equivalent-ofinduction-corresponds-negativesequence-components.webp)
![Fig. 2. (a) Saturation characteristic. (b) Approximation of sat-uration in qd components [1].](https://thumb-us.123doks.com/thumbv2/123dok_us/27559.2003137/4.595.82.258.449.714/fig-saturation-characteristic-approximation-sat-uration-qd-components.webp)
![Fig. 3. (a) Block diagram of the saturation module [1]. (b) Internal structure of the negative sequence current module.](https://thumb-us.123doks.com/thumbv2/123dok_us/27559.2003137/5.595.126.534.271.727/block-diagram-saturation-internal-structure-negative-sequence-current.webp)
![Fig. 8. The architecture of the GRNN [27].](https://thumb-us.123doks.com/thumbv2/123dok_us/27559.2003137/9.595.316.531.88.213/fig-the-architecture-of-the-grnn.webp)