Vol. 48, No. 1, Spring 2016, pp. 41- 51 )AIJ-EEE)
٭
Corresponding Author, Email: [email protected]
Analysis of Reliability Indices in Future Multi-Microgrids
Under Optimum Operation of Small Scale Energy
Resources Considering Uncertainty
N. Nikmehr
1and S. Najafi Ravadanegh
2*1- Msc. Student, Smart Distribution grid Research Lab, Azarbaijan Shahid Madani University, Tabriz, Iran. 2- Associate Professor, Smart Distribution grid Research Lab, Azarbaijan Shahid Madani University, Tabriz, Iran.
Received October 23, 2015, Accepted May 2, 2016
ABSTRACT
In this paper, Multi-Microgrids (MMG) are considered as future smart distribution grids, in which small
scale energy resources (SSER) are main power generation units with small scales. Optimal operation of
microgrids in defined intervals is carried out to achieve economic conditions in distribution systems. The
defined operating problem is optimized using a heuristic algorithm considering uncertainties in loads and
renewable energy resources (RERs). The probability density functions (PDFs) are used to encounter with
the uncertainties. The total cost of the network is minimized by the algorithm. Then, each MG is evaluated
from reliability point of view. Some new introduced reliability indices in the literature for MGs are used to
evaluate the MGs reliability and costs. In proposed structure, the MGs are in interconnected mode and there
is power exchanging between MGs. The particle swarm optimization (PSO) algorithm is applied to optimal
power dispatch and the obtained results are compared by Monte Carlo simulation (MCS) method.
KEYWORDS
1. INTRODUCTION
With rapid escalation in fossil fuel price as well as sharp increase in the capital cost of new central generating plant, there is a focused attention on alternate generating system with higher efficiency of energy use.
Under deregulation and restructuring of power system, electricity market becomes highly competitive. Today, micro-grid, due to its major technological and regulatory innovation of its small-scale has become enabling to compete with traditional centralized electricity plant. as beneficial for power quality and reliability of supply to end-users, micro-grid is going to become an attractive alternate source of power to industry, many utilities, commercial buildings, and many other places [1]-[2].
A typical microgrid (MG) structure consists of non-dispatchable units (wind turbines and solar photovoltaic cells), dispatchable units such as micro turbines, fuel cells and combined heat and power (CHP) plants. There is a single point of connection to main grid called point of common coupling (PCC). Each LC (Local Controller) receives its set points from MG central controller (MGCC) [3]. Authors in [4] proposed a value-based method of selection of optimal types, sizes, and locations of DGs, out of fuel cells, mini gas turbines, and solar PV, after proper codification in genetic algorithms (GA) method. In [5] a unit commitment operation has been solved in a micro-grid considering optimal fuel consumption with constraints of local heat and electricity demand balance as well as provision for certain minimum reserve power. Authors in [6] combined the MG power dispatch and network reconfiguration to benefit the whole system. The bio-inspired algorithms are adopted to solve the problem. A stochastic energy schedule model for a MG with intermittent renewable energy sources and plug-in electric vehicles (PEVs) is proposed plug-in [7] so as to minimize the operation cost and power losses. Studies show that connecting multiple MGs (to make a distribution system with networked MGs) can improve the operation and reliability of the system [8]–[9]. Fathi and Bevrani [10] studied the energy consumption scheduling of connected multi-MGs (MMG) considering demand uncertainty. Authors in [11] proposed a cooperative power dispatching algorithm of interactions among networked MGs to minimize the network operational cost. A decentralized power dispatch model for the coordinated operation of multiple MGs and a distribution system has been proposed in [12].
MMGs have great impact on the reliability of distribution system and system reliability has always been an important objective for design and operation of power systems. In [13] all aspects of a Multi-Microgrid in order to determine optimal operation of renewable generations without considering reliability evaluation has been
discussed. Smart distribution grids inject important challenges to the reliability evaluation [14]. Authors in [15] propose an analytical method to evaluate the reliability of customers contracted with MGs including DGs and the impact factor is modified to obtain the interruption cost.
The contributions of the paper are as follow. In this paper considering probabilistic environment, the optimal power dispatch problem is solved under market operations and reliability. The uncertainties are in load and generated powers by renewable small scale energy resources (SSERs) in the presence of emission cost function. The problem is solved with a heuristic algorithm, namely particle swarm optimization (PSO). Then, the Monte Carlo Simulation (MCS) are used to compare the results. The reliability indices in the proposed paper are evaluated in proposed structure of MGs. In proposed structure, the MGs are in interconnected mode and there is power exchanging between MGs.
2. PROBLEM MODELING
Traditionally distribution networks operation and planning studies were mainly in deterministic environment. Uncertainties of the load forecasting and generated power are key issues in the smart distribution network scheduling and planning problems. Traditionally distribution networks operation and planning studies were mainly in deterministic environment. Uncertainties of the load forecasting and generated power are key issues in the smart distribution network scheduling and planning problems. The probabilistic analysis of distribution networks operation and planning can lead to flexible and robust network operation. In probabilistic analysis the input data have PDF. Based on the correlation between input and output variables, the obtained results from probabilistic analysis are also presented in probability distribution function (PDF) form. In order to handling load and generation uncertainty in optimal MMG power dispatch problem, the MCS method is incorporated. In this paper in order to consider the effect of uncertainties a sampling scenario is used for each hour. MCS technique using random numbers (samples) solves the problems under uncertainties in network parameters. This method is often used when the model is complex and nonlinear. MCS method can be summarized as follows [16]:
Step I. Creates a parametric model of the system as (1).
Y=h(x1,x2,…,xn) (1)
Step II. Generates a set of random inputs by using PDF
of uncertainty parameter as (2)
Step III. Evaluates the model and calculates the Yi.
Step IV. Repeat steps II and III for i=1:N.
Step V. Analysis the results of the simulation.
A. Probabilistic Modeling of Power
We generate samples from Weibull distribution for modelling wind speed uncertainty at wind turbines, which are subsequently converted into power production by using the power curve of the considered turbine model. This transformation is valid on the assumption that the characteristics of the wind are the same all over the wind plant at each instant [17].
The solar radiation has a high degree of uncertainty. It varies as a function of several factors such as environmental conditions, time of day, month, season, and orientation of the solar cell generator to the sun radiation among the rest. The solar radiation PDF is modeled by beta distribution function [18]. Solar system output power is related to the solar radiation. therefore, its output power modeling requires the solar radiation modeling. The output power as a function of radiation is stated as radiation-power curve [18]:
On the other hand, normal distributions are used to simulate the active load power [19].
The battery packs can operate as an uninterrupted power supply system in the MG. The battery packs are assumed that the initial charging batteries are 50 percent of total battery capacity. During the operation, battery packs can be charged when the total power output of DG units in MGs is higher than the total demands and if the output power of DGs in MGs is lower than the total demands, the batteries begin to discharge [20]:
ch arg e ,t gMG ,t l ,t gMG ,t l ,t
disch arg e ,t l ,t gMG ,t gMG ,t l ,t
P P P P P
P P P P P (3)
B. Cost modeling
The cost of primary energy often determines the cost of generated power by units. The fuel cost of WT and PV are considered zero. In this paper the coefficient of operation and maintenance (O&M) costs is proposed in [21]. The costs of operation and maintenance (CO&M) for
WT and PV is as (4):
O & M ,unit ,t O & M t ,unit
C K P
(4)
Fuel cell (FC) can produce electricity as long as fuel is being provided. The cost of generated power by FC achieve from (5):
t ,unit nl FC ,t
t ,FC
P C Cost
L (5)
In this paper Cnl and L are considered 0.76$/m3 and
9.7 kWh/m3, respectively.
Unlike FC, the efficiency of micro turbine (MT) increases with increasing supplied power. The cost function of generated power of MT is calculated by (6) and O&M costs is calculated based on (4) for each sample.
t ,unit nl MT ,t
t ,MT
P C Cost
L (6)
CHP is an extension of the idea of cogeneration to the single/multi family home or small office building and has a higher efficiency. The fuel cost of MT with CHP performance is as follow:
CHP ,t MT ,t CHP ,t
Cost Cost B (7)
rec T ,CHP ,t e ,MT ,t
CHP ,t MT ,t
b
( )
B Cost (8)
In other hand, composition of (7) and (8) concluded (9):
1
rec T ,t e ,t
CHP ,t MT ,t
b
( )
Cost Cost ( ) (9)
In this paper, εrec and b are assumed 0.95 and 80
percent, respectively.
In proposed structure, all MGs are able to exchange power with each other to fulfill the load-generation constraint. The transaction of power between MGs bring better economical circumstance for those of MGs in which the value of generation is higher than load consumption. Load interruption will occur if the generation in a MG be higher than consumption as well as other MGs cannot provide the demand of the MG. There are the following constraints to purchased and sold powers:
0 0
0 0
gMG ,t l ,t buy,tm sell,tm
gMG ,t l ,t buy,tm sell,tm
if P P >0 P , P
if P P <0 P , P (10)
The costs of purchased and sold power in MGs are described as bellow:
1 2 1 2
1
m1 m2
pur ,tm m m buy ,t ,m m
m
Cost c P (11)
1 2 1 2
1
m1 m2
sell ,tm m m sell ,t ,m m
m
Cost d P (12)
external grid can be described as bellow:
trans ,tm pur ,tm sell ,tm
Cost Cost Cost (13)
C. Reliability evaluation
In this paper, the reliability evaluation is done for each MG under probabilistic and uncertain behaviors of MG components. In proposed structure, the MGs are in interconnected mode and there is power exchanging between MGs.
As the wind speed and solar radiation cannot be maintained at a specified stable level a multi-state model is needed to reliability evaluation. In order to reduce the band sizes of the multi-state model, the multi-state model may be simplified using the rounding method and it is reasonable to use pre-specified multi-states in the case of actual systems. In this paper, a simplified multi-state model using a linear rounding method is proposed. The linear rounding method is described mathematically by (14) and (15), which share the ratio of probability linearly.
k 1 i
k i
P P
PB ( ) PB
P
(14)
i k
k 1 i
P P
PB ( ) PB
P
(15)
k 1 k
P P P
(16)
One of the reliability indices is loss of load capacity (LOL), which describes the capacity of loss of load (kWh). LOL is calculated based on power availability of each MG. Let LOLi be the loss of load obtained for the
ith contingency, with a probability of probi. Then the
expected power not served or loss of load expectation (EPNS or LOLE) is given by:
1
Nc i iEPNS LOL prob (17)
The reliability of the network or energy index of reliability (EIR) is then given by:
1
l
EPNS EIR
P (18)
In addition to mentioned indices, two other metrics of reliability which is proposed in [22], are calculated as (19) and (20). Renewable Energy Penetration (REP) is one of metrics that describes the percentage of demand covered by renewable energy (WT and PV units) in a MG. Another index which defines the fraction of the total installed conventional power generation over the average
load in a MG, namely MG Conventional (FC, MT and CHP units) Power Penetration (MCPP), is formulated in (20):
renewable energy produced in given time kWh load demand in given time kWh
REP
Total (19)
load demand of MG
Sum of rated power of conventional DGs
MCPP
Average (20)
Based on [20], MG economic indices, namely purchase probability (PP), Selling Probability (SP), expected power purchased (EPP) and expected power sold (EPS) are calculated in the paper. PP is the fraction of time that a MG purchases electricity from the distribution system and it is calculated as follow:
MG purchase power hours of MG operation Hours when
PP
Total
(21)
SP is the fraction of time that a MG sells electricity to the distribution system and it is calculated as follow:
MG sell power hours of MG operation Hours when
SP
Total
(22)
EPP is expected power that a MG purchases from the distribution utility in one year and EPS is expected power that a MG can sell to the distribution utility in one year.
In this paper, we set the cost of interruption in 1.75 USD($)/kWh as it is described in [23] for household consumption in each MG. We use the following equation to calculate the total interruption cost in each MG for the reliability index on a consumer side:
1 75
t
IC . EPNS (23)
3. PROBLEM FORMULATION
Proposed problem is a non-linear problem. Objective function includes generated power, purchased and sold powers, O&M and load interruption costs. In this problem, the cost of powers and pollutant emissions must be minimized.
Min : OF ( Ft ,op Ft ,em Ft ,i u)
t (24)
t,op
F =
gen ,ti
pur ,tm
sell ,tm +
O & M ,tit i t m m t i
Cost ( Cost Cost ) Cost
(25)
gen ,ti gen ,MT ,ti gen ,FC ,ti gen ,CHP ,ti
Cost Cost Cost Cost (26)
O & M ,ti O & M ,WT O & M ,PV O & M ,MT O & M ,FC O & M ,CHP
3 9
t,em ,
1 1
F = ( ( ))
j
ij gen tit j i
P
(28)
t,iu ,
F =
( t m)m
IC (29)
OF is cost function that is sum of costs of generated and transaction powers as well as cost of O&M. Other costs in objective cost are cost of pollutants emission and load interruption cost. In [24] characteristics of the
emissions and value of parameters
j and
j are given.Objective function is optimized by PSO algorithm. Problem constraints can be described as follow:
I.Power balance:
+
l ,t loss ,t gen ,ti buy ,tm sell ,tm
i m m
ch arg e ,tm disch arg e ,tm
m m
P P P ( P P )
( P P ) (30)
II.Power generation:
ti ti ti
Min , gen gen Max , gen
P P P (31)
III.Transaction power:
tm tm tm
Min , pur pur Max , pur
P P P (32)
tm tm tm
Min ,sell sell Max ,sell
P P P (33(
IV.Battery charge and discharge:
tm tm tm
Min ,disch arg e disch arg e Max ,disch arg e
P P P (34)
4. REVIEW OF PSO ALGORITHM
The PSO was first introduced by Kennedy and Eberhart which is based on the social behaviors of birds flocking or fish schooling [25]. Each particle adjusts its position according to its own best experience and the best experience of neighboring particles. PSO is a history based algorithm such that in each step particles use their own behavior associated with the previous iterations.
The position of the particle is changed by adding a velocity, vi(t) to the current position:
j 1 1 i i i x xjSj
(35)
i
1
i W Si c1 r1 pbest xi c2 r2 gbest xi
j j
S
)
36)c1 and c2 are acceleration constant in the range [0,2], r1 and r2 are uniform random value in the range of [0,1], Pbesti best previous position of particle i, gbest is best particle among all Pbest. Si and xi are velocity and position
vectors of particle i, respectively, j is number of iterations, W is Inertia weight factor, Iter is current iteration number and Wmin and Wmax are minimum and maximum inertia weights factor.
The flowchart of solving optimal power dispatch considering reliability indices by PSO is shown in Figure 1.
5. NUMERICAL STUDY
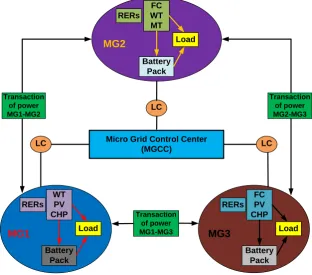
In this study a smart distribution grid with MMG structure as Figure 2 is considered for optimal commitment scheduling for a year considering MGs reliability. In proposed structure each MG interacts with other MGs through available lines between them. Each MG or small scale energy zone (SSEZ) contains some small scale generations. These generations are photovoltaic (PV), wind turbine (WT), micro gas turbine (MT), fuel cell (FC) and combined heat and power (CHP). Beside, in order to saving of surplus energy a battery package is considered for all MGs. Batteries can be charged in surplus generation circumstance or discharged in lack generation condition. the structure can be extended to a very big network with numerous MGs. every MG has a local controller (LC) associated with units/load which can receive its set points from MG central controller (MGCC). MGCC optimizes the MG operation based on SSERs availability. As mentioned before, the proposed stochastic framework would capture the uncertainty of the load and some RERs such as WT and PV output power variations simultaneously.
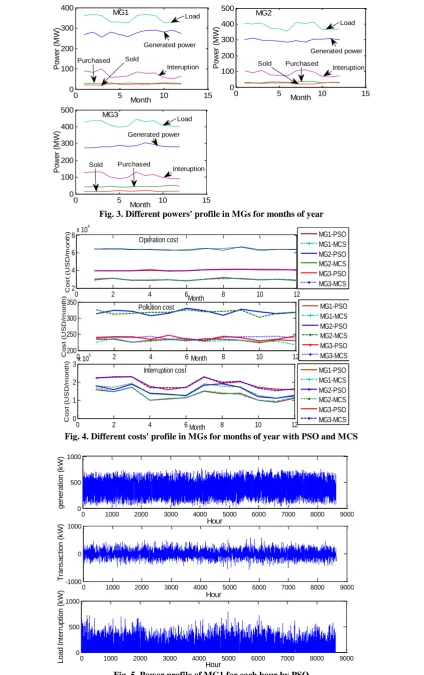
In order to indicate the probabilistic analysis of the problem, at Figure 3 the profile of different powers such as generation, purchased power, sold power, load and interruption of load in each MG are shown for each month of year according to mean values.
In above figure, the generated, purchased and sold powers of each MG are determined based on optimum values, so that costs associated with mentioned powers are minimized. As it was mentioned before, the objective function have three important sentences, operation cost ,which is included generated power cost, maintenance and transaction costs, pollution cost and load interruption cost. In Figure 4 the costs of each MG are shown for months of year. In other word, the simulation results for an year have been shown in month interval. All results can be illustrated in hourly or daily intervals. For example, the power profile for MG1 in hourly interval based on mean value for each hour is shown in Figure 5
PDF of wind speed
PDF of load demand PDF of solar radiation
PDF of PV power PDF of WT power
For j=1:iter
Initialization of power generation of CHP, FC and MT
Analysis of optimal power dispatch problem by PSO
Minimize objective function
Operation cost
(Fop)
Update powers of MGs
J=iter?
Record computation results of iter
End Emission cost
(Fem)
Load interruption
cost (Fiu)
For t=1:8760
T=t?
PDF of output results YES
NO
Calculate reliability indices for each MG Input data
YES
NO
Fig. 1. Flowchart of implementation of PSO on proposed problem
MG1
MG2
MG3 Micro Grid Control Center
(MGCC) LC
Load
Battery Pack RERs
FC WT MT
Load
Battery Pack RERs
WT PV CHP
Load
Battery Pack RERs
FC PV CHP
Transaction of power MG1-MG2
Transaction of power MG2-MG3
Transaction of power MG1-MG3
LC LC
0 5 10 15 0 100 200 300 400 MG1 Month Po w e r (M W )
0 5 10 15
0 100 200 300 400 500 MG2 Month Po w e r (M W )
0 5 10 15
0 100 200 300 400 500 MG3 Month Po w e r (M W ) Load Generated power Interuption
Purchased Sold Sold
Load Load Generated power Generated power Interuption Interuption Purchased Purchased Sold
Fig. 3. Different powers' profile in MGs for months of year
0 2 4 6 8 10 12
2 4 6 8x 10
4 Operation cost Month C o s t (U SD /m o n th )
0 2 4 6 8 10 12
200 250 300 350 Pollution cost Month C o s t (U SD /m o n th )
0 2 4 6 8 10 12
0 1 2 3x 10
5 Interruption cost Month C o s t (U SD /m o n th ) MG1-PSO MG1-MCS MG2-PSO MG2-MCS MG3-PSO MG3-MCS MG1-PSO MG1-MCS MG2-PSO MG2-MCS MG3-PSO MG3-MCS MG1-PSO MG1-MCS MG2-PSO MG2-MCS MG3-PSO MG3-MCS
Fig. 4. Different costs' profile in MGs for months of year with PSO and MCS
.
0 1000 2000 3000 4000 5000 6000 7000 8000 9000
0 500 1000 Hour g e n e ra ti o n (k W )
0 1000 2000 3000 4000 5000 6000 7000 8000 9000
-1000 0 1000 Hour T ra n s a c ti o n (k W )
0 1000 2000 3000 4000 5000 6000 7000 8000 9000
0 500 1000 Hour L o a d I n te rru p ti o n (k W )
100 200 300 0
100 200 300
Operation cost (USD/h)
F
re
q
u
e
n
c
y
0 0.5 1 1.5 2 2.5
0 50 100 150 200 250
Pollutant cost (USD/h)
F
re
q
u
e
n
c
y
0 1000 2000 3000
0 500 1000 1500 2000
Interruption cost (USD/h)
F
re
q
u
e
n
c
y
PSO Normal MCS Normal PSO Normal MCS Normal
PSO Normal MCS Normal
Fig. 6. Different costs' profile for MGs in PDF form
TABLE 1. Capacity outage probability table for MGs
Out of
service MG1 MG2 MG3
Individual probability
Cumulative probability
Individual probability
Cumulativ e probability
Individual probability
Cumulativ e probability
0 0.925849 1.0000 0.938844 1.0000 0.960958 1.0000
1500000 0.060038 0.074151 0.050844 0.061156 0.032662 0.039042
3000000 0.01409 0.014113 0.010301 0.010312 0.006359 0.00638
4500000 0.0000133 0.000023 1.03×10(-05) 0.000011 2.17×10-06 0.000021
TABLE 2. Reliability indices of proposed network
LOLE(MW/year) EIR(pu) REP(pu) MCPP(pu) LOLC(USD/year)
MG1 20.40271 0.9930 0.4529 1.3201 35704.76
MG2 28.15185 0.9912 0.2277 1.7511 49265.74
MG3 33.01839 0.9896 0.1855 1.77 57782.18
TABLE 3. Economic indices of proposed network
PP(pu) SP(pu)
From MG1
From MG2
From MG3
From Battery
Total To
MG1 To MG2
To MG3
To Battery
Total
MG1 - 0.1109 0.0866 0.6124 0.6709 - 0.1295 0.1808 0.0844 0.3291
MG2 0.1295 - 0.1087 0.6462 0.7002 0.1109 - 0.1750 0.0870 0.2998
MG3 0.1808 0.1750 - 0.7080 0.7823 0.0866 0.1087 - 0.0706 0.2177
TABLE 4. Expected power purchased and sold indices in MGs
EPP(MW/yr) ESP(MW/yr)
From MG1
From MG2
From MG3
From Battery
Total To
MG1 To MG2
To MG3
To Battery
Total
MG1 - 107.07 78.525 151.58 337.17 - 114.40 176.89 19.03 310.31
MG2 114.40 - 98.84 160.97 374.21 107.07 - 176.77 20.59 304.42
MG3 176.89 176.77 - 178.40 532.06 78.525 98.84 - 15.83 193.19
TABLE 5. Comparison of results in two methods
Method Operation cost
(×106) Pollutant cost
Interruption cost (×106)
Objective function
(×106) Run time (s)
MCS 1.6018401 9440.5 5.707334 7.318615 18647.13
0 2 4 6 8 10 12 25
30 35 40 45 50 55
Month
Pu
rc
h
a
s
e
d
p
o
w
e
r
(M
W
)
MG1 using PSO MG1 using MCS MG2 using PSO MG2 using MCS MG3 using PSO MG3 using MCS
Fig. 7. Expected purchased power (EPP) in each month of year
0 2 4 6 8 10 12
10 15 20 25 30 35 40
Month
So
ld
p
o
w
e
r
(M
W
)
MG1 using PSO MG1 using MCS MG2 using PSO MG2 using MCS MG3 using PSO MG3 using MCS
Fig. 8. Expected sold power (ESP) in each month of year
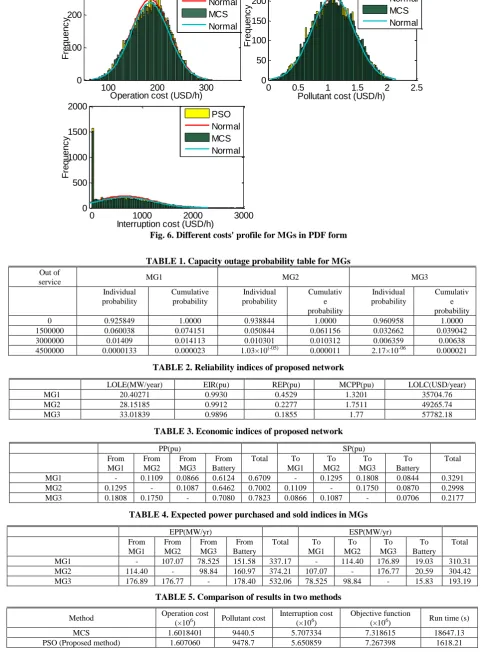
In Figure 6 the above calculated costs are shown in PDF form. In this figure the frequency of each cost for a year on the basis of monthly operation has been shown. Obtained results by PSO algorithm are compared with MCS method. In this comparison, obtained results by two methods are similar together.
The important studied scope in this paper is the reliability evaluation in MMGs smart distribution grids. In the case study, MGs are in interconnected mode and power exchanging between MGs is available. This case is assumed to have a wind turbine and also a PV system for MG1. The PV has a solar radiation PDF with 150 kW rated capacity and the forced outage rate (FOR) value equal to 0.04. The wind turbine with 200 kW rated power for each hour has FOR value equal to 0.04. In MG2 the rated power of WT is assumed 200 kW and the forced outrage rate is 0.03. As well as the rated capacity of PV in MG3 and FOR value are equal to 150 kW and 0.02, respectively. Table 1 using (14) and (15) describes the multi-state model for each MG. This model has 4 states for MGs. The individual probability of each state based on FOR values are described in Table 1. In last column of this table the cumulative probability using individual probability has been defined.
The reliability indices are calculated based on capacity outrage probability table for all MGs. The calculated
LOLE, EIR, REP and MCPP reliability indices for the proposed structure which were calculated by (17)-(20) are presented in Table 2.
In proposed paper, the optimal power dispatch problem is analyzed considering market operation environment. In order to calculate the economic indices in market operation, purchase probability, selling probability, expected power purchased and expected power sold are calculated for MGs in Table 3 and Table 4.
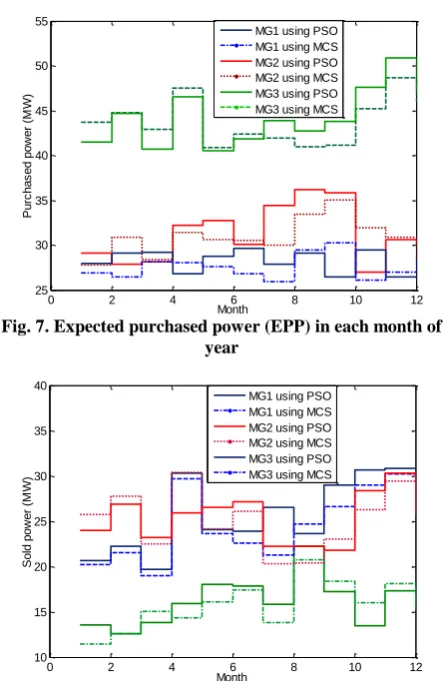
In Table 3, for each MG the fraction of hours of an year that the MG purchase or sell power from or to other MGs and battery packs is described. In Table 4 the amount of purchased or sold power which a MG buys or sells to other MGs and battery packs during a year is shown. In order to more explanation on EPP and EPS, Figure 7 and Figure 8 are provided. In these figures obtained results by PSO are compared with MCS.
In Figs. 7 and 8, EPP and ESP indices are described for each month of year. These indices are suitable for describing economic aspects of MGs in market operation environment.
To describe the advantages of PSO algorithms in compared MCS method, Table 5 is provided. Based on above table, the sum of operation, pollution and interruption costs using heuristic algorithm is less than MCS method and this is one of important advantages of the proposed algorithm. Also, the run time is less than MCS.
6. CONCLUSION
In this paper a framework for optimal power dispatch in interconnected MGs considering reliability and market operation of MGs is proposed. The uncertainty in MGs components such as SSERs and load are modeled and simulated by numerical analysis. The proposed operation methodology can be applied for autonomous and non– autonomous MMGs scenarios. In this paper some important aspects of interconnected MG operation constraints such as MGs reliability, operation cost and pollution emission are considered. Based on the probabilistic modeling, all outputs are given by a distribution function including mean and standard deviation. The reliability indices are calculated based-on capacity outrage probability for all MGs. The calculated LOLE, EIR, REP and MCPP reliability indices for all MG is given in detail. Considering the results, the operation, pollution, interruption costs and execution time, obtained by PSO are less than MCS method.
7. NOMENCLATURE
Y Vector of uncertain output variables. x Vector of uncertain input variables. N Number of variables.
Pcharge,t
Pdischarge,t
Discharging power by battery packs at hour t.
PgMG,t Generated power by each MG at hour t.
CO&M,unit,t Operation and maintenance cost at hour t.
KO&M
operation and maintenance cost coefficient.
Pt,unit Generated power by each unit at hour t.
Cnl Natural gas price [$/m3].
L Natural gas low-hot value [kWh/m3].
BCHP,t
Cost reduction of MT power generation at hour t.
rec
Heat recovery factor.t,FC
Efficiency of FC at hour t.
t,MT
Efficiency of MT at hour t.
T,CHP,t
Total efficiency of CHP at hour t.
e,MT,t Electrical efficiency of MT at hour t.
b Boiler efficiency.
Costpur,tm Purchased power cost by MG m at hour t.
Costsell,tm Sold power cost by MG m at hour t.
Costtrabs,tm
Transaction power cost by MG m at hour t.
OF Objective function.
ij
Emission factor of pollutant j in unit i.
ij
Price coefficient of pollutant j.
Pbuy,t,m1-m2
Purchased power by MG m1 from MG m2 at hour t.
Psell,t,m1-m2
Sold power by MG m1 to MG m2 at hour t.
Ft,op Operation cost at hour t.
Ft,em Emission cost at hour t.
Ft,iu Interruption cost at hour t.
Pl,t Load consumption at hour t.
Ploss,t Power losses at hour t.
c, d Purchased and sold power coefficients.
k state number of the simplified multi-state model.
PBk Probability of state k.
Pk Power of state k.
CostFC,t Generated power cost by FC at hour t.
CostMT,t Generated power cost by MT at hour t.
CostCHP,t Generated power cost by CHP at hour t.
ACKNOWLEDGEMENT
This work has been supported by a grant/research fund number ASMU/14544-15/14597 from Azarbaijan Shahid Madani University.
REFERENCES
[1]N. Hatziargyriou, H. Asano, R. Iravani, and C. Marnay, “Microgrids,” IEEE Power Energy Mag., vol. 5, no. 4, pp. 78–94, Jul.–Aug. 2007.
[2]R. H. Lasseter, “MicroGrids,” in Proc. IEEE Power Eng. Soc. Winter Meeting, Jan. 27–31, 2002, vol. 1, pp. 305–308.
[3]N. Nikmehr, and S. Najafi-Ravadanegh, “A study on optimal power sharing in interconnected microgrids
under uncertainty,” International Transactions on Electrical Energy Systems, vol. 26, no. 1, pp. 208– 232, 2015.
[4]J. Teng, Y. Liu, C. Chen, and C.-F. Chen, “Value-based distributed generator placements for service quality improvements,” Int. J. Elect. Power Energy Syst., vol. 29, no. 3, pp. 268–274, Mar. 2007.
[5]C. A. Hernandez-Aramburo, T. C. Green, and N. Mugniot, “Fuel consumption minimization of a microgrid,” IEEE Trans. Ind. Appl., vol. 41, no. 3, pp. 673–681, May/Jun. 2005.
[6]T. Sicong, X. Jian-Xin, and S. K. Panda, “Optimization of distribution network incorporating distributed generators: An integrated approach,” IEEE Trans. Power Syst., vol. 28, no. 3, pp. 2421–2432, Aug. 2013.
[7]W. Su, J. Wang, and J. Roh, “Stochastic energy scheduling in microgrids with intermittent renewable energy resources,” IEEE Trans. Smart Grid, vol. 5, no. 4, pp.1876 - 1883, 2014.
[8]W. Su, J. Wang, K. Zhang, and A. Q. Huang, “Model predictive controlbased power dispatch for distribution system considering plug-in electric vehicle uncertainty,” Electric Power Syst. Res., vol. 106, pp. 29–35, Jan. 2014.
[9]H. S. V. S. Kumar Nunna and S. Doolla, “Multiagent-based distributed energy resource management for intelligent microgrids,” IEEE Trans. Ind. Electron., vol. 60, no. 4, pp. 1678–1687, Apr. 2013.
[10] M. Fathi and H. Bevrani, “Adaptive energy consumption scheduling for connected microgrids under demand uncertainty,” IEEE Trans. Power Del., vol. 28, no. 3, pp. 1576–1583, Jul. 2013.
[11] M. Fathi and H. Bevrani, “Statistical cooperative power dispatching in interconnected microgrids,” IEEE Trans. Sustain. Energy, vol. 4, no. 3, pp. 586– 593, Jul. 2013.
[12] Z. Wang, B. Chen, J. Wang, M. M. Begovic and C. Chen "Coordinated energy management of networked microgrids in distribution systems", IEEE Trans. Smart Grid, vol. 6, no. 1, pp.45 -53, 2015.
[13] N. Nikmehr and S. Najafi Ravadanegh, “Optimal Power Dispatch of Multi-Microgrids at Future Smart Distribution Grids,” IEEE Trans. Smart Grid, vol. 6, no. 4, pp. 1648 - 1657, July 2015.
[14] Z. Bie, P. Zhang , G. Li , B. Hua , M. Meehan and X. Wang, “Reliability evaluation of active distribution systems including microgrids,” IEEE Trans. Power Syst., vol. 27, no. 4, pp.2342 -2350, 2012.
[15] J.A. Martinez-Velasco, G. Guerra, "Parallel Monte Carlo approach for distribution reliability assessment," IET Gener. Transm. Distrib., vol. 8, no. 11, pp. 1810– 1819, 2014.
[16] Y.R. Rubinstein, D.P. Kroese. Simulation and the Monte Carlo method. 2nd ed. John Wiley & Sons Ltd.; 2008.
[18] R. P. Mukund, Wind and Solar Power Systems. Boca Raton, FL, USA: CRC, 1999.
[19] N. Nikmehr and S. Najafi Ravadanegh, " Heuristic probabilistic power flow algorithm for microgrids operation and planning," IET Generation, Transmission & Distribution, Vol. 9, No. 11, pp. 985- 995, 2015.
[20] S.Wang, Z. Li, L.Wu, M. Shahidehpour, and Z. Li, “New metrics for assessing the reliability and economics of microgrids in distribution system,” IEEE Trans. Power Syst., vol. 28, no. 3, pp. 2852–2861, Aug. 2013.
[21] N. Nikmehr and S. Najafi Ravadanegh, "Optimal operation of distributed generations in micro-grids under uncertainties in load and renewable power generation using heuristic algorithm," IET Renewable Power Generation, DOI: 10.1049/iet-rpg.2014.0357, 2015.
[22] Y. M. Atwa and E. F. El-Saadany "Reliability evaluation for distribution system with renewable distributed generation during islanded mode of operation", IEEE Trans. Power Syst., vol. 24, no. 2, pp.572 -581, 2009.
[23] R. Yokoyama, T. Niimura, and N. Saito, “Modeling and evaluation of supply reliability of microgrids including PV and wind power,” in IEEE. Proc. Power and Energy Society General Meeting - Conversion and Delivery of Electrical Energy in the 21st Century, 2008, pp. 1-5.
[24] H. Wu, X. Liu, and M. Ding, “Dynamic economic dispatch of a microgrid: Mathematical models and solution algorithm,” Int J Electr Power Energy Syst, vol. 63, pp. 336-346, 2014.