doi:10.1155/2012/767128
Research Article
Electronic Structure of the CuCl
2
(100) Surface:
A DFT First-Principle Study
Sherin A. Saraireh
1and Mohammednoor Altarawneh
2, 31Physics Department, Faculty of Sciences, Al-Hussein bin Talal University, P.O. Box 20, Ma’an, Jordan
2Chemical Engineering Department, Faculty of Engineering, Al-Hussein bin Talal University, P.O. Box 20, Ma’an, Jordan 3Priority Research Centre for Energy, Faculty of Engineering and Built Environment, The University of Newcastle, Callaghan,
NSW 2308, Australia
Correspondence should be addressed to Sherin A. Saraireh,[email protected]
Received 13 March 2012; Accepted 11 June 2012
Academic Editor: Shafiul Chowdhury
Copyright © 2012 S. A. Saraireh and M. Altarawneh. This is an open access article distributed under the Creative Commons Attribution License, which permits unrestricted use, distribution, and reproduction in any medium, provided the original work is properly cited.
First-principle density functional theory (DFT) and a periodic-slab model have been utilized to investigate the structure of the
CuCl2(100) surface. Structural parameters of the bulk CuCl2 are reported and compared with the experimental values. The
structure of the CuCl2(100) is calculated using a (2×2) supercell. Structural parameters in terms of bond lengths and bond
angle are calculated. Electronic properties of the CuCl2(100) surface are investigated by calculating the density of state (DOS) and
the projected density of state for a slab containing five layers.
1. Introduction
Copper plays a prominent role in many fields. This is pri-marily due to its unique mechanical properties and excellent electrical and thermal conductivity. Its applications spans heating and cooling piping, heat exchanging, electrical
appli-ances, architecture, and catalysis [1–6].
Adsorption of halides on metallic surfaces is of particular importance due to their relevance for many industrial pro-cesses and its role in the formation of notorious
environmen-tal pollutants such as dioxins [7]. Central to a comprehensive
understanding of various phenomena such as corrosion, electrodeposition, and catalytic cycles is addressing adsorp-tion of chlorine on copper surfaces on a precise atomic-scale. Motivated by its diverse application, the chlorine-copper
interaction has attracted great deal of experimental [8–
14] and theoretical [15–18] studies. Mounting experimental
evidence shows a strong interaction between Cl and Cu
atoms as evident from electron diffraction (LEED) [8],
normal-incident X-ray standing wave (NIXSW) [9],
surface-extended X-ray adsorption fine structure (SEXAFS) [10,11],
shadow-cone-enhanced secondary-ion mass spectrometry
(SIMS) [6,12], and Scanning Tunnelling microscopy (STM)
[13, 14] methods. STM studies found that the chlorine
molecules adsorb dissociatively on the Cu(111) surface, lead-ing to formation of various well-ordered phases. It is also found that Cl atoms prefer to adsorbs onto face-centered cubic (fcc) hollow positions over the hexagonal close-pack
(hcp) hollow, bridge, and top positions [13,18].
Computational data for the Cl/Cu(111) system based on
cluster [15] or a periodic DFT-based calculation [16,17,19]
has been presented by different groups Doll and Harrison
[16], Migani et al. [17], and Peljhan and Kokalj [19]. It was
found that the preferred adsorption of the Cl atoms is the
face-centered cubic (fcc) [16]. Peljhan et al. presented an
extensive DFT calculation of Cl adsorption on Cu(111), considering a wide range of Cl coverages ranging from 1/16 to 1 ML. The strong interaction between Cl and Cu atoms
results in the formation of two distinctive different materials;
namely, CuCl and CuCl2. The crystal structure of the CuCl2
follows a base-centered monoclinic space group C2/m [20–
22]. As demonstrated by Burns and Hawthrone [23]. Cu
a b c
Cl
Cu a
c
nearest neighbors Cl atoms β
Four equatorial
Distorted octahedral environment An axial Cl atoms
An axial Cl atoms
b
Figure 1: Unit cell of CuCl2. In online version, green circle represent Cl atoms while red and violet circles represent Cu atom.
environment with four equatorial nearest neighbors Cl atoms and two axial Cu atoms.
First-principle simulation, based on density functional theory (DFT), is now one of the key tools for studying and developing a key understanding of solid surfaces. DFT calculations can provide an atomic-based insight into the detailed bonding arrangement of structures, their energetic stability, and charge densities. To this end, this contribution investigates the electronic structure of the Copper (II)
chloride, CuCl2, mainly in the (100) surface orientation.
2. Methodology
The calculations reported in this paper have been performed using the plane wave pseudopotential density functional theory (DFT) method as implemented in the VASP program
[24–27]. The generalized gradient approximation (GGA)
for exchange and correlation as developed by Perdew and
Wang (PW91) [28] was used to perform the spin-polarized
calculations. Projector augmented wave (PAW) potentials
[24, 25, 29] are used to represent the ionic potentials. A
unit cell comprising four atomic layers has been employed
together with a vacuum thickness of at least 14 ˚A to separate
each slab from its neighboring images along thez-direction
(normal to the surface). The three top-most layers of the slab were allowed to fully relax. The Brillouin-Zone (BZ) integrations were performed using automatic generation of
(3 × 3 × 1) and (5 ×5 ×1)k-point set of
Monkhorst-Pack random sampling [30]. Total energy was converged to
an accuracy of 1×10⁻³eV. Deployed energy cut-offwas set
at 300 eV. The choice of this value, stems from the maximum value of the kinetic-energy for the Cl and Cu atoms, that is, 280 and 273 eV, respectively.
3. Results
3.1. Bulk Properties. CuCl2 forms a base-centered
Mono-clinic Bravies lattice. As shown inFigure 1, each Cu atom
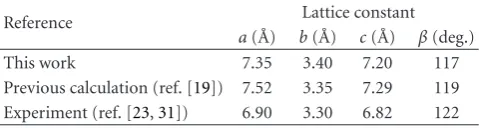
is in an axially distorted octahedral environment with four equatorial nearest neighbors Cl atoms and two axial Cl atoms. The lattice constants were determined (as illustrated in Table 1) by plotting the variation in the energy with
respect to the volume of the unit cell of bulk CuCl2. The
Table 1: Comparison of our calculated properties of the bulk CuCl2
bulk with previous calculated data [19] and experiment data [23, 31].
Reference Lattice constant
a( ˚A) b( ˚A) c( ˚A) β(deg.)
This work 7.35 3.40 7.20 117
Previous calculation (ref. [19]) 7.52 3.35 7.29 119
Experiment (ref. [23,31]) 6.90 3.30 6.82 122
lattice constants of bulk CuCl2are compared with calculated
data in reference [19] and experiment data in references [23,
31] inTable 1. This comparison shows that our results are in a relative good agreement with those of earlier experiment and computational studies.
The calculated total density of states (DOS) and
atomic-projected DOS (pDOS) for bulk CuCl2 are presented in
Figure 2;Figure 2(a)shows the Density of state (DOS) of the
CuCl2bulk, whileFigure 2(b)shows the projected density of
state for Cu atom andFigure 2(c)shows the projected density
of state for Cl atom.
There are two distinct bands in the valence region (Figure 2(a)). The Cu band (predominantly Cu 3d and little contributions of Cu (3p and 4s)) occupies the region (0 to
−5) eV, and the Cl band (predominantly Cl (3s and 3p))
occupies that of (−14 to −15) eV. The surface state band
resides just above the Fermi level where two regions are highlighted. The first one is in the region from 3.0 to 7.0 eV, while the second one is from 7.5 to 9.0 eV. The first region above the Fermi level is predominantly the empty state Cu 4s and the contribution in this region from Cu 3p and Cl (3s
and 3p) is minimal (see Figures2(b)and2(c)). The second
region above the Fermi level is predominantly the state Cu (3d and 3p) and Cl (3s and 3p).
3.2. CuCl2(100) Surface. A supercell of the CuCl2(100) is constructed from the optimized bulk unitcell and also based
on the data in [21,22,32]; the unit cell is shown inFigure 3.
−20 −15 −10 −5 0 5 10 0
5 10 15 20 25
D
OS (stat
es/eV
)
E(ev)
(a)
−20 −15 −10 −5 0 5 10
0 2 4 6 8
D
OS (stat
es/eV
)
Cu
4 s 3 p 3 d
E(ev)
(b)
−20 −15 −10 −5 0 5 10
0 2 4 6 8
D
OS (stat
es/eV
)
Cl
E(ev)
3 s 3 p
(c)
Figure 2: Density of state (DOS) of the bulk of the CuCl2; (a) total DOS, projected DOS (PDOS) of (b) Cu atom and (c) Cl atom.
Test is performed using automatic generation of (3×3×
1) and (5×5×1)k-point set of Monkhorst and Pack. For
each optimization using these two schemes, the total energy
was converged to an accuracy of 1×10⁻³eV and the forces
on each ion to an accuracy of 0.015 eV ˚A−1. A test using (5
×5×1)k-point changed the total energies of the (3×3×
1)k-point by a only few meV. All the calculations discussed
here are using a 3×3 ×1k-point grid (unless otherwise
specified).
Transformation upon building the surface can be viewed in terms of the relaxation, that is, the change in interatomic
distances and angleBbetween optimized bulk unit cell and
the extended surface. We found that Cu-Cl distances become longer in the extended surface than the bulk one by only
0.009 ˚A. While the angleBon the unit cell unit cell varies
between 117◦in the bulk and 111.3◦in the surface (as shown
inFigure 3). It is worthwhile also mentioning that optimized surface retains the symmetry exhibited by the unit cell. A
noticeable difference incand a lattice constants could be
rationalized based on the shortcoming of standard DFT methods in descrying states relating to long-term weak
interactions (Van der Walls type) [33,34].
The surface has a space group C2/m (as shown in
Figure 3) the same as that of the CuCl2 bulk. Unit cells
are shifted from each other by 4.06 ˚A. The super-cell of the
surface is illustrated inFigure 4; the top and side views are
also shown in Figure 5. All bond lengths and bond angles
are illustrated inTable 2based onFigure 5(b). The distance
between each two atomic layer is 3.212 ˚A. The surface has
been optimized also by the (5×5×5)k-point set, and some
of the bond lengths and bond angles are illustrated also in
a c
b
3.58 ˚A
3.3 ˚A
3.6 ˚A
Cu Cu
Cl Cl
B
B=111.3◦
Figure 3: the unit-cell of the CuCl2(100) surface: it is distorted in the (c) direction, which represents the height. In online version, green
circles represent Cl atoms, while red circles represent Cu atom.
a c
b
(a) (b)
Figure 4: (a) Side view of the (2×2) unit-cell of the CuCl2(100) surface and (b) side view of the (2×2) unit-cell of the CuCl2(100) surface
but the atoms inFigure 4(b)are rotated with small angle to show the atoms in each layer. The (b) direction is perpendicular to both (a) and
(c). The unit-cell is distorted in the (c) direction, which represents the height.
some of the bond length shrinks slightly by 0.02 ˚A while the
others stay the same. Also some of the bond angle did not
change, while the others changed by only 0.2◦. AngleBin
the unit cell illustrated inFigure 3becomes smaller also by
0.8◦.
3.3. Electronics Properties. The electronics properties of the
CuCl2(100) surface are investigated by calculating the density
of state (DOS) for a slab containing five layers using the
automatic generation of (3 × 3 × 1)k-point. Figure 6
shows the total DOS and projected DOS of the surface. The investigation of the DOS shows that there are three main regions in the valence band below the Fermi level (0 eV in
Figure 6(a)). The first and second regions occupy the regions
of (−2 to −6) eV and (−6 to −8) eV. These two regions
are manly composed of Cu 3d (Figure 6(b)), with a little
contribution of Cl 3p, but the Cu (4s and 3p) and Cl 3s states
are minimal (Figures6(b)and6(c)).
The last region in the valence band is starting at−17 eV;
(a)
8.27
10.3
Cl1 Cl2
Cl3 Cl4
Cl5 Cl6
Cu1 Cu2
Cu3 Cu4
Top view
(b)
Figure 5: (a) Side view and (b) top view of the CuCl2(100) surface;Figure 5(a)shows part of the surface inFigure 5(b)but rotated to show
the structure. Dimensions are in angstrom.
Table 2: Calculated structural parameters of the CuCl2(100) surface using (3×3×1) and (5×5×1)k-point set of Monkhorst and Pack,
angleBis the one in the unit cell as inFigure 3.
Bond length ( ˚A) (3×3×1) (5×5×5) Bond angle (◦) (3×3×1) (5×5×5)
Cu1–Cl1 2.287 2.275 Cu1–Cl1–Cu2 94 94
Cl1–Cu2 2.280 2.273 Cl1–Cu2–Cl2 93.8 94
Cu1–Cl3 2.270 2.270 Cl1–Cu1–Cl3 86 86
Cl3–Cu2 2.270 2.275 Cu1–Cl3–Cu2 94 94
Cu1–Cu3 7.190 7.190 Cl1–Cu2–Cl3 86.2 86
Cl3–Cl5 4.090 4.090 B 111.3 110.5
Cu2–Cu4 7.190 7.190 — — —
Cl4–Cu6 4.080 4.080 — — —
two distinct regions starting at 1.5 eV with a wide of approximately 2.5 eV for each one. Each of these regions has small peaks at 3.2 eV and 5.2 eV, respectively. The first region is predominantly Cu (4s and 3p) and Cl (3s and 3p), while the second region is predominantly of Cu 4s and the Cl (3s and 3p).
4. Conclusions
The structural, electronic properties of bulk and (100)
surface of CuCl2 were investigated by means of periodic
quantum chemical calculation based on the first-principle DFT approach. For the bulk, the comparison of optimized
structural parameters with experimental and previous DFT study shows that the lattice constants are in a good
agree-ment. The supercell of the CuCl2(100) surface showed to be
axially distorted in thez direction. The interlayer distance,
all the bond lengths, and the bond angle are calculated. Total and projected Density of State (DOS) for the bulk and the extended surface is calculated. For the (100) surface, the valence band is having two regions: the first one composed of Cu (3d) and Cl (3p), while the second region is composed of Cl (3s) states. The surface states above the Fermi level are composed of manly Cu (4s and 3p) and Cl (3s and 3p). An extension to this work is to study the adsorption
and dissociation of small molecules such as H2and H2O on
0 50 100 150 200 250 300
−20 −15 −10 −5 0 5 10
D
OS (stat
es/eV
)
E(ev)
(a)
0 2 4 6 8
−20 −15 −10 −5 0 5 10
D
OS (stat
es/eV
)
E(ev)
3 p
4 s 3 d
(b)
0 2 4 6 8
−20 −15 −10 −5 0 5 10
D
OS (stat
es/eV
)
Cl
E(ev)
3 p 3 s
(c)
Figure 6: Density of state (DOS) of the CuCl2(100) surface: (a) total dos, (b) projected DOS (PDOS) of the surface Cu atom, and (c)
projected DOS (PDOS) of the surface Cl atom.
References
[1] K. S. Subramanian, “Determination of tin in lead/tin solder leachates from copper piping by graphite platform furnace atomic-absorption spectrometry,” Talanta, vol. 36, no. 11, pp. 1075–1080, 1989.
[2] V. V. Smirnov and J. P. Roth, “Mechanisms of electron transfer in catalysis by copper zinc superoxide dismutase,” Journal of
the American Chemical Society, vol. 128, no. 51, pp. 16424–
16425, 2006.
[3] W. F. Paxton, J. M. Spruell, and J. F. Stoddart, “Heterogeneous catalysis of a copper-coated atomic force microscopy tip for direct-write click chemistry,” Journal of the American Chemical
Society, vol. 131, no. 19, pp. 6692–6694, 2009.
[4] J. Song, T. Zhao, and Y. Du, “Supported copper catalysts for direct vapor-phase oxycarbonylation of methanol,” Chinese
Journal of Catalysis, vol. 27, no. 5, pp. 386–390, 2006.
[5] Y. Cen, X. Li, and H. Liu, “Preparation of copper-based cat-alysts for methanol synthesis by acid-alkali-based alternate precipitation method,” Chinese Journal of Catalysis, vol. 27, no. 3, pp. 210–216, 2006.
[6] M. H. Looi, S. T. Lee, and S. B. Abd-Hamid, “Use of citric acid in synthesizing a highly dispersed copper catalyst for selective hydrogenolysis,” Chinese Journal of Catalysis, vol. 29, no. 6, pp. 566–570, 2008.
[7] M. Altarawneh, B. Z. Dlugogorski, E. M. Kennedy, and J. C. Mackie, “Mechanisms for formation, chlorination, dechlori-nation and destruction of polychlorinated dibenzo-p-dioxins and dibenzofurans (PCDD/Fs),” Progress in Energy and
Com-bustion Science, vol. 35, no. 3, pp. 245–274, 2009.
[8] P. J. Goddard and R. M. Lambert, “Adsorption-desorption properties and surface structural chemistry of chlorine on Cu(111) and Ag(111),” Surface Science, vol. 67, no. 1, pp. 180– 194, 1977.
[9] M. F. Kadodwala, A. A. Davis, G. Scragg et al., “Structural
determination of the Cu(111)-(3×3) R30◦-Cl/Br surface using
the normal incidence X-Ray standing wave method,” Surface
Science, vol. 324, no. 2-3, pp. 122–132, 1995.
[10] M. D. Crapper, C. E. Riley, P. J. J. Sweeney, C. F. McConville,
and D. P. Woodruff, “Complete adsorption site information
photoelectron diffraction,” EPL (Europhysics Letters), vol. 2, no. 11, p. 857, 1986.
[11] D. P. Woodruff, D. L. Seymour, C. F. McConville et al.,
“Simple x-ray standing-wave technique and its application to
the investigation of the Cu(111) (√3√3) R30◦-Cl structure,”
Physical Review Letters, vol. 58, no. 14, pp. 1460–1462, 1987.
[12] W. K. Way, A. C. Pike, S. W. Rosencrance, R. M. Braun, and N. Winograd, “Coverage-dependent bond length of chlorine adsorbed on Cu(111),” Surface and Interface Analysis, vol. 24, no. 2, pp. 137–141, 1996.
[13] T. Sakurai and T. Hashizume, “FI-STM study of metal sur-faces,” Nanotechnology, vol. 3, no. 3, pp. 126–132, 1992. [14] D. W. Suggs and A. J. Bard, “Scanning tunneling microscopic
study with atomic resolution of the dissolution of Cu(111) in aqueous chloride solutions,” Journal of the American Chemical
Society, vol. 116, no. 23, pp. 10725–10733, 1994.
[15] A. Ignaczak and J. A. Gomes, “Interaction of halide ions with copper: the DFT approach,” Chemical Physics Letters, vol. 257, no. 5-6, pp. 609–615, 1996.
[16] K. Doll and N. M. Harrison, “Chlorine adsorption on the Cu(111) surface,” Chemical Physics Letters, vol. 317, no. 3–5, pp. 282–289, 2000.
[17] A. Migani, C. Sousa, and F. Illas, “Chemisorption of atomic chlorine on metal surfaces and the interpretation of the induc-ed work function changes,” Surface Science, vol. 574, no. 2-3, pp. 297–305, 2005.
[18] A. Migani and F. Illas, “A systematic study of the structure and bonding of halogens on low-index transition metal surfaces,”
Journal of Physical Chemistry B, vol. 110, no. 24, pp. 11894–
11906, 2006.
[19] S. Peljhan and A. Kokalj, “Adsorption of Chlorine on Cu(111): A Density Functional Theory Study,” The Journal of Physical
Chemistry C, vol. 113, no. 32, pp. 14363–14376, 2009.
[20] L. B. Bergasova and S. K. Filatov, “The new mineral tolbachite
CuCl2,” Doklady Akademii Nauk SSSR, vol. 270, pp. 415–417,
1983.
[21] B. Gmelin, Handbuch Der Aanorganischen Chemie, vol. 211, Chemie GmbH, Weinheim, Germany, 1958.
[22] A. F. Wells, “333. The crystal structure of anhydrous cupric chloride, and the stereochemistry of the cupric atom,” Journal
of the Chemical Society, vol. 1, pp. 1670–1675, 1947.
[23] P. C. Burns and F. C. Hawthrone, “Tolbachite, CuCl2, the first
example of Cu2+octahedrally coordinated by Cl−,” The
Amer-ican Mineralogist, vol. 78, pp. 187–189, 1993.
[24] G. Kresse and J. Hafner, “Ab initio molecular dynamics for liquid metals,” Physical Review B, vol. 47, no. 1, pp. 558–561, 1993.
[25] G. Kresse and J. Hafner, “Ab initio molecular-dynamics simu-lation of the liquid-metal–amorphous-semiconductor transi-tion in germanium,” Physical Review B, vol. 49, no. 20, pp. 14251–14269, 1994.
[26] G. Kresse and J. Furthmuller, “Efficiency of ab-initio total
energy calculations for metals and semiconductors using a plane-wave basis set,” Computational Materials Science, vol. 6, no. 1, pp. 15–50, 1996.
[27] G. Kresse and J. Furthmuller, “Efficient iterative schemes for ab
initio total-energy calculations using a plane-wave basis set,”
Physical Review B, vol. 54, no. 16, pp. 11169–11186, 1996.
[28] J. P. Perdew, J. A. Chevary, S. H. Vosko et al., “Atoms, mole-cules, solids, and surfaces: applications of the generalized gra-dient approximation for exchange and correlation,” Physical
Review B, vol. 46, no. 11, pp. 6671–6687, 1992.
[29] P. E. Bl¨ochl, “Projector augmented-wave method,” Physical
Re-view B, vol. 50, no. 24, pp. 17953–17979, 1994.
[30] H. J. Monkhorst and J. D. Pack, “Special points for Brillouin-zone integrations,” Physical Review B, vol. 13, no. 12, pp. 5188– 5192, 1976.
[31] D. R. Lide, Ed., CRC Handbook of Chemistry and Physics, CRC Press, Boca Raton, Fla, USA, 7th edition, 1993.
[32] J. Find, D. Herein, Y. Uchida, and R. Schl¨ogl, “New
three-dimensional structural model for the CuCl2graphite
intercala-tion compound,” Carbon, vol. 37, no. 9, pp. 1431–1441, 1999. [33] M. Altarawneh, M. W. Radny, P. V. Smith, J. C. Mackie, E. M. Kennedy, and B. Z. Dlugogorski, “2-Chlorophenol adsorption on Cu(1 0 0): first-principles density functional study,” Surface
Science, vol. 602, no. 8, pp. 1554–1562, 2008.
[34] O. A. Lilienfeld, I. Tavernelli, U. Rothlisberger, and D.
Sebas-tiani, “Optimization of effective atom centered potentials for
London dispersion forces in density functional theory,”
Submit your manuscripts at
http://www.hindawi.com
Scientifica
Hindawi Publishing Corporation
http://www.hindawi.com Volume 2014
Hindawi Publishing Corporation
http://www.hindawi.com Volume 2014
Ceramics
Journal ofNanoparticles
Journal of Hindawi Publishing Corporationhttp://www.hindawi.com Volume 2014
Hindawi Publishing Corporation
http://www.hindawi.com Volume 2014
International Journal of
Biomaterials
Hindawi Publishing Corporation
http://www.hindawi.com Volume 2014
Nanoscience
Journal ofTextiles
Hindawi Publishing Corporation
http://www.hindawi.com Volume 2014
Journal of
Crystallography
Journal of Hindawi Publishing Corporationhttp://www.hindawi.com Volume 2014
The Scientific
World Journal
Hindawi Publishing Corporation
http://www.hindawi.com Volume 2014
Hindawi Publishing Corporation
http://www.hindawi.com Volume 2014
Coatings
Journal ofAdvances in
Materials Science and Engineering
Hindawi Publishing Corporation
http://www.hindawi.com Volume 2014
Hindawi Publishing Corporation
http://www.hindawi.com Volume 2014
Metallurgy
Journal ofHindawi Publishing Corporation
http://www.hindawi.com Volume 2014
BioMed
Research International
Materials
Journal of Hindawi Publishing Corporationhttp://www.hindawi.com Volume 2014
N
a
no
ma
te
ria
ls
Hindawi Publishing Corporation
http://www.hindawi.com Volume 2014
Journal of