R E S E A R C H
Open Access
Semi-automatic algorithm for construction of the
left ventricular area variation curve over a
complete cardiac cycle
Salvador A Melo Júnior
1, Bruno Macchiavello
2*, Marcelino M Andrade
3, João LA Carvalho
1,3, Hervaldo S Carvalho
1,4,
Daniel F Vasconcelos
4, Pedro A Berger
2, Adson F da Rocha
1, Francisco AO Nascimento
1* Correspondence: [email protected]
2Department of Computer Science,
University of Brasília, Brasília, DF, Brazil
Abstract
Background:Two-dimensional echocardiography (2D-echo) allows the evaluation of cardiac structures and their movements. A wide range of clinical diagnoses are based on the performance of the left ventricle. The evaluation of myocardial function is typically performed by manual segmentation of the ventricular cavity in a series of dynamic images. This process is laborious and operator dependent. The automatic segmentation of the left ventricle in 4-chamber long-axis images during diastole is troublesome, because of the opening of the mitral valve.
Methods:This work presents a method for segmentation of the left ventricle in dynamic 2D-echo 4-chamber long-axis images over the complete cardiac cycle. The proposed algorithm is based on classic image processing techniques, including time-averaging and wavelet-based denoising, edge enhancement filtering, morphological operations, homotopy modification, and watershed segmentation. The proposed method is semi-automatic, requiring a single user intervention for identification of the position of the mitral valve in the first temporal frame of the video sequence. Image segmentation is performed on a set of dynamic 2D-echo images collected from an examination covering two consecutive cardiac cycles.
Results:The proposed method is demonstrated and evaluated on twelve healthy volunteers. The results are quantitatively evaluated using four different metrics, in a comparison with contours manually segmented by a specialist, and with four alternative methods from the literature. The method’s intra- and inter-operator variabilities are also evaluated.
Conclusions:The proposed method allows the automatic construction of the area variation curve of the left ventricle corresponding to a complete cardiac cycle. This may potentially be used for the identification of several clinical parameters, including the area variation fraction. This parameter could potentially be used for evaluating the global systolic function of the left ventricle.
Background
Two-dimensional echocardiography (2D-echo) allows the evaluation of cardiac struc-tures and their movements, so that anatomic and functional characteristics may be assessed. The analysis of left ventricular function is extremely important in echocardio-graphic examinations, since a wide range of clinical diagnoses are based on the
performance of this chamber [1]. This evaluation is typically performed by manual seg-mentation of the left ventricular cavity, in which a specialist delineates the blood-endo-cardial interface in a series of dynamic images. This process is laborious and operator dependent.
Several methods for automatic or semi-automatic segmentation of the left ventricular cavity in echocar-diographic images have been proposed in the literature. These meth-ods are typically founded on image processing approaches. Klingler Jr et al. [2] pro-posed an image segmentation method using morphological operations. Choy and Jin used morphological filtering combined with edge enhancement filtering for segmenting the left ventricle in static images [3], and also used mathematical morphology and tem-poral information to improve the segmentation accuracy in sequences of dynamic 2D-echo images [4]. Ohyama et al. [5] used time-averaging combined with ternary quantization thresholding. Cheng et al. proposed a method using morphological opera-tions and watershed segmentation for finding the center of the left ventricle [6], and then using snake deformation with a multiscale directional edge map for detecting the endocardial boundary [7]. Lacerda et al. [8] used a radial search algorithm based on temporal information for improving the segmentation quality. Dos Reis et al. [9] pro-posed a time-averaging denoising stage based on motion estimation for frame rejection. Amorim et al. [10] proposed a preprocessing stage based on image fusion to increase the accuracy of watershed segmentation. Fernández-Caballero and Vega-Riesco [11] presented a segmentation method using multi-stage preprocessing (smoothing, gradient detection, and gradient smoothing), a generalized Hough transform, and an active-con-tour algorithm. Despite all these efforts, there is currently no established gold standard for echocardiographic image segmentation. Ultrasound images are typically degraded by intensity inhomogeneity, distortion, and speckle noise. For these reasons, automatic segmentation of such images remains a challenging topic [12].
The segmentation of dynamic 2D-echo sequences could be particularly useful for detecting and locating wall motion abnormalities. The automatic segmentation of the left ventricle in 4-chamber long-axis images over the complete cardiac cycle is trouble-some, because of the opening of the mitral valve during diastole. However, the infor-mation redundancy provided by the temporal component - e.g., periodicity of the cardiac cycle, similarity between adjacent temporal frames - may be exploited for redu-cing noise and/or avoiding undersegmentation [4,5,8].
covering two consecutive cardiac cycles. The segmentation of this set of dynamic images allows the automatic construction of the area variation curve (AVC) of the left ventricle corresponding to a complete cardiac cycle. This may potentially be used for the identification of several clinical parameters, including the area variation fraction (AVF). This parameter could potentially be used for evaluating the global systolic func-tion of the left ventricle, which is important for diagnosing innumerous cardiovascular pathologies [1]. The proposed method for AVC and AVF calculation is demonstrated and evaluated on twelve healthy volunteers. The results are quantitatively evaluated using four different metrics, in a comparison with contours manually segmented by a specialist and with four alternative methods from the literature. The method’s intra-and inter-operator variabilities are also evaluated.
Methods
Subjects and data acquisition protocol
The study involved 12 healthy individuals. Each subject went through a complete clini-cal examination and a 12-lead surface electrocardiogram evaluation. Individuals who presented symptoms of systemic cardiovascular problems or of cardiovascular disease were excluded from the study. The study was approved by the research ethics commit-tee of the University of Brasília. Voluncommit-teers provided informed consent in accordance with institutional policy.
A dynamic image bank was constructed by specialists of the cardiology service of the hospital of the University of Brasília. The equipment used to obtain the dynamic 2D-echo images (Philips/ATL HDI 3500) was connected through an Ethernet network to a medical image server (GS-Web, Humano Tecnologia da Informação Ltda., Brasília-DF, Brazil), where the examinations were stored in a mass memory device for off-line processing.
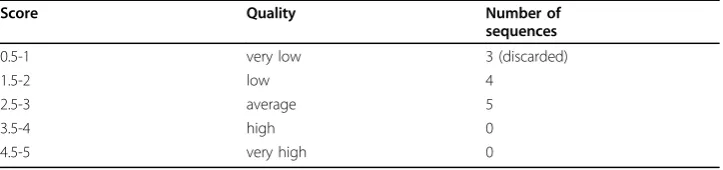
Acquisitions corresponded to 12 video sequences (one per subject). Each sequence recorded two cardiac cycles of apical 4-chamber long-axis thoracic 2D-echo images, at a rate of 44 frames/s, totaling approximately 900 frames for the 12 individuals. The corresponding electrocardiographic signals were also acquired. A specialist evaluated the video sequences in terms of their image quality, using a score system ranging from 0 to 5 (Table 1). Sequences which scored 1 or lower were discarded (3 in total). Thus, a total of 9 video sequences were used for evaluating the proposed algorithm.
Image segmentation algorithm
The construction of the area variation curve from the dynamic 2D-echo images was performed with a computational algorithm composed of two processing modules,
Table 1 Image quality of the video sequences.
Score Quality Number of
sequences
0.5-1 very low 3 (discarded)
1.5-2 low 4
2.5-3 average 5
3.5-4 high 0
4.5-5 very high 0
which implement image preprocessing and segmentation algorithms, respectively. The preprocessing module improves image quality by reducing spurious noise (e.g., rever-beration, mirroring). The second module performs the semi-automatic segmentation of the left ventricular cavity, and calculates the ventricular area.
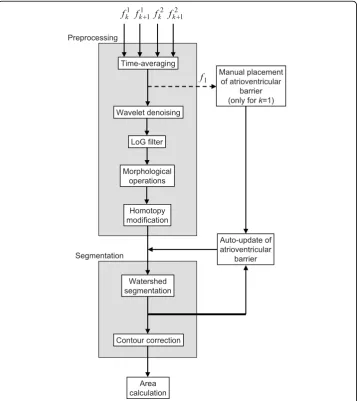
A block diagram of the algorithm is shown in Figure 1. Four 2D-echo images - two adjacent images from two successive cardiac cycles - are used as inputs. The output is the area of the left ventricle at the corresponding time instant. The only operator inter-action in the process is a one-time-only manual placement of a barrier over the mitral valve (discussed later).
Preprocessing module
The preprocessing module receives raw 2D-echo images (noisy, low contrast), and out-puts images which are more adequate for segmentation. This module is implemented
Figure 1Block diagram of the proposed algorithm. The algorithm is composed of two image processing modules: preprocessing and segmentation. Four images - two adjacent images from two successive cardiac cycles - are used as inputs. The output is the area of the left ventricle at the
in five stages: time-averaging filter, wavelet-based denoising, edge enhancement, mor-phological operations, and homotopy modification.
Time-averaging filter
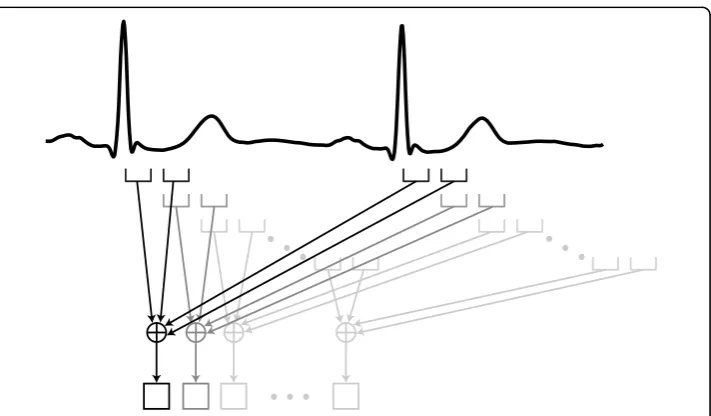
In the first stage of the preprocessing module, a time-averaging filter [5,15] is applied for noise reduction. The temporal average is calculated for sets of four images taken from two consecutive cardiac cycles. Averaging is first performed for two successive images in each of the two cycles. Then, the images of the two cardiac cycles are syn-chronized based on the R wave of the electrocardiographic signal (Figure 2). The time-averaging filter is implemented as
f x yk( , )=1⎣⎡fk( , )x y +fk+( , )x y +fk( , )x y +fk+( , ) ,x y ⎤⎦
4
1
1
1 2
1
2 (1)
where fkm( , )x y is the pixel value at spatial coordinatesx,yin framekof cyclem, and fk(x, y) is the resulting pixel value. This process assumes that successive images in the
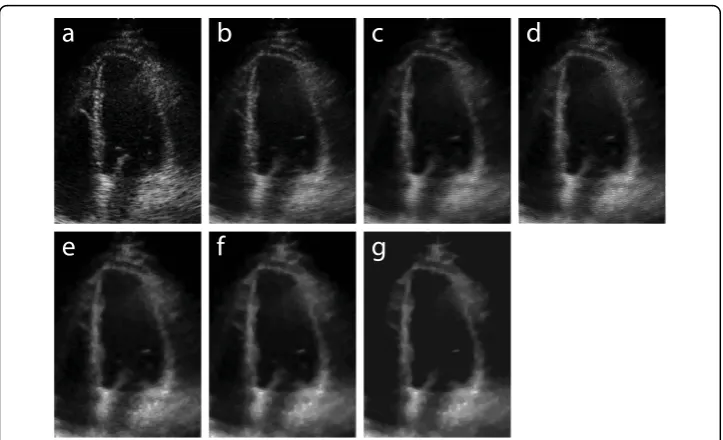
same cardiac cycle are highly correlated (given the inertia of the process), and that each image is highly correlated with its reciprocal in the previous cardiac cycle (given the phenomenon’s periodicity). Although a new composite image is obtained every 23 ms (44 frames/s) using a sliding-window approach (see Figure 2), the time-averaging process reduces the effective temporal resolution from 23 ms to 46 ms. However, this is not expected to cause loss of diagnostic information, as cardiologists commonly use 40 ms resolution methods for electrocardiography, echocardiography, and magnetic resonance imaging -based diagnosis. In patients with irregular heart rate, arrhythmia rejection algo-rithms [16] may be used for exclusively selecting similar heartbeats. Alternatively, images from a single heartbeat may be used, at the cost of lower temporal resolution (by aver-aging additional adjacent frames) and/or inferior noise reduction performance. The effect of applying this time-averaging filter to the echocardiographic image shown in Fig-ure 3(a) is demonstrated in FigFig-ure 3(b).
Wavelet-based denoising
The previous stage reduces white noise and enhances edges of interest by operating along the temporal dimension. This stage focuses solely on denoising, and operates along the spatial dimensions. The shift invariant wavelet denoising technique is used [17-19]. Daubechies wavelets have been shown to adapt to the characteristics of 2D-echo images, minimizing correlation in the transformed space, concentrating the energy of the information of interest, and adequately reducing white noise [20]. The 12th-order Daubechies wavelet was empirically chosen for this work, and provides a good representation in terms of mean squared error and transform-domain sparsity. Higher-order wavelets may be used with lower-quality images (e.g., non-echogenic sub-jects). This further removes noise, but reduces the spatial resolution. More detailed information on wavelet denoising is provided in Refs. [17-19]. This stage provides increased segmentation robustness in the presence of noise, but is computationally-intense, and may be considered optional for high-quality images. Figure 3(c) illustrates the effect of wavelet denoising on the image obtained from the time-averaging stage. Edge enhancement
In the third stage of preprocessing, the images are filtered with a self-reinforcing Lapla-cian-of-Gaussian (LoG) filter. The LoG filter highlights the cavity edges by increasing image contrast, and improves the performance of the algorithm [3,4]. This self-reinfor-cing filter is implemented as
m x y( , )=m x y( , ) | ( , ) * ( , ) |,+ h x y m x y (2)
where m(x, y) is the input image, m x y( , ) is the output image,
h x y( , )
. . .
. . .
. . .
=
− − −
− + −
− − −
⎡
⎣ ⎢ ⎢ ⎢
⎤
⎦ ⎥ ⎥ ⎥ 0 1 0 2 0 1 0 2 1 2 0 2 0 1 0 2 0 1
, and * denotes two-dimensional convolution. Figure 3
Figure 3Step-by-step preprocessing results. (a) Input image ((fk1)); (b) after time-averaging; (c) after
(d) illustrates the effect of the LoG filter on the image obtained from the wavelet denoising stage.
Morphological operations
This stage is used for non-linear smoothing. Morphological opening smoothes contours, breaks narrow isthmuses, and eliminates small islands and sharp peaks. Morphological closing smoothes contours, fuses narrow breaks and long thin gulfs, and eliminates small holes [21]. These procedures attenuate small local variations in image contrast, and help avoiding both undersegmentation and supersegmentation when the watershed algorithm is used. First, morphological closing is performed, followed by morphological opening (both using a disk of radius 1 as structuring element). The result of these opera-tions is illustrated in Figure 3(e). Then, morphological closing is performed, using a disk of radius 3 as structuring element. The result is illustrated in Figure 3(f).
Homotopy modification
A homotopy modification [22] is used to reduce the number of local minima in the image and avoid supersegmentation when the watershed algorithm is applied. In this procedure, all local minima which are lower than a threshold are eliminated. For typi-cal 2D-echo images that focus on the left ventricle, it is reasonable to assume that at least 50% of the pixels are part of the ventricular cavity. Thus, we use a threshold which is equal to the median of the histogram of the image obtained from the previous stage. The homotopy modification process consists in modifying the gradient function of the image in order to produce a new gradient. The minima of the gradient function are replaced by a set of markers [22]. Homotopy modification is especially useful for low-quality 2D-echo images (e.g., non-echogenic subjects), because such images pre-sent more irregular surfaces. Figure 3(g) illustrates the effect of homotopy modification on the image obtained from the previous stage.
Segmentation algorithm
The second module of the AVC construction system is the segmentation algorithm shown in the block diagram in Figure 1. This module is composed of three stages: insertion of atrioventricular barrier, watershed segmentation, and contour correction. Atrioventricular barrier
Before watershed segmentation, it is necessary to create a barrier between the left atrium and the left ventricle, over the entire extension of the mitral valve, as illustrated in Figure 4(a). Such barrier is necessary because of the opening of the mitral valve dur-ing diastole, when blood passes from the atrium into the ventricle. Without this bar-rier, the watershed algorithm would jointly segment part of the atrium during diastole. The atrioventricular barrier is manually prescribed for the first frame of the video sequence (Figure 1). In successive frames, the reallocation of the barrier becomes a totally automatic and adaptive process, which follows the movement of the mitral valve (see additional file 1). This tracking algorithm is controlled by the change in ventricu-lar area along the cardiac cycle. Horizontally, the barrier continuously extends across the same x-coordinates as the originally prescribed barrier. Vertically, the updated bar-rier is placed on they-coordinate of the lowest-positioned pixel in the previous frame’s watershed mask (discussed next). The barrier is continuously updated during the entire cycle, but it generally has no effect when the mitral valve is closed.
additional barrier was manually placed to avoid undersegmentation (watershed “ leak-age”). This secondary barrier was placed as a tangent to the ventricular wall or to the beam’s shadow, and was not dynamically updated.
Watershed segmentation
Watershed transformation [21,23,24] is used for image segmentation. The watershed algorithm can be defined as a process of flooding basins. Suppose that each local mini-mum of the image is treated as the deepest point of a basin. These basins are flooded from these points, and the water level rises gradually. To avoid a union between two basins, a dam is constructed at each point of contact. The unions of all the dams are the water partition lines. These lines represent the final segmentation. When applied to the preprocessed 2D-echo images, watershed segmentation results in an image con-taining several segmented regions, including the region of interest (inner wall of the left ventricle). This is illustrated in Figure 4(b). The region of interest is automatically selected, given its characteristic of being the largest central region.
Contour correction
The desired segmented contour should be placed exactly around the interface between blood and myocardium. However, the watershed algorithm typically produces a con-tour placed within the myocardial muscle, as illustrated in Figure 4(c). The true ventri-cular area is smaller than the watershed area, and the true blood-endocardial interface
Figure 4Step-by-step segmentation results. (a) Preprocessed image with atrioventricular barrier; (b) after watershed segmentation; (c) watershed contour; (d) corrected contour.
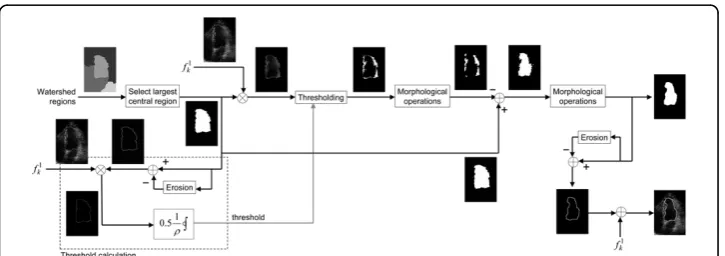
is contained within the watershed contour. Figure 5 presents a diagram of the pro-posed contour correction algorithm. The largest central watershed region is used to mask the left ventricular wall and cavity. Then, a threshold operation is used to sepa-rate myocardial muscle from blood pool. This threshold is determined by calculating the mean pixel intensity along the watershed contour, and multiplying this by a empirically-selected constant (0.5). Then, morphological closing, followed by mor-phological opening (both using a disk of radius 3 as structuring element), are used to produce a smoother mask. This is subtracted from the watershed mask, resulting in an estimate of the ventricular cavity. Finally, this mask is smoothed using morpholo-gical closing and opening (with a disk of radius 9). The final result is illustrated in Figure 4(d).
Area variation curve and fraction
The left ventricular area associated with each temporal frame is calculated by counting the number of pixels contained within the associated segmented contour, and multiply-ing this count by the pixel area. The area variation curve is constructed by plottmultiply-ing the ventricular area as a function of time (Figure 6). The AVC is a representation of the left ventricular contractile function, and allows a concise evaluation of the cardiac cycle, allowing the identification of the various stages of the ventricular systolic and diastolic functions by the specialist.
From the AVC it is also possible to obtain the area variation fraction. The AVF is a measure of the variation of left ventricular area between systole and diastole. This may potentially be used for globally evaluating the left ventricular systolic function. The AVF provides diagnostic information similar to that of the ventricular shortening fraction, which is the percentage change in internal diameter from diastole to systole, and is a measure of global myocardial function. The AVF is computed as the percent difference between the end-diastolic area (A) and the end-systolic area (E) of the left ventricle
(which correspond to the largest and smallest ventricular areas found during the cardiac cycle, respectively), as follows:
AVF= − ×A E
A 100%. (3)
The time instants associated with end-diastole and end-systole may be manually identified by the operator by inspecting the AVC and/or the 2D-echo images, or these may be automatically selected as the first frame after the R wave of the electrocardio-gram and the frame corresponding to the lowest ventricular area, respectively.
Qualitative and quantitative evaluation
The proposed method was implemented in Matlab (The MathWorks, Inc., Natick, MA, USA), using version 1.5 of the SDC Morphology Toolbox (SDC Information Systems, Naperville, IL, USA). The dynamic segmentation results were qualitatively evaluated, based on the calculated AVCs and AVFs, and also by visual inspection of the segmen-ted images.
For a quantitative evaluation of the proposed method, we used an image bank com-posed of 60 echocar-diographic images, which had been previously manually-segmen-ted by a specialist, and evaluamanually-segmen-ted in terms of image quality (high, average, or low). Complete video sequences for these images were not available, thus an alternate imple-mentation of the algorithm was used [13]. This impleimple-mentation does not use the time-averaging and atrioventricular barrier stages, as these stages make use of additional temporal frames. The automatically-estimated ventricular contours were quantitatively compared with the manually-segmented contours, using four metrics: root mean squared distance (RMSd) [3], cross-correlation coefficient (CCC), percent error (PE) [25], and error sum (ES) [25], as follows.
The RMSd metric measures the root mean squared distance between paired contour points:
RMsd= distance =
∑
1 2
1
N LA LM
i N
i i
[ ( , )] , (4)
whereLA andLM are sets of points along the automatically-estimated and
manually-segmented contours, respectively. Points along the longer contour are evenly elimi-nated, so that each contour has Npoints.
The distance in position between paired contour points - LA
i and LMi - is
consid-ered. A more detailed description of this metric is found in Refs. [3] and [4].
CCC is a measure of similarity between the segmented regions, PE is a measure of the area estimation error, and ES is a measure of the edge-positioning error, as follows:
CCC= ⋅
⋅ × ⋅
A M
A A M M (5)
PE=| | | |− ×
| | %
M A
ES= M A+ M A ×
M
| | 100%, (7)
where Mand Aarem ×nbinary images, associated with the manually-segmented and automatically-estimated contours, respectively, in which pixels within the contour (inclusive) are set to 1, and all other pixels are set to 0; |X| is the sum of all pixels in imageX; X =X- x, wherexis the mean value of image X, i.e., x= |X|/(m×n);X·Y denotes pixel-by-pixel image multiplication; X is the complement of imageX (binary pixel inversion); and ∩ denotes intersection (i.e., binary pixel-by-pixel image multiplication).
Intra- and inter-operator variabilities
The proposed semi-automatic method involves minimal manual intervention, since the location of the atrioventricular barrier is performed only for the first image of the sequence of frames. However, this intervention may lead to variations in measured areas, since the manually-placed barrier is interpreted by the algorithm as a border of the left ventricular endocardium. There are studies on the automatic location of the mitral valve [26,27]. These algorithms may totally eliminate user intervention, and may be easily incorporated to the proposed tool. However, mitral valve identification algo-rithms are computationally intense.
In order to evaluate the impact of the manual placement of the barrier, the following experiment was proposed. Four operators were asked to draw the atrioventricular bar-rier for the first frame of one of the video sequences (classified as of average image quality by a specialist). Each operator could not see the other operators’barriers. After each operator defined the barrier, the process was repeated in a circular fashion. A total of 40 barrier placements were performed for the same image (10 per operator). The operators could not see the segmentation results until all repetitions had been performed. The segmentation algorithm was then independently executed 40 times, using each barrier. The AVC associated with each barrier was calculated, and the mean area and standard deviation was calculated for each temporal frame.
Results and Discussion
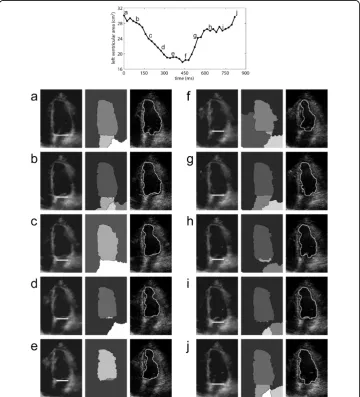
by its longitudinal reduction, as clinically expected. A video depicting all 37 frames of the cardiac cycle is also provided (additional file 1).
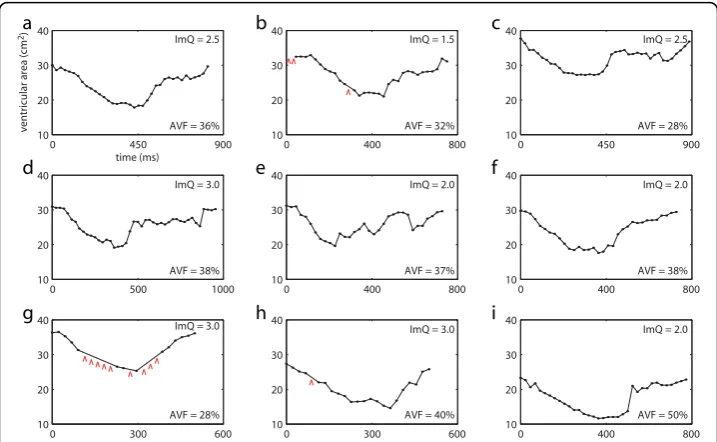
Figure 8 presents the measured AVCs for the selected video sequences. The red arrows in (b), (g), and (h) indicate temporal frames in which the automatic segmentation failed. These were mainly due to low contrast between muscle and blood, and due to acoustic shadowing. Severe segmentation issues due to rib artifacts were observed in sequences (e), (h) and (i). In these sequences, the measured ventricular areas in some (e) or all frames (h, i) were considerably lower then the true values. Nevertheless, all AVCs present a similar shape, distinctly alternating between a period of large area (diastole) and a period of small area (systole). These curves reflect the global wall motion in differ-ent stages of the cardiac cycle, from isovolumetric contraction to atrial systole (see
Figure 6). Figure 8 also presents the measured AVF for each subject. Except for the result in (i), which was severely affected by image artifacts, all measured AVFs are within the typical range of AVF values in healthy subjects [1]. This is the expected result, as the selected subjects did not present cardiac pathologies.
Table 2 presents the results of the quantitative evaluation. The proposed method is compared with four alternative echocardiographic image segmentation algorithms from the literature. The proposed method achieved higher cross-correlation with manual segmentation than the methods by Klingler Jr et al. [2] and Amorim et al. [10] for high quality images. However, it is important to note that Klingler Jret al. used com-posite images, each obtained by averaging over ten cardiac cycles, and that the quality of individual images is only described as “acceptable”. Furthermore, their method was evaluated only on canine models. Compared with the results presented by Choy and Jin [3], the proposed method had lower performance in terms of RMSd for high quality images, but performed better for images of low and average image quality. The pro-posed method also presented better overall performance than the algorithm by Lacerda et al. [8], in terms of percent error and error sum.
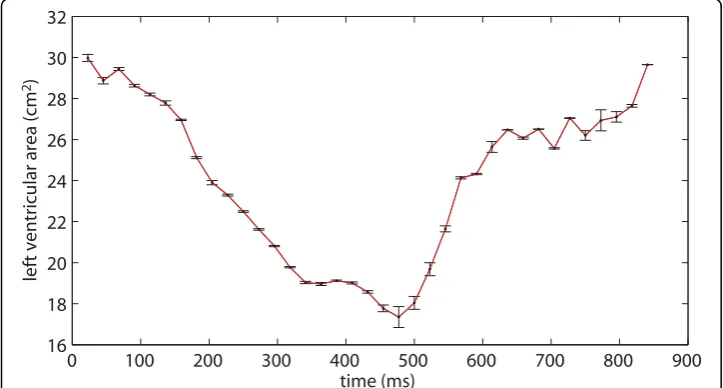
Figure 9 presents the results of the experiment for evaluating intra- and inter-opera-tor variabilities. The atrioventricular barrier placement procedure was performed by four operators, with ten repetitions for each operator. The graph shows the mean ven-tricular area for each temporal frame, and the associated standard deviations. The stan-dard deviations on each temporal frame ranged from 0% to 0.51%, with a mean of 0.12%. Measured AVFs ranged from 35.7% to 37.1%. The mean AVF was 36.2%, and the standard deviation was 0.4%. Such small variations between repetitions ensure the repeatability of the results generated by the algorithm. This indicates that user inter-vention does not generate undesired discrepancies when evaluating clinically important parameters, such as the AVF.
The watershed algorithm is a common technique for image segmentation, but its use in medical imaging has been limited, mostly due to oversegmentation and sensitivity to noise. In order to solve this problem, the watershed transformation has typically been used in combination with prior shape knowledge [28], or with contour extraction tech-niques [3]. In this work, a multi-stage preprocessing module was used to reduce image noise, increase image contrast, and modify the image homotopy. After preprocessing, the watershed algorithm is capable of successfully segmenting the left ventricle. The final contour is obtained by reducing the size of the segmented region, using a novel contour correction algorithm.
Figure 9Intra- and inter-operator variability of ventricular area estimation. The atrioventricular barrier placement procedure was performed by four operators, with ten repetitions for each operator. This AVC shows the mean ventricular area for each temporal frame (dots), and the corresponding standard deviations (error bars). Measured AVFs ranged from 35.7% to 37.1% (36.2% ± 0.4%).
Table 2 Quantitative comparison between the proposed approach and alternative meth-ods from the literature.
image quality number of images
RMSd CCC PE (%) ES (%)
Proposed method
high 20 2.14 ± 0.367 0.985 ± 0.011 2.49 ± 2.46 9.62 ± 7.9
average 23 2.53 ± 0.398 0.901 ± 0.024 7.56 ± 2.51 16.20 ± 8.23 low 17 2.99 ± 0.695 0.734 ± 0.101 15.10 ± 7.98 18.59 ± 7.02
Klingler Jret al. [2]
acceptablea 121b 0.93
Choy and Jin [3] high 10 1.7 ± 0.7
average 8 3.5 ± 1.0
Lacerdaet al. [8] high 7 10.65 ± 2.47 18.51 ± 5.06
average 5 18.06 ± 7.49 24.62 ± 7.89
Amorimet al. [10]
high 8 0.917 10.79 ± 2.95
a
canine models;
b
composite images, each obtained by averaging over ten cardiac cycles.
The proposed segmentation algorithm improves upon the method proposed by Andradeet al. [13] by incorporating a time-averaging denoising stage and an atrioven-tricular barrier stage. These stages make use of additional temporal frames for noise reduction and for addressing issues with mitral valve opening, respectively. As a result, the algorithm may now be used over a complete cardiac cycle, thus allowing the con-struction of the area variation curve and the calculation of the area variation fraction. The drawbacks of the proposed temporal-averaging stage are a reduction in temporal resolution (from 23 ms to 46 ms) and the need for data from two consecutive cardiac cycles. These are not expected to cause loss of diagnostic information, as the use of 50 ms temporal resolution and of acquisition segmentation across multiple heartbeats is widely accepted in several cardiovascular imaging modalities. The main limitation of the proposed atrioventricular barrier stage is the requirement of operator interaction. However, the proposed method may be made fully automatic by replacing this stage with an automatic mitral valve identification algorithm [26,27].
The proposed method for estimating the AVF could potentially be used for evaluat-ing the global systolic function of the left ventricle. In patients with severe regional wall motion abnormalities, the AVF is expected to reflect segmental abnormalities and could potentially be used for distinguishing between normal and abnormal subjects. In patients with moderate or mild regional abnormalities, the proposed method could be used in combination with other approaches - e.g., ejection fraction, cardiac output, initial diastolic volume, atrial volume, mitral flow - for a more accurate diagnosis. A potentially useful technique for assessing regional wall function in echocardiography is color kinesis [29,30]. While the proposed method uses image processing techniques for identifying the blood-endocardial interface, color kinesis processes the ultrasound backscatter data. However, visualization and quantitation approaches similar to those used in color kinesis could potentially be implemented using the contours estimated with the proposed image segmentation method. Future work will be aimed at imple-menting estimation of regional AVF, for detecting and locating segmental wall motion abnormalities.
Only apical 4-chamber long-axis views were used in this work. However, the pro-posed technique may also be used in apical 2-chamber short-axis and long-axis images. The combined segmentation of these different views may potentially be used for esti-mating left ventricular volume [1]. From this, it would be possible to construct the volume variation curve, which may provide information complementary to the AVC. The proposed algorithm is expected to also work well with 2-chamber long-axis images, since these typically present similar visual features and image quality when compared with 4-chamber long-axis images. A similar algorithm for automatic seg-mentation of dynamic 2-chamber short-axis images is proposed in Refs. [9,31]. A methodology that aids medical professionals in diagnosing cardiac pathologies based on the area and/or volume variation curves may be a natural continuation of this study.
Conclusions
fraction results obtained from the AVCs of healthy volunteers were in agreement with medical literature [1]. The AVC may be used by specialists for visually identifying the main stages of the cardiac cycle, such as atrial systole, rapid filling, slow filling, and ejection. The measurement of the duration of each of these stages may be useful for clinical analysis of global ventricular function. The AVF may potentially be used for functional evaluation of patients with different cardiopathies, especially those with severe functional repercussion.
Additional file 1: Video clip showing the dynamic segmentation of the left ventricle. [MPEG2 video: addfile1. mpg] (left) preprocessed image with atrioventricular barrier; (center) watershed segmentation; (right) estimated contour. Note the automatic positioning of the atrioventricular barrier, which dynamically tracks the mitral valve. This 2D-echo sequence was classified as of average image quality by a specialist.
Acknowledgements
The present study was supported by CNPq, a Brazilian government agency for scientific and technological development:“Chamada Conjunta MCT/SEPIN-FINEP-CNPq 01/2002, Programa de Apoio à Pesquisa e
Desenvolvimento e Inovação em Tecnologia da Informação PDI - TI”. BM received a M.Sc. fellowship from the Brazilian Ministry of Education (MEC/CAPES).
Author details 1
Department of Electrical Engineering, University of Brasília, Brasília, DF, Brazil.2Department of Computer Science, University of Brasília, Brasília, DF, Brazil.3UnB-Gama Faculty, University of Brasília, Gama, DF, Brazil.4School of Medicine,
University of Brasília, Brasília, DF, Brazil.
Authors’contributions
BM and MMA set up the experimental infrastructure, designed, implemented, and evaluated the original version of the proposed algorithm, and helped with text writing and quantitative evaluation. SAMJ improved the algorithm, wrote the first draft of this manuscript, and helped with video editing. JLAC and PAB helped with team management, technical consulting, experimental methodology, text structuring and writing, figure design, and algorithm refining. HSC provided clinical motivation and interpretation, and participated in the experimental setup and algorithm design. DFV acquired the echocardiographic data, manually segmented the images, and provided clinical evaluation of the results. AFR helped with algorithm design, and provided technical consulting and advising. FAON was the M.Sc. thesis advisor of BM, and is the Ph.D. thesis advisor of SAMJ. He is the principal investigator for the project that funded this work, and proposed and refined the segmentation algorithm. All authors read and approved the final manuscript.
Competing interests
PAB, AFR and FAON declare potential ownership interests: Signax Engenharia e Tecnologia da Informação Ltda. HSC declares potential ownership interests: Humano Tecnologia da Informação Ltda. SAMJ, BM, MMA, JLAC and DFV have no competing interests.
Received: 14 May 2009
Accepted: 15 January 2010 Published: 15 January 2010
References
1. Oh JK, Seward JB, Tajik AJ:The echo manual.Philadelphia: Lippincott Williams and Wilkins 1999.
2. Klingler Jr J, Vaughan C, Fraker Jr T, Andrews L:Segmentation of echocardiographic images using mathematical morphology.IEEE Transactions on Biomedical Engineering1988,35(11):925-934.
3. Choy MM, Jin JS:Morphological image analysis of left-ventricular endocardial borders in 2D echocardiograms.SPIE Proceedings on Medical Imaging: February 10 1996; Newport Beach1996,2710:852-863.
4. Choy MM, Jin JS:Extracting endocardial borders from sequential echocardiographic images.IEEE Engineering in Medicine and Biology Magazine1998,17:116-121.
5. Ohyama W, Wakabayashi T, Kimura F, Tsuruoka S, Sekioka K:Automatic left ventricular endocardium detection in echocardiograms based on ternary thresholding method.Proceedings of the 15th International Conference on Pattern Recognition: 3-8 September 2000; Barcelona2000,4:320-323.
6. Cheng J, Foo SW, Krishnan SM:Automatic detection of region of interest and center point of left ventricle using watershed segmentation.Proceedings of the 2005 IEEE International Symposium on Circuits and Systems: 23-26 May 2005; Kobe2005,1:149-151.
7. Cheng J, Foo SW, Krishnan SM:Watershed-presegmented snake for boundary detection and tracking of left ventricle in echocardiographic images.IEEE Transactions on Information Technology in Biomedicine2006,10(2):414-416. 8. Lacerda SG, da Rocha AF, Vasconcelos DF, Carvalho JLA, Sene Jr IG, Camapum JF:Left ventricle segmentation in
echocardiography using a radial-search-based image processing algorithm.Proceedings of the 30th Annual International Conference of the IEEE Engineering in Medicine and Biology Society: August 20-24 2008; Vancouver2008, 222-224.
10. Amorim JC, dos Reis MC, Carvalho JLA, da Rocha AF, Camapum JF:Improved segmentation of echocar-diographic images using fusion of images from different cardiac cycles.Proceedings of the 31st Annual International Conference of the IEEE Engineering in Medicine and Biology Society: September 2-6 2009; Minneapolis2009, 511-514.
11. Fernández-Caballero A, Vega-Riesco JM:Determining heart parameters through left ventricular automatic segmentation for heart disease diagnosis.Expert Systems with Applications2009,36(2):2234-2249.
12. Lin N, Yu W, Duncan JS:Combinative multi-scale level set framework for echocardiographic image segmentation. Medical Image Analysis2003,7(4):529-537.
13. de Andrade MM, Espinoza BLM, Nascimento FAO, da Rocha AF, Vasconcelos DF, de Jesus PC, Carvalho HS:Algoritmo híbrido para segmentação do ventrículo esquerdo em imagens de ecocardiografia bidimensional.Revista Brasileira de Engenharia Biomédica2006,22:23-33.
14. Costa Filho CFF, Moura LA, Costa MG:Revisão sobre métodos de segmentação 2D de ventrículo esquerdo.Revista Brasileira de Engenharia Biomédica1999,15(3):141-158.
15. Vitale DF, Lauria G, Pelaggi N, Gerundo G, Bordini C, Leosco D, Rengo C, Rengo F:Optimal number of averaged frames for noise reduction of ultrasound images.Proc Computers in Cardiology: 5-8 September 1993; London1993, 639-641.
16. Chia JM, Fischer SE, Wickline SA, Lorenz CH:Arrhythmia rejection using a VCG-based triggering algorithm. Proceedings of the 8th Annual Meeting of the International Society for Magnetic Resonance in Medicine: April 1-7 2000; Denver2000, 201.
17. Coifman RR, Donoho DL:Translation invariant denoising.Tech. Rep. 475Department of Statistics, Stanford University 1995.
18. Chen P, Suter D:Shift-invariant wavelet denoising using interscale dependency.Proceedings of the IEEE International Conference on Image Processing: 24-27 October 2004; Singapore2004,2:1005-1008.
19. Hua G, Orchard MT:A new interpretation of translation invariant denoising.Proceedings of the IEEE International Conference on Acoustics, Speech, and Signal Processing: 17-21 May 2004; Montreal2004,3:190-192.
20. Zong X, Laine AF, Geiser EA:Speckle reduction and contrast enhancement of echocardiograms via multiscale nonlinear processing.IEEE Transactions on Medical Imaging1998,17(4):532-540.
21. Gonzales RC, Wood RE:Digital image processing.New Jersey: Prentice-Hall 2002.
22. Beucher S:The watershed transformation applied to image segmentation.Proceedings of the 10th Pfefferkorn Conference on Signal and Image Processing in Microscopy and Microanalysis: September 16-19 1991; Cambridge1991, 299-314.
23. Beucher S:Watersheds of functions and picture segmentation.Proceedings of the 1982 IEEE International Conference on Acoustics, Speech, and Signal Processing: August 3-5 1982; Paris1982,7:1928-1931.
24. Vincent L, Soille P:Watersheds in digital spaces: an efficient algorithm based on immersion simulations.IEEE Transactions on Pattern Analysis and Machine Intelligence1991,13(6):583-598.
25. Lilly P, Jenkins J, Bourdillon P:Automatic contour definition on left ventriculograms by image evidence and a multiple template-based model.IEEE Transactions on Medical Imaging1989,8(2):173-185.
26. Liu YS, Ching YT, Chen SJ:An automatic method to determine mitral annular lines from 2D+1D pre-cordial echocardiogram.Proceedings of the 22nd Annual International Conference of the IEEE Engineering in Medicine and Biology Society: 23-28 July 2000; Chicago2000,3:1717-1719.
27. Ching YT, Chen SJ, Chang CL, Lin CY, Liu YH:Finding the mitral annular lines from 2-D + 1-D precordial
echocardiogram using graph-search technique.IEEE Transactions on Information Technology in Biomedicine2004,8:1-4. 28. Hamarneh G, Li X:Watershed segmentation using prior shape and appearance knowledge.Image and Vision
Computing2009,27(1-2):59-68.
29. Lang RM, Vignon P, Weinert L, Bednarz J, Korcarz C, Sandelski J, Koch R, Prater D, Mor-Avi V:Echocar-diographic quantification of regional left ventricular wall motion with color kinesis.Circulation1996,93(10):1877-1885. 30. Mor-Avi V, Vignon P, Koch R, Weinert L, Garcia MJ, Spencer KT, Lang RM:Segmental analysis of color kinesis images:
new method for quantification of the magnitude and timing of endocardial motion during left ventricular systole and diastole.Circulation1997,95(8):2082-2097.
31. dos Reis MC, Carvalho JLA, Macchiavello BL, Vasconcelos DF, da Rocha AF, Nascimento FAO, Camapum JF:On the use of motion-based frame rejection in temporal averaging denoising for segmentation of echocardiographic image sequences.Proceedings of the 31st Annual International Conference of the IEEE Engineering in Medicine and Biology Society: September 2-6 2009; Minneapolis2009, 507-510.
doi:10.1186/1475-925X-9-5
Cite this article as:Meloet al.:Semi-automatic algorithm for construction of the left ventricular area variation