SOFTWARE
DiNAR: revealing hidden patterns of plant
signalling dynamics using Differential Network
Analysis in R
Maja Zagorščak
1*, Andrej Blejec
1,2, Živa Ramšak
1, Marko Petek
1, Tjaša Stare
1and Kristina Gruden
1Abstract
Background: Progress in high-throughput molecular methods accompanied by more complex experimental
designs demands novel data visualisation solutions. To specifically answer the question which parts of the specifi-cal biologispecifi-cal system are responding in particular perturbation, integrative approach in which experimental data are superimposed on a prior knowledge network is shown to be advantageous.
Results: We have developed DiNAR, Differential Network Analysis in R, a user-friendly application with dynamic visu-alisation that integrates multiple condition high-throughput data and extensive biological prior knowledge. Imple-mented differential network approach and embedded network analysis allow users to analyse condition-specific responses in the context of topology of interest (e.g. immune signalling network) and extract knowledge concerning patterns of signalling dynamics (i.e. rewiring in network structure between two or more biological conditions). We
validated the usability of software on the Arabidopsis thaliana and Solanum tuberosum datasets, but it is set to handle
any biological instances.
Conclusions: DiNAR facilitates detection of network-rewiring events, gene prioritisation for future experimental design and allows capturing dynamics of complex biological system. The fully cross-platform Shiny App is hosted and
freely available at https ://nib-si.shiny apps.io/DiNAR . The most recent version of the source code is available at https ://
githu b.com/NIB-SI/DiNAR / with a DOI 10.5281/zenodo.1230523 of the archived version in Zenodo.
Keywords: Biological networks, Clustering, Gene expression, Time series, Dynamic network analysis, Dynamic data visualisation, Web application, Multi-conditional datasets, Background knowledge
© The Author(s) 2018. This article is distributed under the terms of the Creative Commons Attribution 4.0 International License (http://creat iveco mmons .org/licen ses/by/4.0/), which permits unrestricted use, distribution, and reproduction in any medium, provided you give appropriate credit to the original author(s) and the source, provide a link to the Creative Commons license, and indicate if changes were made. The Creative Commons Public Domain Dedication waiver (http://creat iveco mmons .org/ publi cdoma in/zero/1.0/) applies to the data made available in this article, unless otherwise stated.
Background
Technological progress in biological data generation enhanced development of network modelling to allow comprehension at systems level [1]. The ideal in silico network should be concise and able to capture key fea-tures of the actual system. Although this is difficult to achieve, particularly with non-model organisms, net-work-based strategies have proven very useful for inter-preting biological data [2]. In line with emerging network views of biological systems, development of user-friendly visualisation tools becomes even more relevant.
Efficient network visualisation is lagging behind, espe-cially in exploration of multi-conditional setups. Few solutions combining background knowledge and network analysis to enable visualisation of experimental data have so far been implemented in this area [3–9]. We devel-oped an application to extend existing tools and further facilitate biological insight into dynamic rewiring events. DiNAR uses prior knowledge accompanied by differential network analysis to visualise complex experimental data-sets. Main advanced features of DiNAR are (1) dynamic visualisation of complex multi-conditional experiments, (2) identification of strong differential interactions and (3) recall of latent effects that are present in multi-con-ditional experiments. Although DiNAR was primar-ily set for analysis of Arabidopsis thaliana and Solanum
Open Access
*Correspondence: [email protected]
1 Department of Biotechnology and Systems Biology, National Institute
of Biology, Večna pot 111, 1000 Ljubljana, Slovenia
tuberosum datasets, it can handle other background knowledge networks in combination with experimen-tal dataset of interest, e.g. transcriptomics, proteomics, metabolomics.
Implementation
DiNAR is written in R [10] and extended with JavaScript and Shiny package for interactive web applications. The implementation requires R version 3.1 or higher and sev-eral R packages, including animatoR [11], visNetwork [12] and ndtv [13]. Homotopy, as implemented in anima-toR package, is used to interpolate node and edge weight value between discrete conditions/time-points. visNet-work, a browser based visualization library, allows imple-mentation for easier manipulation and interaction with the data. Implementation of the ndtv package functions provides downloadable interactive movie rendering.
The fully cross-platform validated application is hosted and freely available at https ://nib-si.shiny apps.io/DiNAR . Source code is stored at https ://githu b.com/NIB-SI/ DiNAR , where a more detailed application manual and package list are available. DiNAR can also be run locally in R or hosted on a local RStudio Shiny Server.
Current application release provides the user with two embedded background knowledge networks: manually constructed plant immune signalling network (PIS) [14] translated to S. tuberosum at the orthologue groups level [15] and one constructed from prior knowledge on A.
thaliana—the A. thaliana Comprehensive Knowledge
Network (AtCKN) [15]. AtCKN, containing 20,012 nodes and 70,091 connections, was first analysed to determine disjoint communities (i.e. clusters) based on network centrality measures, for easier visualisation. Multi-level community detections algorithm followed by spinglass community detection algorithm were used, both imple-mented in igraph R package [16]. As the result, AtCKN was divided into 48 clusters. DiNAR also provides an option of uploading a user-defined network. Any kind of network in the proper format can be used to visual-ise changes in omics dataset (e.g. transcriptomics, miR-NAomics, proteomics and metabolomics). Notice that the background network node identifiers should be con-sistent with the corresponding experimental data identi-fiers as well as the statistical analyses between different omics levels have to be standardised. Both static graph-ics and interactive animations can be exported, together with a record of user settings, which is compliant with FAIR guiding principles for reproducible research [17].
In addition to DiNAR core scripts, optional pre-pro-cessing and clustering tools (subApps) are also hosted at shinyapps.io platform: https ://nib-si.shiny apps.io/pre-proce ssing and https ://nib-si.shiny apps.io/clust ering , while their source code is freely available under GitHub
subApps sub-repository. Microarray/NGS data analysis from GEO with examples is available under GEOData-Analysis sub-repository. Gene orthologue groups of A. thaliana, potato and several other non-model plant spe-cies are available at GoMapMan web-accessible resource [18]. Test examples, description of clustering analysis pipeline, instructions for installation and technical trou-bleshooting guide are also deposited at https ://githu b.com/NIB-SI/DiNAR /.
Results and discussion
Application features
DiNAR core app
DiNAR landing web page provides the application over-view, with links to user tutorials and tools. The interactive sidebar menu provides guidance through the required analysis steps (Fig. 1). In the case of any inconsistencies or missing steps, the application will not proceed to the next step.
For differential network visualisation, user selects among provided A. thaliana or S. tuberosum networks or uploads the pre-processed (preferably by DiNAR sub-App) user-defined background knowledge network. DiNAR module size limit, in the term of visualisation, is between 2 and 16,384 edges, excluding loops (self-activa-tion or self-inhibi(self-activa-tion, e.g. autocatalysis, oligomerisa(self-activa-tion, and autophosphorylation). Next, user uploads the experi-mental dataset of interest. Condition-specific networks are then dynamically constructed according to user-defined cut-off parameters: thresholds for the measure of statistical significance (e.g. adjusted p value < 0.05) and the threshold for the node weight values (e.g. interpo-lated absolute values of logFC 0.5, here denoted with abs(n) and abs(m) ). If two connected nodes (elements
from n and m) pass the cut-off criteria, they and the edge connecting them are visualised over the selected back-ground network. Node weight values are used to define the node size and colour as well as to define degree of edge weight
abs(n)
max(abs(n),1)+ abs(m) max(abs(m),1)
max(maxabs(abs(n()n),1)+ abs(m) max(abs(m),1),1)
. As DiNAR
does not use fixed cut-off thresholds, the user is allowed to fine-tune which level of expression change to disregard in a particular in silico investigation and to detect more subtle differences. If larger clusters are imported the user-friendly additional filtering by node degree is provided.
Visualisaon
Parameter selecon
Select Network:
Arabidopsis thaliana
Solanum tuberosum
Upload custom network
Custom network:
pre-processing subApp
clustering subApp
upload experimental data
select order for visualisaon
stascal test cut-off
node weight cut-off
define colour palee
define gradient boundaries
addional filter by:
cluster ID
node ID
minimal node degree
stac frozen
stac interacve
dynamic frozen
dynamic interacve
zoom
drag
hover
rearrange
select first neighbours
select animaon
speed
selecnterpolated
condion
exports:
analysis sengs log
.pdf, .png & interacve .html images
.html & .pdfinteracve animaons
features
modes
Background informaon
background
cluster details
nodes/edges
tables
MapMan BIN
enrichment
node-cluster
affiliaon
node degree
distribuon
reacon type
distribuon
network
cluster
exports:
TSV files with addional aributes:
clusterID, x, y coord., node degree, ...
.GraphML
and animatoR modes) results can be exported from the application, as well as the analysis settings log. See Fig. 1 for detailed overview of DiNAR features.
DiNAR subApps
Pre-processing subApp facilitates the construction of DiNAR′ s Custom Network. Generally, nodes and edges
tables with predefined structure for DiNAR input could be constructed manually (see the manual for more details), however for larger networks this would be unnecessarily time-consuming. Pre-processing subApp reads the supplied nodes and edges in three formats: tables (tab, comma or semicolon separated), GraphML (standard graph structure data format) or GraphML combined with XGMML. GraphML and XGMML for-mats can be exported from Cytoscape 3.6 [19], yEd [20] and similar applications/platforms. GraphML with node/ edge attributes is also generated and could be exported from the subApp. In the case of uploading one of the first two formats, either a table or a sole GraphML file, coordi-nates are assigned to each node using a two-dimensional grid followed by Kamada–Kawai layout. Should the user want to use own defined coordinates, both the GraphML and XGMML files need to be uploaded. In addition, the pre-processing subApp also calculates the node degree measure. Files generated by the subApp are available at https ://githu b.com/NIB-SI/DiNAR /tree/maste r/subAp ps/clust ering /examp les.
For the visualisation of large networks (e.g. AtCKN) to be informative, the network clustering step is necessary. Network of interest should be provided in GraphML for-mat. Prior to the clustering step, the network is simpli-fied by the removal of self-loops and duplicated edges. The first clustering step detects community structure using multi-level modularity optimization algorithm, excluding communities (i.e. clusters) with less than 5 nodes from further analyses. In the next step, densely connected (approximately fully connected subgraphs) and star-like clusters are identified. Densely connected clusters are defined as clusters with n(n−1) edges, with
n being the number of nodes. Star-like communities are defined as graphs that contained only one hub node and with an edge count close to the number of nodes. A hub node is defined as the node with a degree higher or equal to 60% of the maximal node degree of the cluster, high closeness, and betweenness in undirected graph close to (n−1)(n−2)/2 , where n is the number of nodes. Upon
identification of densely connected and star-like clus-ters, they are excluded from further processing, as are all clusters with less than 210 nodes and 211 edges. The remaining clusters are clustered further using spinglass community detection algorithm into the same number of sub-clusters as the number of hub nodes calculated for
that cluster. For visualisation, first a two-dimensional grid layout is used, followed by either Fruchterman-Reingold (number of nodes ≤26 and number of edges ≤26 ) or Kamada–Kawai layout (otherwise). The final output of the clustering subApp are tables of nodes and edges, with information about cluster affiliation, node coordinates and degree, whilst preserving information about between cluster relations.
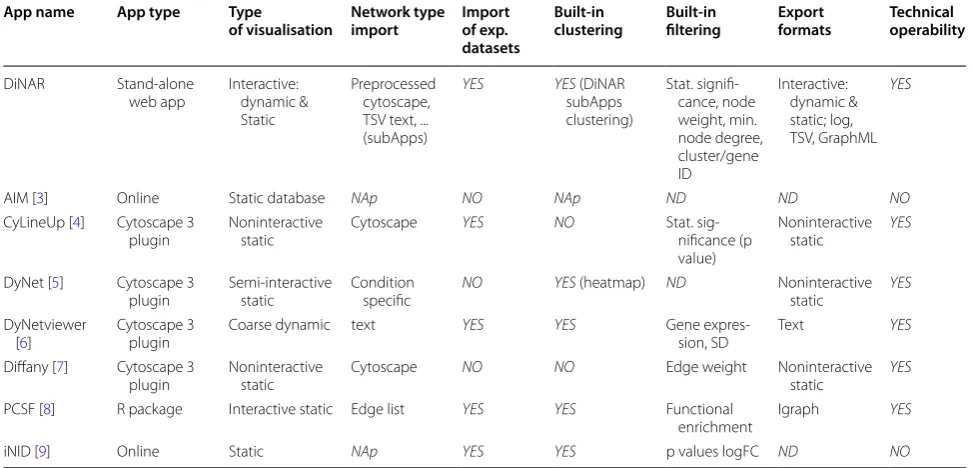
Method validation
Overview of DiNAR features and most similar avail-able applications is presented in Tavail-able 1. As no soft-ware was directly comparable to DiNAR, we validated our approach through biological interpretation of two plant pathogen interaction experimental datasets. Plant immune signalling response against pathogens is a com-plex phenomenon that involves plant perception of the pathogen, transduction of the signal within the plant cell and results in reprogramming of the plant metabolism [21]. Hormonal crosstalk, in general, plays an important role in plant responses to stress. In addition to ethylene (ET), jasmonic acid (JA) and salicylic acid (SA) [22], the importance of other plant hormones, whose basic func-tion is not defence, including abscisic acid (ABA), gibber-ellin (GA), auxin (AUX) and cytokinin (CK) was shown. Depending on the pathogen and host physiological state, specific plant components are activated or repressed in a well-defined time-dependent manner. Analysing large datasets in DiNAR enables researchers to comprehend the regulatory events of such complex, inter-connected and highly dynamical biological systems.
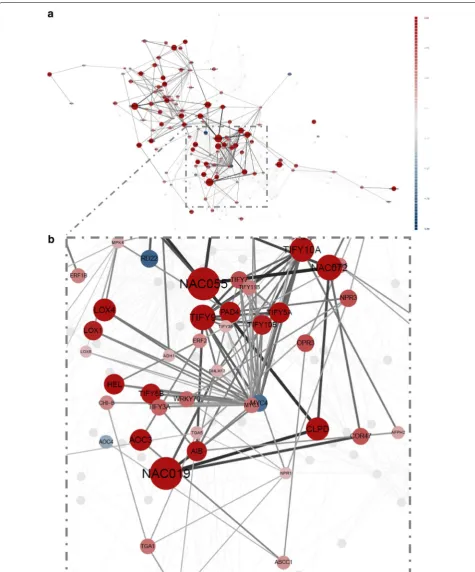
Arabidopsis thaliana
Fig. 2 Arabidopsis thaliana response to bacterial pathogen Pseudomonas syringae DC3000. DiNAR static network visualization a of cluster 40 in the AtCKN in response to infection with Pseudomonas syringae 17.5 hpi (adjusted p value < 0.05, absolute value of logFC 0.5, min node degree
3). b Magnification of panel a as visible in dynamic-animatoR mode. Node colours correspond to gene regulation with red (upregulated) and blue
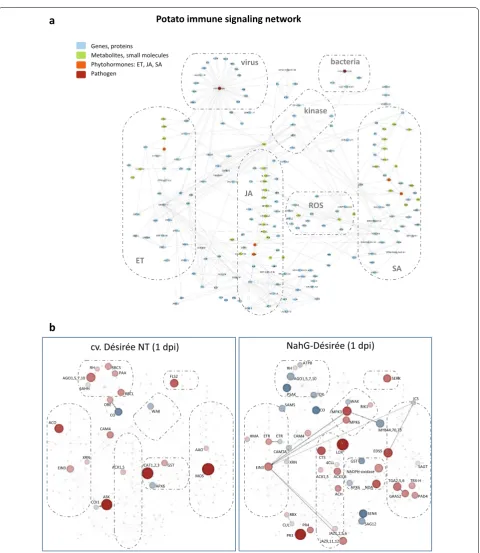
Fig. 3 Visualisation of data in PIS network using DiNAR. a Potato immune signalling network comprising metabolic, signalling and gene regulatory pathways of SA, JA and ET. Nodes representing transcripts/proteins are coloured blue, metabolites and small compounds green and phytohormones orange. Pathogens are represented as red nodes. Parts of network describing SA, JA and ET pathways, kinases and ROS signalling as well as viral and bacterial interactors are marked with dashed line. b Transcriptional response of potato leaves to infection with PVY 1 dpi. DiNAR static–interactive visualisation of PIS network of NT cv. Désirée (left panel) and NahG-Désirée (right panel) is shown (adjusted p value < 0.05, no logFC cut-off, min node degree 1). Node colours correspond to gene regulation with red (upregulated) and blue (downregulated). The size of nodes correspond to absolute logFC values. Edges describing the reactions between the components are directed and represent activation (full line, unilateral arrows), inhibition (full line) or binding (dashed line, bilateral arrows)
Genes, proteins
Metabolites, small molecules Phytohormones: ET, JA, SA Pathogen
Potato immune signaling network
virus bacteria
SA ET
JA
ROS
cv. Désirée NT (1 dpi) NahG-Désirée (1 dpi)
kinase
a
b
RH RBCS PAA AGO1,5,7,10
SAHH
RBCL
OBE
CO
FLS2
WAK
CAM4
ACX1,5
ASK COI1 ACO
XRN
EIN3 CAT1,2,3 GST
APX6
AAO
MOS
SERK ATPB
RH
AGO1,5,7,10
PSAK TDX
SAMS CO
WAK BIK1 MPK3
MPK6
HMA ETR CTR CAM4
CAMTA
XRN EIN3
RBX
CUL PR4
PR3
ICS
MYB44,70,73
EDS5
SAGT
TGA2,5,6 TRX-H
GRAS2 PAD4 GST
NADPH-oxidase
APX6 NDA
SEN4
SAG12 LOX
CTS 4CLL
ACX1,5 ACX3,6
ACH
response transcription factors and jasmonate biosyn-thesis genes. The second corresponds to reactivation of the previously mentioned salicylic acid response module at 17.5 hpi (Fig. 2b). These results illustrate how DiNAR provides easy insight into studied process and reveals additional information in comparison to using solely standard statistical analyses.
Potato‑virus PVY interaction
For the second example we analysed potato time series transcriptional response to potato virus Y (PVY) [24] in the manually constructed plant immune signalling net-work [14] comprising of 205 nodes and 422 edges, cov-ering metabolic, signalling and gene regulation networks of SA, JA and ET (Fig. 3a). The network was originally built by extensive article curation for Arabidopsis. Here we used its potato translation based on orthologue gene information [15]. In potato dataset, gene expression was measured 1, 3, 4, 5 and 7 days post inoculation (dpi). Two genotypes were analysed; non-transgenic (NT) cv. Désirée and its transgenic counter-part depleted in accu-mulation of salicylic acid (NahG-Désirée).
To evaluate the role of SA in potato immune signalling, dynamic gene expression changes between NT Désirée and NahG-Désirée were compared using Dynamic-VisNetwork and Dynamic-animatoR implemented in DiNAR (Additional files 2 and 3). The results show that SA-deficiency perturbs the transcriptional reprograming of the genes included in PIS network.
MAP kinases (MPKs) are regulated in different stages (1, 4 and 7 dpi) of NahG-Désirée response, even though no differences in expression of those genes were observed in NT plants. Interestingly, induction of MPK3 and MPK6 at 1 dpi coincides with the activation of the main ET responsive transcription factor EIN3 and respiratory burst enzyme NADPH-oxidase which expression levels are also induced. SA-deficiency changes the responsive-ness of hormonal signalling pathway at different stages. For example, at 1 dpi components of JA biosynthesis (LOX, CTS, 4CLL, ACX3,6, and ACX 1, ACH) and JA signalling (JAZ 9, 11, 12 and JAZ 1, 2, 5, 6) are induced in NahG-Désirée, however remain unresponsive in NT genotype.
Even though SA is traditionally viewed as the most important hormone in virus-induced response [25], we show dynamic changes in expression of several ET-signalling components at different stages of Désirée NT response to PVY (Fig. 3b). At 1 dpi an induction of ACO (ACC oxidase), an ET-biosynthesis gene is observed and continuous to be induced at later time points (4 and 5 dpi), reaching the highest peak at 7 dpi. EIN3 is induced at 1 and 3 dpi and it induces the transcription of EBF gene resulting in expression peak of EBF gene at 3 dpi. At 4 dpi repression of several ethylene responsive factors (ERF1,2; ERF5,6; ERF 104, ERF105) as well as EBF gene occurs. With these examples, we show that DiNAR enables novel insights into dynamic gene expression reprogramming. Table 1 Comparison of DiNAR with most similar tools available
exp. experimental, NAp not applicable, ND not possible to determine, SD standard deviation, technical operability accesibility at the time of testing, TSV tab separated values
App name App type Type
of visualisation Network type import Import of exp. datasets
Built-in
clustering Built-in filtering Export formats Technical operability
DiNAR Stand-alone
web app Interactive: dynamic & Static
Preprocessed cytoscape, TSV text, ... (subApps)
YES YES (DiNAR
subApps clustering)
Stat. signifi-cance, node weight, min. node degree, cluster/gene ID
Interactive: dynamic & static; log, TSV, GraphML
YES
AIM [3] Online Static database NAp NO NAp ND ND NO
CyLineUp [4] Cytoscape 3
plugin Noninteractive static Cytoscape YES NO Stat. sig-nificance (p
value)
Noninteractive
static YES
DyNet [5] Cytoscape 3
plugin Semi-interactive static Condition specific NO YES (heatmap) ND Noninteractive static YES
DyNetviewer
[6] Cytoscape 3 plugin Coarse dynamic text
YES YES Gene
expres-sion, SD Text
YES
Diffany [7] Cytoscape 3
plugin Noninteractive static Cytoscape NO NO Edge weight Noninteractive static YES
PCSF [8] R package Interactive static Edge list YES YES Functional
enrichment Igraph YES
Conclusion
The advantage of DiNAR, compared to other network visualization tools, is the dynamic visualization of multi-conditional datasets in the context of background knowl-edge on molecular interactions with embedded network analyses. It facilitates detection of network-rewiring events, gene prioritisation for future experimental design and allows capturing dynamics of complex biological sys-tem. Biological examples demonstrated how DiNAR pro-vides valuable information in revealing hidden patterns of plant signalling dynamics and knowledge extraction.
Additional files
Additional file 1. Dynamic visualisation of Arabidopsis thaliana response to Pseudomonas syringae. AtCKN network, cluster 40, GSE56094 experi-mental data, Pseudomonas syringae pv. tomato DC3000 vs Mock subset. Relative expression between Pseudomonas syringae and mock-treated plants has been log2 transformed. The absolute values are represented by the size of the node and differential expression is color-coded (red-induction, blue-repression of expression). Only genes that are significantly differentially expressed are visualized (FDR p < 0.05). Dynamic changes in gene expression following 0, 2, 3, 4, 6, 7, 8, 10, 11, 12, 14, 16 and 17.5 hpi are shown.
Additional file 2. Dynamic visualisation of immune signalling network response in potato cv. Désirée infected with virus PVY. PIS network, GSE58593 experimental data at the orthologue groups level. Relative expression between PVY and mock-treated plants has been log2 trans-formed. The absolute values are represented by the size of the node and differential expression is color-coded (red—induction, blue—repression of expression). Only genes that are significantly differentially expressed are visualized (FDR p < 0.05). Dynamic changes in gene expression 1, 3, 4, 5 and 7 dpi after infection with PVY are shown for Désirée plants. Additional file 3. Dynamic visualisation of immune signalling network response in potato cv. NahG-D\’esir\’ee infected with virus PVY. PIS network, GSE58593 experimental data at the orthologue groups level. Relative expression between PVY and mock-treated plants has been log2 transformed. The absolute values are represented by the size of the node and differential expression is color-coded (red—induction, blue—repression of expression). Only genes that are significantly dif-ferentially expressed are visualized (FDR p < 0.05). Dynamic changes in gene expression 1, 3, 4, 5 and 7 dpi after infection with PVY are shown for NahG-Désirée plants.
Abbreviations
Ath: Arabidopsis thaliana; app: application; CKN: Comprehensive Knowledge Network; dpi: days post inoculation; exp.: experimental hpi hours post inocula-tion; ID: identifier; MPKs: MAP kinases; min.: minimal; NA: not available; NAp: not applicable; ND: not determined; NT: non-transgenic; PIS: plant immune signalling; SD: standard deviation; stat.: statistical; subApp: subApplication; tp: time point.
Authors’ contributions
KG acquired funding and conceived, supervised and designed the research. MZ and AB developed the computational analysis, including data visualisation. MZ developed web application. MZ and ZR developed data analysis tools. MZ, MP and TS conducted method validation and interpreted the data. All authors contributed to writing the paper and conducted a critical revision. All authors read and approved the final manuscript.
1 Department of Biotechnology and Systems Biology, National Institute
of Biology, Večna pot 111, 1000 Ljubljana, Slovenia. 2 Department of
Organ-isms and Ecosystems Research, National Institute of Biology, Večna pot 111, 1000 Ljubljana, Slovenia.
Acknowledgements
The authors thank Špela Baebler, Marko Chersicola, José Gonçalves, Maja Križnik and Borut Mavrič for testing the application and suggestions on how to improve the user experience.
Competing interests
The authors declare that they have no competing interests. Availability of data and materials
Project name: DiNAR - Differential Network Analysis in R. Project home page:https ://githu b.com/NIB-SI/DiNAR . Operating system(s): Platform agnostic. Programming language(s): R, HTML, JavaScript and CSS. Other requirements: Internet connection. License: GPL-3 (https ://www.gnu.org/
licen ses/gpl-3.0.en.html). Any restrictions: none.
Funding
This work was supported by grants from the Slovene Research Agency [J4-7636, J7-7303 and N4-0026].
Publisher’s Note
Springer Nature remains neutral with regard to jurisdictional claims in pub-lished maps and institutional affiliations.
Received: 4 May 2018 Accepted: 24 August 2018
References
1. Ideker T, Krogan NJ. Differential network biology. Mol Syst Biol. 2012;8(565):1–9. https ://doi.org/10.1038/msb.2011.99.
2. Banf M, Rhee SY. Computational inference of gene regulatory networks: approaches, limitations and opportunities. Biochim Biophys Acta Gene Regul Mech. 2017;1860:41–52. https ://doi.org/10.1016/j.bbagr
m.2016.09.003.
3. Wang Y, Thilmony R, Zhao Y, Chen G, Gu YQ. AIM: a comprehensive Arabi-dopsis interactome module database and related interologs in plants. Database. 2014;2014:1–8. https ://doi.org/10.1093/datab ase/bau11 7. 4. Costa MCD, Slijkhuis T, Ligterink W, Hilhorst HW, de Ridder D, Nijveen H.
CyLineUp: a Cytoscape app for visualizing data in network small multi-ples. F1000Research 2016;5(May):635. https ://f1000 resea rch.com/artic
les/5-635/v1.
5. Goenawan IH, Bryan K, Lynn DJ. DyNet: visualization and analy-sis of dynamic molecular interaction networks. Bioinformatics. 2016;32(17):2713–5. https ://doi.org/10.1093/bioin forma tics/btw18 7. 6. Li M, Yang J, Wu FX, Pan Y, Wang J. DyNetViewer: a Cytoscape app for
dynamic network construction, analysis and visualization. Bioinformatics. 2017;34:1597–9. https ://doi.org/10.1093/bioin forma tics/btx82 1. 7. Landeghem SV, Parys TV, Dubois M, Inzé D, de Peer YV. Diffany: an
ontology-driven framework to infer, visualise and analyse differential molecular networks. BMC Bioinf. 2016;17:18. https ://doi.org/10.1186/
s1285 9-015-0863-y.
8. Akhmedov M, Kedaigle A, Chong RE, Montemanni R, Bertoni F, Fraenkel E, Kwee I. PCSF: an R-package for network-based interpretation of high-throughput data. PLoS Comput Biol. 2017;13(7):1–7. https ://doi.
org/10.1371/journ al.pcbi.10056 94.
9. Choi D, Choi J, Kang B, Lee S, Hyun Cho Y, Hwang I, Hwang D. iNID: an analytical framework for identifying network models for interplays among developmental signaling in Arabidopsis. Mol Plant. 2014;7(5):792– 813. https ://doi.org/10.1093/mp/sst17 3.
10. Team RC. R: a language and environment for statistical computing 2016.
•fast, convenient online submission •
thorough peer review by experienced researchers in your field • rapid publication on acceptance
• support for research data, including large and complex data types •
gold Open Access which fosters wider collaboration and increased citations maximum visibility for your research: over 100M website views per year •
At BMC, research is always in progress.
Learn more biomedcentral.com/submissions
Ready to submit your research? Choose BMC and benefit from: 11. Blejec A. animatoR: dynamic graphics in R 2016. https ://doi.org/10.5281/
zenod o.60228 . Accessed 26 April 2018.
12. Almende B, Benoit T, Titouan R. visNetwork: network visualization using ’vis.js’ library 2017. https ://githu b.com/datas torm-open/visNe twork . Accessed 26 April 2018.
13. Bender-deMoll S. ndtv: network dynamic temporal visualizations 2016.
http://statn et.org. Accessed 26 April 2018.
14. Miljkovic D, Stare T, Mozetič I, Podpečan V, Petek M, Witek K, Dermastia M, Lavrač N, Gruden K. Signalling network construction for modelling plant defence response. PLOS ONE. 2012;7(12):1–18. https ://doi.org/10.1371/
journ al.pone.00518 22.
15. Ramšak Ž, Coll A, Stare T, Tzfadia O, Baebler Š, Van de Peer Y, Gruden K. Network modelling unravels mechanisms of crosstalk between ethylene and salicylate signalling in potato. Plant Physiol. 2018;. https ://doi.
org/10.1104/pp.18.00450 .
16. Csárdi G, Nepusz T. The igraph software package for complex network research. InterJournal Complex Syst. 2006;1695:1–9. http://igrap h.org. Accessed 26 April 2018.
17. Wilkinson MD, Dumontier M, Aalbersberg IJ, Appleton G, Axton M, Baak A, Mons B. The FAIR Guiding Principles for scientific data management and stewardship. Sci Data. 2016;3:160018. https ://doi.org/10.1038/sdata
.2016.18.
18. Ramšak V, Baebler V, Rotter A, Korbar M, Mozetič I, Usadel B, Gruden K. GoMapMan: integration, consolidation and visualization of plant gene annotations within the MapMan ontology. Nucl Acids Res. 2014;42(D1):D1167–75. https ://doi.org/10.1093/nar/gkt10 56.
19. Shannon P, Markiel A, Ozier O, Baliga NS, Wang JT, Ramage D, Amin N, Schwikowski B, Ideker T. Cytoscape: a software environment for integrated models of biomolecular interaction networks. Genome Res. 2003;13(11):2498–504. https ://doi.org/10.1101/gr.12393 03.
20. yWORKS GmbH: yEd Graph Editor. https ://www.ywork s.com/produ cts/ yed. Accessed 26 April 2018.
21. Alazem M, Lin NS. Roles of plant hormones in the regulation of host-virus interactions. Mol Plant Pathol. 2015;16(5):529–40. https ://doi.org/10.1111/
mpp.12204 .
22. Vos IA, Moritz L, Pieterse CMJ, Van Wees SCM. Impact of hormonal cross-talk on plant resistance and fitness under multi-attacker conditions. Front Plant Sci. 2015;6:639. https ://doi.org/10.3389/fpls.2015.00639 .
23. Lewis LA, Polanski K, de Torres-Zabala M, Jayaraman S, Bowden L, Moore J, Grant M. Transcriptional dynamics driving MAMP-triggered immunity and pathogen effector-mediated immunosuppression in Arabidopsis leaves following infection with Pseudomonas syringae pv tomato DC3000. Plant Cell. 2015;27(11):3038–64. https ://doi.org/10.1105/tpc.15.00471 . 24. Stare T, Ramšak Ž, Blejec A, Stare K, Turnšek N, Weckwerth W, Wienkoop
S, Vodnik D, Gruden K. Bimodal dynamics of primary metabolism-related responses in tolerant potato-Potato virus Y interaction. BMC Genomics. 2015;16:716. https ://doi.org/10.1186/s1286 4-015-1925-2.
25. Vlot AC, Dempsey DA, Klessig DF. Salicylic acid, a multifaceted hormone to combat disease. Ann Rev Phytopathol. 2009;47:177–206. https ://doi.