© European Geosciences Union 2005
Geophysicae
Prediction and modelling of doubly-charged ions in the Earth’s
upper atmosphere
C. Simon1, J. Lilensten1, O. Dutuit2, R. Thissen2, O. Witasse3, C. Alcaraz4, and H. Soldi-Lose2 1Laboratoire de Plan´etologie de Grenoble, Grenoble, France
2Laboratoire de Chimie-Physique, Centre Universitaire, Orsay, France
3Research and Scientific Support Department of ESA, ESTEC, Noordwijk, The Netherlands 4Laboratoire LURE, Centre Universitaire Paris-Sud, Orsay, France
Received: 18 July 2004 – Revised: 12 January 2005 – Accepted: 28 January 2005 – Published: 30 March 2005
Abstract. We discuss the existence of the doubly-charged ions N++2 , O++2 and O++in the Earth’s ionosphere through the theoretical computation of density profiles over the al-titude range 100–500 km calculated with the TRANSCAR model. Photoproductions and electron impact productions are described in detail. The photochemical equilibrium as-sumption verified in this context yields density profiles, val-idated by comparison to the measurements of the satellite Atmosphere Explorer. Those three dications are lost essen-tially by dissociative recombination and collisions with the neutrals N2, O2and O. The metastable lifetime of N++2 is 3 s and is estimated at 4 s for O++2 . A survey of the sensitivity to geophysical parameters (solar activity, latitude and solar zenith angle) is also shown. Emphasis is cast on the need for rate constants for chemical reactions involving doubly-charged ions. The fit of the model yields an estimated value of 1.06±0.40×10⁻¹⁰cm3s−1 for the rate constant of the O+++O reaction.
Keywords. Ionosphere (Ion chemistry and composition, Modelling and forecasting, Planetary ionospheres)
1 Introduction
The existence of stable doubly-charged molecular ions in laboratories dates back to the early years of the last century when Aston (1920) and then Thomson (1921) made the first discovery of what was then proposed to be either CO++or N++2 . Half a century later aeronomers finally worked up an interest in the role of dications into the ionosphere: Vegard quoted by Meinel (1951) announced the identification of the OIII line at 500.8 nm in the aurora spectrum for the strong feature observed near 500.04 nm. However, as the 496.0-nm line (which completes the doublet lines for O++) did not appear in the spectrum, the discovery was finally rejected by most authors.
Correspondence to: C. Simon
Nearly at the same time as the lead for a spectral evidence was becoming more and more disputed, Hoffman (1967) reported the detection of O++ in the topside ionosphere
Fluid Transport
for N2+, O2+, O+, N+, NO+
andH+.
Electronic density
and temperature
Kinetic Transport
Suprathermal electrons Ionization rates
Heating rates
Inputs
Neutral atmosphere EUV solar flux Ionisation cross
sections Reaction rates
[image:2.595.107.500.68.342.2]Ion production rates
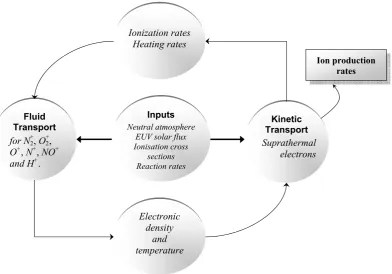
Fig. 1. Synopsis of the fluid/kinetic transport model TRANSCAR. We show only the outputs that are involved in the present study, together
with the basic couplings.
Very recently, a period which coincided with the matu-rity of both the experimental study of dications (see Mr´azek et al., 2000 and references therein) and ionosphere mod-els, Witasse et al. (2002, 2003) predicted the existence of a CO++2 layer in the atmosphere of Mars with the ionosphere model TRANSCAR which was specially adapted to the Mar-tian conditions (Witasse, 2000; Morel et al., 2004).
With the growing possibilities of high-resolution measure-ments made by satellites and ground-based facilities, we will have access to more and more ionospheric parameters: we present here the first complete computation of N++2 , O++2 and O++ion densities in the Earth’s upper atmosphere.
We first describe the photochemical model and focus our description on the production’s computation, both primary and secondary, and the loss processes taken into account for each ion. Dication densities are then deduced.
The second part deals with the inputs of the model, i.e. cross sections, extreme ultra-violet (EUV) solar flux and the neutral atmosphere. In the third section we show the results of the modelling and validate the model by a comparison with Atmosphere Explorer data. We can then detail the steps of the computation which yields interesting features while modifying geophysical parameters.
The last paragraph addresses the possibility of detection of such ions applied to the Earth’s upper atmosphere and other planets or satellites in the solar system, notably Titan.
2 The model TRANSCAR applied to dications
The model TRANSCAR and its outputs are described in de-tail in Lilensten and Blelly (2002). The model describes the upper atmosphere between 90 and 3000 km, assuming it is composed of six ions, namely N+2, O+2, O+, N+, NO+and H+. To summarize, TRANSCAR is a coupled kinetic/fluid model which solves sequentially the Boltzmann kinetic equa-tion for suprathermal electrons and the Boltzmann momen-tum equations for the 6 ions listed above. Each part is linked with the other and updated through ionisation and heating rates (produced by the kinetic transport code), on the one hand, and through electronic density and temperature yielded by the 1-D, time-dependent fluid transport model, on the other hand (Fig. 1).
The ionisation thresholds of N2, O2and O, for single and double ionisation processes are listed in Table 1. The kinetic formalism described below is relevant to doubly-charged ions, and follows closely the singly-charged ion description of Lilensten and Blelly (2002). The photochemical descrip-tion proposed in Sect. 2.4 is, however, specific to doubly-charged ions while singly-doubly-charged ion parameters are given by the Boltzmann fluid formalism.
2.1 Primary productions
The expression of the primary production profilePprimj (z) of an ionj is given in cm−3s−1by a simple Beer-Lambert law for the energyEand at the altitudez:
Pprimj (z)=ns(z) Z
σis→j(E) I∞(E) e−τhν(z,E)dE , (1)
where I∞(E)is the solar flux on the top of the ionosphere,
σis→j(E)the photoionisation cross section of speciess pro-ducing the doubly-charged ionj, andns(z)the density of the mother speciesswhich can be either a singly-charged ion or a neutral.
τhν(z,E)=P s
σsa(E)R∞ z ns(z
0) chapχ (z0) dz0 represents the
optical depth, a function of the absorption cross section of the speciessnotedσsa(E)and chapχ (z), the Chapman func-tion, a function of the altitude and the solar zenith angleχ. 2.2 Kinetic transport and secondary productions
The primary electrons can be of a high enough energy to ionize as well the neutral gas, even for doubly-charged ions, which have a high ionisation threshold. The steady-state ki-netic transport equation describes the angular and energy re-distributions of electrons and connects the spatial evolution of the electron flux from the top of the ionosphere to the low E-region. Mathematically speaking, when reviewing losses and sources, we can write (Lilensten and Blelly, 2002): µ∂I (τ, E, µ)
∂τ (z, E) = −I (τ, E, µ)+sf (τ, E, µ)+ ne(z)
P k
nk(z)σkT(E)
∂(L(E) I (τ, E, µ))
∂E + X l
nl(z)σlT(E) P
k
nk(z)σkT(E) 1 Z −1 dµ0 ∞ Z E
dE0Rl(E0;µ→E;µ)I (τ, E0, µ0) ,(2)
where I (τ, E, µ) is the electron stationary flux (cm2s−1eV−1 sr−1), E, E0, µ and µ0 the energies in eV of scattered and incident electrons and their respective pitch-angles cosine. σkT(E)stands for the total elastic and inelastic collisions’ cross section for the neutral species s, while nk(z)and ne(z) represent the density of the neutral species k and the electron density. τ(z,E) is the electron scattering depth, defined as dτ(z,E)=−P
s
σkT(E) nk(z) dz.
Table 1. Ionisation thresholds for some common species.
1 Table 1. Ionisation thresholds for some common species
Species Single Ionisation
threshold (eV)
Double ionisation threshold
(eV)
N2 15.58 43.00 (Ahmad, 2002)
O2 12.08 36.13 (Hall et al., 1992)
O 13.61 48.74 (He et al., 1995)
O+ 35.13
Rl is the redistribution function (or normalized differ-ential cross section) from an initial state (E0,µ0) to a final
state (E, µ) for the neutral species l. It depends on the elastic and inelastic cross sections. The source function sf (τ, E, µ), which corresponds to the photoelectron pro-duction rate, varies with the precipitated flux or the primary photoelectron flux conditions. The continuous energy loss function L(E), describing the energy transfer from the suprathermal “hot” electrons to the ambient electrons, is computed via a scheme given by Swartz and Nisbet (1972).
The secondary production of the ionjis then:
Psecj (z)=2π ns(z) 1 Z −1 dµ ∞ Z 0
σies→j(E) I (τ, E, µ) dE . (3)
σies→j(E) is here the electron-impact ionisation cross section for the production of a doubly-charged ion j through the mother speciess, either an ion or a neutral.
The final overall production for the doubly-charged speciesjis simply the sum of the primary and the secondary productions.
Pt otj (z)=Pprimj (z)+Psecj (z) (4) 2.3 Loss mechanisms for dications: a chemical model The chemical loss profiles are defined as:
Lj(z)= X
i
kini(z) + 1
τjd , (5)
whereki is the reaction rate constant (cm3s−1) correspond-ing to the reaction of N++2 , O++2 or O++with a neutral of densityni, andτjdis the dissociation lifetime of the molecu-lar doubly-charged ionj.
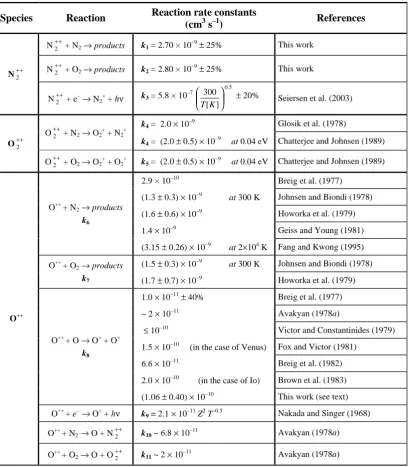
Table 2. . A comprehensive list of reaction rate constants for N++2 , O++2 , and O++corresponding to the reactions with the neutrals N2, O2,
O and the electronic recombination.
2
Table 2. A comprehensive list of reaction rate constants for N+2+, O + +
2 , and O
++
corresponding to the reactions with the neutrals N2, O2, O and the electronic
recombination.
Species Reaction Reaction rate constants
(cm3 s–1) References
N+2++ N2→products k1 = 2.70 × 10⁻⁹± 25% This work
N+2++ O2→products k2 = 2.80 × 10⁻⁹± 25% This work
N+2+
N+2++ e–→ N2+ + hν k3 = 5.8 × 10 –7
] [ 300
K T
0.5
± 20% Seiersen et al. (2003)
k4 = 2.0 × 10⁻⁹ Glosik et al. (1978)
O+2++ N2→ O2+ + N2+
k4 = (2.0 ± 0.5) × 10–9 at 0.04 eV Chatterjee and Johnsen (1989)
O+2+
O+2++ O2→ O2+ + O2+ k5 = (2.0 ± 0.5) × 10–9 at 0.04 eV Chatterjee and Johnsen (1989)
2.9 × 10⁻¹⁰ Breig et al. (1977)
(1.3 ± 0.3) × 10–9 at 300 K Johnsen and Biondi (1978)
(1.6 ± 0.6) × 10–9 Howorka et al. (1979)
1.4 × 10⁻⁹ Geiss and Young (1981)
O+++ N
2→products
k6
(3.15 ± 0.26) × 10–9 at 2×10⁴ K Fang and Kwong (1995)
(1.5 ± 0.3) × 10–9 at 300 K Johnsen and Biondi (1978)
O+++ O2→products
k7 (1.7 ± 0.7) × 10–9 Howorka et al. (1979)
1.0 × 10⁻¹¹± 40% Breig et al. (1977)
~ 2 × 10–11 Avakyan (1978a)
≤ 10–10 Victor and Constantinides (1979)
1.5 × 10⁻¹⁰ (in the case of Venus) Fox and Victor (1981)
6.6 × 10⁻¹¹ Breig et al. (1982)
2.0 × 10⁻¹⁰ (in the case of Io) Brown et al. (1983) O+++ O → O+ + O+
k8
(1.06 ± 0.40) × 10–10 This work (see text)
O+++ e–→ O+ + hν k9 = 2.1 × 10⁻¹¹Z2T–0.5 Nakada and Singer (1968)
O+++ N2→ O + N
+ +
2 k10~ 6.8 × 10⁻¹¹ Avakyan (1978a)
O++
O+++ O2→ O + O+2+ k11~ 2 × 10–11 Avakyan (1978a)
d’Ions S´electionn´es par des Electrons de Seuil). The exper-imental procedure is described in Nicolas et al. (2002) and Franceschi et al. (2003).
In the case of N++2 , the lifetime of the ion ground state is 3 s (Mathur et al., 1995). For O++2 , as no data is currently available, we assume that the lifetime is limited by the tun-nelling through a barrier towards dissociation and we esti-mate it equal to the lifetime of CO++2 , i.e. 4 s (Mathur et al., 1995). When produced in excited states (electronic or vi-brational), the lifetime of the dication is known to decrease rapidly (Cox et al., 2003). Therefore, another unknown is the relative abundance of the dication ground state to the
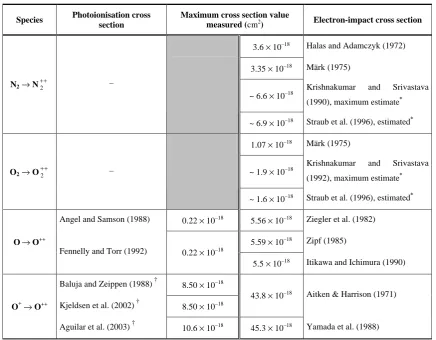
[image:4.595.95.505.101.569.2]Table 3. Cross sections available for the ionisation of N2, O2and O.
3
Table 3. Cross sections available for the ionisation of N2, O2 and O.
Species Photoionisation cross section
Maximum cross section value
measured (cm2) Electron-impact cross section
3.6 × 10⁻¹⁸ Halas and Adamczyk (1972)
3.35 × 10⁻¹⁸ Märk (1975)
~ 6.6 × 10⁻¹⁸
Krishnakumar and Srivastava
(1990), maximum estimate* N2→ N+2+ –
~ 6.9 × 10⁻¹⁸ Straub et al. (1996), estimated*
1.07 × 10⁻¹⁸ Märk (1975)
~ 1.9 × 10⁻¹⁸
Krishnakumar and Srivastava
(1992), maximum estimate* O2→ O+2+ –
~ 1.6 × 10⁻¹⁸ Straub et al. (1996), estimated*
Angel and Samson (1988) 0.22 × 10⁻¹⁸ 5.56 × 10⁻¹⁸ Ziegler et al. (1982)
5.59 × 10⁻¹⁸ Zipf (1985) O→ O++
Fennelly and Torr (1992) 0.22 × 10⁻¹⁸
5.5 × 10⁻¹⁸ Itikawa and Ichimura (1990)
Baluja and Zeippen (1988) † 8.50 × 10⁻¹⁸
Kjeldsen et al. (2002) † 8.50 × 10⁻¹⁸
43.8 × 10⁻¹⁸ Aitken & Harrison (1971)
O+→ O++
Aguilar et al. (2003) † 10.6 × 10⁻¹⁸ 45.3 × 10⁻¹⁸ Yamada et al. (1988)
* The original measurements concerned the products N+ + N++
2 and O
+ + O++
2 together. Maximum estimates on
cross sections for the production of N+2+ and O+2+ are made here on the following assumptions proposed by
Krishnakumar & Srivastava (1990) for N+2+ and by Märk (1975) for O+2+. According to these authors, a
maximum of 10% of the overall N+ + N+2+ production reported may be of N + +
2 origin while Märk (1975) reports
than O+2+ cross sections are less than 1% of those for the production of O2+, yielding the estimates shown in
Table 3.
†
Cross sections measured at threshold.
∗The original measurements concerned the products N++ N++2 and O++ O++2 together. Maximum estimates on cross sections for the production of N++2 and O++2 are made here on the following assumptions proposed by Krishnakumar and Srivastava (1990) for N++2 and by M¨ark (1975) for O++2 . According to these authors, a maximum of 10% of the overall N++ N++2 production reported may be of N++2 origin while M¨ark (1975) reports than O++2 cross sections are less than 1% of those for the production of O+2, yielding the estimates shown in Table 3.
† Cross sections measured at threshold.
Owing to the existence of measurements of the rate con-stants for the reaction of O++ with N
2, O2 (discussed in Sect. 4), and O, we can roughly estimate the effective lifetime of O++in multiplying by the corresponding neutral densities
1
kini: we obtain an O
++lifetime of less than 100 s at all
alti-tudes between 100 and 500 km.
Other loss reactions, namely that of O++with He and H, can be of importance above 600 km, where He and H con-centrations become high and rate constants reach values of 1.1×10⁻¹⁰cm3s−1for 1000 K. Because all densities are cal-culated below 500 km, as showen in Sect. 2.4, these loss re-actions are assumed to be negligible.
2.4 Output of the model: densities of N++2 , O++2 and O++
Using the continuity equation ∂n∂tj(z)+div(nj(z) vj(z)) = Pj(z)−nj(z)Lj(z), we are now able to determine the density
profile of a doubly-charged ion.
The density nj(z) of a doubly-charged ion j is simply given by the photochemical equilibrium:
nj(z)= Pt otj (z)
Lj(z)
. (6)
This expression is valid at low altitudes, i.e. at altitudes less than 500 km. At higher altitudes, the velocity may be-come too large to insure the validity of the steady-state as-sumption.
3 Inputs of the model
To solve Eqs. (1) and (3), we need to know the parameters ns(z),σs
→j i (E),σ
s→j
ie (E), andI∞(E).
0.1 1.0 10.0 100.0 100
200 300 400 500
O
++density (cm
−3)
Altitude (km)
0.1 1.0 10.0 100.0
100 200 300 400 500
[image:6.595.113.477.68.254.2]O
++density (cm
−3)
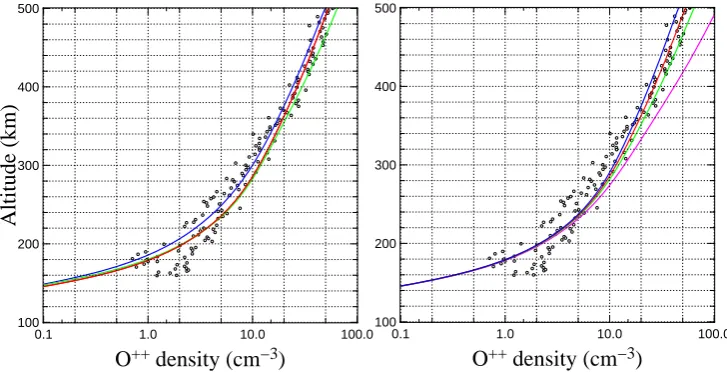
Fig. 2. Left: O++density as recorded by AE-C2758 on 12 August 1974 (circles) and for different geophysical conditions computed by the model in the photoequilibrium assumption (curves). The blue curve stands for the satellite latitude/longitude position (–5.81◦,64.87◦) forχ=79.99◦at altitude 161 km. The red curve corresponds to (–31.55◦,54.64◦),χ=78.53◦at 377 km. The green curve is for the position (–45.67◦,45.70◦),χ=78.91◦at 494 km. Right: evolution of O++density under the variation of the reaction rate constantk8(see text) in
parallel with AE-C data plots (empty circles). Blue curve: k8=1.50×10⁻¹⁰cm3s−1. Green curve: k8=1.00×10⁻¹⁰cm3s−1. Magenta
curve:k8=5.00×10⁻¹¹cm3s−1. The best fit with AE-C 2758 atχ=78.53◦is obtained fork8=1.25×10⁻¹⁰cm3s−1(red curve).
while we use the solar flux model EUV91 with its 39-energy box scheme (Tobiska, 1991) on which the photoionisation cross sections are sampled.
The different ionisation cross sections of interest in this study are summarized in Table 3. Generally speaking, no data have been available up to now for the double photoion-isation of the N2 and O2 molecules, while for the electron impact, a large documentation exists. The only complete set of data is for O++, for both photoionisation and electron im-pact ionisation. We use Fennelly and Torr (1992) for double photoionisation of oxygen, and Zipf (1985) for the electron-impact cross section because of their remarkably precise ta-bles.
We take N2 and O2 electron-impact double-ionisation cross sections from M¨ark (1975): it is the only measurement available so far where the direct production of N++2 is given without any spectrometric overlapping with N+. The double photoionisation of N2and O2is a more complex source of concern as no results have been published yet. We use the approximation:
σhνN2(N++2 ) σhν(N2)
=σ N2 e (N++2 )
σe(N2)
and σhνO2(O++2 )
σhν(O2) =σ
O2 e (O++2 )
σe(O2)
(7) to yield the double photoionisation cross sectionsσhνN2(N++2 ) andσhνO2(O++2 ), where σhν(i) stands for the photoabsorp-tion cross secphotoabsorp-tion of the neutral speciesi,σe(j ) or the to-tal electron impact diffusion cross section of the speciesj andσei(i++)for the double electron impact ionisation cross section of the neutrali.
Another source of molecular dications might be the single electron-impact ionisation of N+2 and O+2: though the ionisa-tion cross secionisa-tions (of the order of 10−17cm2for N+2 accord-ing to Bahati et al., 2001) is not negligible, the N+2 and O+2 densities are much smaller than the neutral ones by a factor of at least 106. The result is that this contribution to N++2 and O++2 productions is negligible in our context, especially in the low-altitude regions considered here.
4 Validation of the model
In this section, we compare the results of the model de-scribed above for O++with the lone experimental data from the magnetic ion mass spectrometer MIMS (Hoffman et al., 1973) on board Atmosphere Explorer (AE), which were recorded 30 years ago (Breig et al., 1982).
4.1 Calculated O++densities compared with AE-C data
The AE satellite sampled data during descent in late af-ternoon in the southern winter non-polar ionosphere, cor-responding to orbits 2735, 2743, 2754, 2757, C-2758. The solar zenith angle ranged between 75◦ and 85◦, while the magnetic indicesApremained around 16.
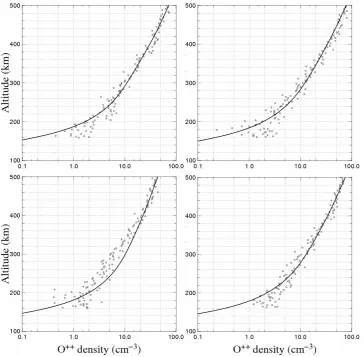
Fig. 3. O++density in the range 100–500 km for AE-C successive orbits 2735 (top left), 2743 (top right), 2754 (bottom left) and 2757 (bottom right). The results of the model are compared to AE–C data and we fit for each plot the reaction rate constantk8. Top left: k8=1.1×10⁻¹⁰cm3s−1. Top right:k8=6.5×10⁻¹¹cm3s−1. Bottom left: k8=1.6×10⁻¹⁰cm3s−1. Bottom right:k8=7.0×10⁻¹¹cm3s−1
(AE–C data taken from Breig et al., 1982).
it results in a high spreading of experimental AE data points, which eventually enables one to validate our results at lower altitudes.
In the following subsections, we adopt for the model the average-altitude parameters of each satellite orbit, i.e. for or-bit C-2758χ=78.53◦, and the latitude/longitude set (–31.55◦, 54.64◦), taken as mean conditions.
Let us now discuss our model inputs. As stated above, we use the semi-empirical model MSIS-90 for the neutral atmo-sphere. This model is in fairly good agreement up to 400 km with the recorded AE-C data for the neutrals. Above 400 km, it clearly overestimates the measurements and reaches a den-sity value higher by a factor of two at 500 km. Nevertheless, depending on the neutral composition inputs (either MSIS or AE-C neutral composition recording), the results of our di-cation density model are not significantly modified at these high altitudes (differences up to 10% at most). We obtain once more good agreement with AE-C O++density profiles.
We can now test the reaction rate constants listed in Table 2. The best agreement with AE-C O++ profiles is
Table 4. Summary of the reaction rate constants obtained for the
reaction O+++O on each AE orbit.
4
Table 4.Summary of the reaction rate constants obtained
for the reaction O++ + O on each AE orbit.
AE-C orbit Loss rate k8(cm3 s–1)
2735 1.10 × 10⁻¹⁰
2743 6.50 × 10⁻¹¹
2754 1.60 × 10⁻¹⁰
2757 7.00 × 10⁻¹¹
2758 1.25 × 10⁻¹⁰
[image:7.595.341.513.549.729.2]10−4 10−2 10+0 10+2
100 200 300 400 500
O
++productions (cm
−3s
−1)
Altitude (km)
10−5 10+0 10+5
100 200 300 400 500
[image:8.595.108.488.69.262.2]O
++loss (s
−1)
Fig. 4. O++production and loss profiles for orbit 2758. Left panel: total O++production profile. Right panel: loss mechanisms taken into account in the model. Collisions with N2(solid curve), with O2(dashed curve), with O (dash-dotted curve) and with the electrons (triangles)
are represented. The sum of all contributions is in full circles.
Table 5. Set of geophysical parameters used in the model.
5 Table 5.Set of geophysical parameters used in the model.
Parameters
Latitude
° °
° °
E N
E N
5.43 , 45.11 Grenoble
18.95 , 69.66 Tromsø
Solar zenith angle χ χ = 0 – 90°
Solar activity f10.7
= =
243 68
7 . 10 7 . 10 f f
Magnetic index Ap Ap = 3
found when using thek6 andk7 rate constants obtained in laboratory measurements by Howorka et al. (1979). As for the charge-exchange reaction O+++O, which has not been measured but has been derived from models, we are compelled to search for the best fit of our model while varying the coefficient k8. This is shown in Fig. 2 (right panel) for orbit C-2758: we find the best fit for the value k8=1.25×10⁻¹⁰cm3s−1.
4.2 Determination of the O+++O reaction rate constant Breig et al. (1982) published AE-C data for different orbits corresponding to the two days before orbit C-2758. They occur in slightly different conditions. The satellite recordings occur during descents that spread from 10 August (C-2735) to 12 August 1974 (C-2757). We plot in Fig. 3 the O++ density with the reaction rates defined in the previous section
for each satellite orbit. We fit the reaction ratek8for each particular recording in order to obtain the best correlation.
These different sets of orbital data lead us to the consensus valuek¯8=1.06±0.40×10⁻¹⁰cm3s−1 at 1σ for the O+++O reaction.
The values fitted are summarised in Table 4 and averaged over the five orbits considered, and eventually yield the coef-ficientk¯
8.
This result ranges nicely in between the extreme values found by Fox and Victor (1981) determined on Venus, i.e. k8=1.5×10⁻¹⁰cm3s−1, and Breig et al. (1982) on Earth, i.e. k8=6.6×10⁻¹¹cm3s−1. A limitation to these comparisons is that, together with the approach presented here, both au-thors fitted their model with experimental data while using very simple assumptions for the computation of productions and losses. According to Smith and Adams (1980), Breig et al. (1977) may have well underestimated their values in light of what is expected experimentally for other doubly-charged ions such as Xe++or Ar++, and should be of the order of
10−10cm3s−1.
The value retained here needs of course further confirma-tion from laboratory studies. What’s more, the temperature dependence of the reaction rate constantk8has to be cleared up as we observe large variations depending on the orbit of the satellite. These variations, though certainly not entirely, could partly be of thermal origin.
4.3 Production and loss profiles for AE-C 2758
[image:8.595.64.269.360.511.2]Fig. 5. Ion production profiles between 100 and 800 km (top left and right) at Grenoble,χ=63.51◦. The electron contribution (black solid curve) is given by the weighted sum of all ion species: N+2 (solid blue), O+2 (solid green), O+(solid red), N+(solid magenta), H+ (dashed black), N++2 (dashed blue), O++2 (dashed green) and O++(dashed red). Primary productions are shown on the left and secondary productions on the right. Bottom: doubly-charged ion primary productions (solid curves) versus secondary productions (dashed curves) in minimum solar conditions (f10.7=68, left) and in active solar conditions (f10.7=243, right). N++2 profiles are in blue, O
++
2 in green and
O++in red.
We can see that collisions with electrons are negligible whatever the altitude. The other plots underline the growing efficiency with altitude of the O+++O mechanism: above 350 km, collisions with O play the major role in the final concentration shape and magnitude. We can then conclude that at lower altitudes, where collisions with N2 and O2 molecules are prominent, the model is almost not influenced by the O+++O process. As this latter process is also subject
to the largest uncertainties, the model verifies AE measure-ments better for altitudes being below 300 km. This low-altitude validity acts as a cornerstone to the overall validity of the model.
So far as we have access to very few satellite data and as there is a clear lack of statistics, our present photochem-ical model is validated over the range of altitudes 100– 500 km for O++. We have determined by means of a fit
10−6 10−4 10−2 10+0
200 400 600 800
P
sec(O
++) (cm
−3s
−1)
[image:10.595.64.271.66.276.2]Altitude (km)
Fig. 6. Detail of the secondary productions of O++in Grenoble and for quiet solar conditions,χ=63.51◦. Productions of O++via double ionisation by electron impact of O are shown in open circles. The single ionisation of O+is represented by black triangles. The solid curve is the total secondary production of O++(in cm−3s−1)
through both mechanisms.
5 Sensitivity study of productions and densities
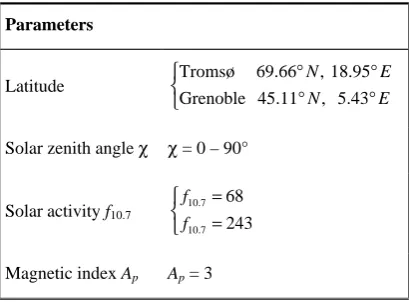
Three main geophysical parameters are taken into account that are summarized in Table 5. Grenoble (France) is as-sumed to be representative of middle latitudes and Tromsø (Norway) is a typical high-latitude site. Two solar flux con-ditions are studied through the f10.7 proxy variation, i.e. f10.7=68 (solar minimum) andf10.7=243 (solar active con-ditions). Finally, the sensitivity of each ion profile is exam-ined throughout an entire day at Tromsø: the solar zenith angle dependence is examined in detail. All over this work the magnetic indexAp is set to 3, in order to avoid any in-fluence from the magnetic activity. We choose day 120 of the year (early May) to compute our productions, losses and densities.
5.1 Primary and secondary productions 5.1.1 General considerations
Although the densities are computed only below 500 km, the production is of course calculated and shown up to 800 km. Primary and secondary production profiles of the main ion species are presented in Fig. 5 between 100 and 800 km.
The electron contribution is simply the weighted sum of all ion species: for dications, two electrons are produced for each double-ionization of a neutral species. Its produc-tion profile shows a two-peak shape particularly clear for the primary productions, one at low altitudes near 110 km (due to O+2), the other near 180 km (due to N+2 and O+). The lower part of the figure shows the evolution of the dication
productions under quiet (bottom left) and active solar flux conditions (bottom right).
The productions rates of a doubly-charged ion are smaller than those for singly-charged ions by a factor at least equal to 100. At very high altitudes, however (>600 km), the O++ primary production rate can represent up to 10% of that of O+.
A change of dependence in O++profiles is clearly seen on the left-hand side of Fig. 5, particularly sensitive for the primary productions. This evolution is interpreted as the two physical mechanisms causing the production of O++, i.e. the double ionisation of O and the single ionisation of O+, both through photoionisation and electron impact ionisation. The single photoionisation of O+is the prominent mechanism at high altitudes (400–800 km) while the double photoionisa-tion of O plays the most important role at lower altitudes. Among the secondary production mechanisms (electron im-pact ionisation), the ionisation of O+is the major reaction for producing O++ions from 700 km upwards, as shown in Fig. 6.
As stated in Lilensten et al. (1989) and seen in Fig. 5 (bot-tom), secondary dication productions contribute up to 30% of the total ion productions above 180 km and are the main contribution at lower altitudes (100–200 km for the molecu-lar dications, 100–350 km for O++), because of the photon
penetration altitude into the ionosphere.
The difference between molecular dications and O++ is due both to the rather high double ionisation threshold of O (48.74 eV) and to the electron-impact cross sections that are 25 times larger than the double photoionisation cross sections of O.
5.1.2 Influence of the solar activity
In Fig. 5 (bottom), productions increase together with the so-lar flux index. The production rate peak increases in altitude from 150 km to 180 km from low to high solar activity. Be-tweenf10.7=68 andf10.7=243, their intensity increases by a mean factor of 2.5 at low altitudes, owing to the growth of neutral densities. Above 300 km, the solar flux intensifica-tion is more noticeable and producintensifica-tion rates increase by a factor of 50 to 102 forf10.7=243, from minimum to maxi-mum solar activity.
5.1.3 Influence of the latitude
200 400 600 800 00:00 03:00 06:00 09:00 12:00 15:00 18:00 21:00 00:00 0 5 10 15 Altitude (km) Hour (UT) O ++ productions (cm −3 s −1 ) 2 4 6 8 10 12 200 400 600 800 00:00 03:00 06:00 09:00 12:00 15:00 18:00 21:00 00:00 0 5 10 15 20 Altitude (km) Hour (UT) N 2 ++ productions (cm −3 s −1 ) 2 4 6 8 10 12 14 16 18 200 400 600 800 00:00 03:00 06:00 09:00 12:00 15:00 18:00 21:00 00:00 0 0.2 0.4 0.6 0.8 1 1.2 Altitude (km) Hour (UT) O 2 ++ productions (cm −3 s −1 ) 0.1 0.2 0.3 0.4 0.5 0.6 0.7 0.8 0.9 1
Fig. 7. Total productions (primary and secondary) of N++2 (blue), O++2 (green), O++(red) over a whole day at Tromsø, for minimum solar flux conditions (f10.7=68). Molecular dications show two sharp peaks at low altitudes, one around 115 km ascribed to the secondary
production profiles, the other near 180 km attributed to the primary production profiles. O++presents a wide peak around 220 km, mixing together the two production contributions.
5.1.4 Influence of the solar zenith angle
Together with the solar activity, the solar zenith angle vari-ation is the parameter which has the strongest influence on productions. The larger the solar zenith angle, the more in-tense the solar flux absorption, because of the larger column density of atmosphere along the path of the photons: it im-plies that at a given altitude, fewer productions will be seen and the peaks will be shifted towards higher altitudes (Fig. 7). Atχ=90◦, for instance, and according to the model, no ions are produced at 100 km, regardless of the solar conditions.
This simple reasoning is verified for N++2 and O++2 . As seen in Fig. 7, peaks for molecular dications come in twos and are centred at very low altitudes (115 km and 120 km for N++2 and O++2 , respectively) due to secondary productions and the other at 180 km due to the primary production. O++ single production peak is wider and centred around 220 km, a difference due to the density of atomic oxygen which be-comes prominent over N2and O2, from 200 km upwards.
5.1.5 Brief summary
The cumulative contribution of these 3 ions can be up to 5% of the total primary electron production and more than 10% for the secondary electron production, depending on the solar flux conditions and the solar zenith angle. As seen before, the total ion production rate is the sum of primary and secondary production rates. In the altitude range considered, secondary production rates contribute 50% of the total O++ion production rate. For N++2 , it reaches an average value of 15%, and for O++2 a value of less than 5%. According to the results of the model, O++2 is the rarest produced species of all three dications by a factor of at least 10.
Fig. 8. Total ion productions at Tromsø,f10.7=68, for the ions N+2
(solid blue), O+2 (solid green), O+(solid red), N+(solid magenta), H+(dashed black), N++2 (dashed blue), O++2 (dashed green) and O++(dashed red). The total electron productions are represented in solid black.
production reaction O++hν→O+++e−becomes prominent above 500 km and leads to a more slowly decreasing slope for the total production.
5.2 Densities
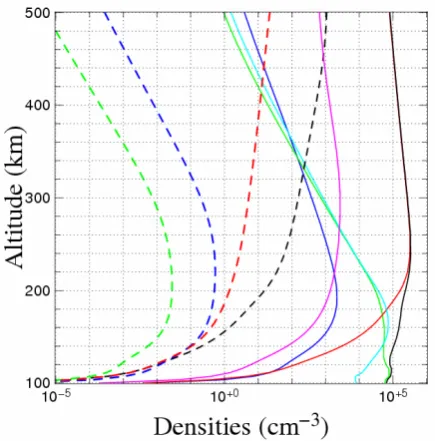
Figure 9 shows the major ion densities above Tromsø, for the minimum solar activity model. Near 160 km, the F1 ionospheric layer is clearly seen, characterised by a peak in NO+density. We plot the electron density in black. Doubly-charged ions are represented by dashed lines.
We note that, among dications, the highest densities are expected for O++which reaches 60 to 100 ions per cm3at 500 km, and becomes the ion with the fourth highest density, after O+, H+ and N+. At 500 km, the O++ density is 105 times larger than N++2 and O++2 . Peaks in the density of N++2 and O++2 (1 cm−3and 0.01 cm−3, respectively) are then predicted between 200 km and 250˙km.
5.2.1 Solar flux effect
O++densities increase by a factor of 2.5 between 150 and 500 km, from low (f10.7=68) to high (f10.7=243) solar activ-ity (Fig. 10, top). At the same time, N++2 densities increase by a factor of 3 between 100 and 300 km, and by an increas-ing factor of 10 to 105above 300 km. O++2 follows the same evolution as N++2 : a mean factor 2 separates the two solar flux results between 100 and 200 km, while above 300 km, the factors by which the densities increase reach 105, show-ing that the differences become dramatically larger when al-titudes increase.
Fig. 9. Density profiles of the major ionic species in the ionosphere
above Tromsø, f10.7=68 and atχ=63.51. N+2 is plotted in solid
dark blue, O+2 in solid green, O+in solid red, N+in magenta, H+in dashed black, NO+in solid light blue, N++2 in dashed blue, O++2 in dashed green and O++in dashed red. The electron density is represented in black solid. The three doubly-charged ion densities are computed under the photochemical equilibrium assumption.
5.2.2 Latitude influence
The influence of latitude is shown in Fig. 10 (bottom left). Generally speaking, the densities are more important at high latitudes for N++2 and O++2 whereas it is the opposite for O++. The differences are ranging from a constant 40% for O++to a highly variable factor for N++2 and O++2 depend-ing on the solar conditions and the altitude (less than 10% at low altitudes or for active solar conditions, continuously-increasing in quiet conditions above 250 km, eventually reaching 40% at 500 km).
5.2.3 Solar zenith angle evolution
In Fig. 10 (bottom right), we consider two extreme cases to study the solar zenith angle effect on dication densi-ties at mean latitude: local zenith (χ=30.47◦), and twilight (χ=90◦). Significant changes at low altitudes are to be seen forχ=90◦: peaks appear higher in altitude and their ampli-tude drops on average by a factor of 1.5.
[image:12.595.318.536.64.285.2]0 20 40 100
200 300 400 500
Relative difference ratio (%)
Altitude (km)
10−4 10−2 10+0 10+2
100 200 300 400 500
Densities (cm
−3)
0 5 10
100 200 300 400 500
Ratio n
f243/n
f68 [image:13.595.116.476.64.441.2]Altitude (km)
Fig. 10. Solar flux (top panel), latitudinal (bottom left panel) and solar zenith angle (bottom right panel) variation influences on dication
densities. Top: we plot the ratio ni(f10.7=243)
ni(f10.7=68) above Grenoble,χ=63.51
◦. N++
2 is in blue, O ++
2 in green and O
++in red. Bottom left:
latitudinal relative differences between Tromsø and Grenoble are shown for each three species N++2 (blue), O++2 (green) or O++(red) in active (dashed curves) and quiet (solid curves) solar conditions. Bottom right: densities of the three dications forχ=30.94◦(solid curves) and forχ=90◦(dashed curves).
6 Detection of doubly-charged ions in planetary iono-spheres
Two methods are available, namely mass spectrometers ex-periments and optical measurements.
6.1 Mass spectrometers
Originally, mass spectrometer experiments were the first device used on board satellites to yield some information about the ion composition of the atmosphere. Thus, Atmo-sphere Explorer and Pioneer were used to look for doubly-charged ions in the atmosphere of the Earth and Venus. With the Cassini-Huygens mission to the Saturnian system, much effort has been produced most recently to obtain a proper at-mosphere/ionosphere model of Titan to be made available to the community. Predictions have then been cast on the
possi-ble existence of doubly-charged species in Titan’s ionosphere (Lilensten et al., 2005a and 2005b).
This technique allows for the quantitative detection of a given ion through its mass to charge ratiom/q.
On Earth, the determination of O++ (m/q=8) is partic-ularly easy because it does not overlap with other species. However, this method is not suitable for molecular dications such as N++2 and O++2 as N+and O+have, respectively, the same mass to charge ratio.
Table 6. Fluorescence wavelengths and transitions for N++2 , O++2 and O++.
6 Table 6. Fluorescence wavelengths and transitions for N+2+, O
+ +
2 and O
++
.
Species λ (nm) Transition
158.9 – 159.4 (1,1) band
N+2+
158.7 – 159.3 D1Σu+(0) →X1Σg+(0)
500.824 1D2→3P2 N1
496.029 1D2→
3 P1 N2
436.443 1S0 →1D2
232.166 1S0→3P1
166.615 5S20→3P2
O++
(OIII)
166.081 5S20→3P1
470
443 O+2+
417
A 3Σu+– X 1Σu+
6.2 Spectroscopy of dications
Among doubly-charged ions, N++2 has perhaps been the most widely studied species for over two decades. The ground state of N++2 , denoted by X16g+, is 43.00 eV above the ground neutral state (Ahmad, 2002, see Table 1). So far, 8 excited electronic states have been identified, such as the first onesa35u andb36g−, situated at 0.57 and 1.48 eV, respec-tively, above the N++2 ground state (Taylor and Partridge, 1987). The ground stateX16g+of O++2 is located at 36.13 eV above the ground neutral state, and the first excited state A36u+ at 4.16 eV above the O++2 ground state (Fournier et al., 1992). Moreover, the O++2 vibrational structure has been investigated by a threshold photoelectron coincidence tech-nique (TPESCO) (Hall et al., 1992 and references therein).
The O++ ground state 3P
0 is situated 48.74 eV above its ground neutral state (He et al., 1995). Many excited states exist, among which 1D2, 1S0 and 5S02 lie 2.513 eV, 5.354 eV and 7.479 eV, respectively, above the O++ground level. These states are notably involved in the formation of emission lines, discussed in the next paragraph.
6.3 Fluorescence
The fluorescence of O++ is well-known since its doublet centred around 500 nm has been used as a tracer of elec-tron densities and temperatures in gaseous nebulae since the 1940s (e.g. Menzel and Haller, 1941).
Due to the fast dissociation or predissociation of molecular dication excited states, fluorescence towards the ground state is generally a rare phenomenon, but was at least observed for
N++2 (Cossart et al., 1985; Cossart and Launay, 1985; Ols-son et al., 1988; Ehresmann et al., 2000). For O++2 , Avakyan (1978b) also reports the possible identification of auroral emissions around 243 nm which he ascribes to theA36+u– X16+g transition: despite the fact that no further confirma-tion of a fluorescence feature in O++2 has yet been found, three emission wavelengths have recently been tabulated by Avakyan (1998), as shown in Table 6, where we list the flu-orescence transitions and their respective wavelengths for N++2 , O++2 and O++. The O++transitions are situated in
the visible blue spectrum and in the UV range.
The N() excited state of specific interest to us is D16u+, which lies 7.8 eV above the N++2 ground state (Ahmad, 2002; Olsson et al., 1988). This state fluoresces in transitions to the N++2 ground state, with bands centred around 159 nm (Table 6). The fluorescence lifetime of the N++2 D16u+ elec-tronic state is 6.0±0.5 ns, according to Olsson et al. (1988). No collisional deactivation is therefore liable to occur in the ionosphere during this very short lifetime. Using the results of Ehresmann et al. (2003), a rough approximation leads us to conclude that nearly 10% of the total N++2 ions created by double photoionisation at the cross-section peak near 65 eV, are produced in this state. As densities for N++2 reach, at the most, 1 ion per cm3, we would expect, in a very optimistic hypothesis, that a mere 0.1 ion per cm3is produced in the flu-orescent state. Depending on the solar flux intensity, we can then estimate the maximum intensity likely to be produced along the line of sight by integrating ion productions over our altitude range. The intensity ranges from 0.6 R in quiet so-lar conditions to 2.3 R in active soso-lar conditions. This value is high enough to be detected by spectrophotometers whose accuracy lies typically within the sub deci-Rayleigh range.
Regarding O++, it is by far the most abundant doubly-charged species in the Earth’s ionosphere and is therefore the most likely to be detected optically in aurora or diurnal high-resolution spectra. Besides the forbidden transitions N1and N2, three other lines exist for O++ in the UV range (see Table 6; NIST database at http://physics.nist.gov/cgi-bin/ AtData/main asd) but have never been identified in the di-urnal ionosphere spectrum. The radiative lifetime of the5S20 metastable level of O++was measured to be 1.22±0.08 ms (Johnson et al., 1984). A fruitful comparison with mass spec-trometer results on board satellites should be of great interest in the years to come.
7 Conclusion and perspectives
by laboratory experiments. Emphasis is laid on the need for laboratory measurements concerning double photoionisation cross sections of N2and O2, as well as the reactions of dica-tions with O.
We then validate our approach for O++by the comparison with the only measurements available, those recorded by the satellite Atmosphere Explorer in the mid-seventies. The re-action rate constant concerning the O+++O→O++O+ reac-tion is predicted to be 1.06±0.40×10⁻¹⁰cm3s−1and needs to be confirmed by laboratory experiments.
A sensitivity study is also proposed, showing the most favourable conditions for the productions and existence of doubly-charged ions, via the variation of the solar flux inten-sity (highf10.7), the geographical coordinates (middle lati-tudes) and the solar zenith angle (local zenith).
More comparisons with satellite data should, of course, be carried out in the future, both by measurements of the diurnally varying spectra (need of high resolution spectra) and by mass spectrometers on board satellites.
To bring this study to a conclusion, the effects of solar-wind precipitations could be investigated.
This study is the third of a series of predictions undertaken on Mars (Witasse et al., 2002), Titan (Lilensten et al., 2005a and 2005b) and the Earth. Together with the work performed by Fox and Victor (1981) on Venus and Brown et al. (1983) on Io, we can suggest that doubly-charged ions are a common feature of planets and satellites with thick atmospheres.
Acknowledgements. C. S. thanks M. Barth´elemy and F. Culot (LPG) for fruitful discussions throughout the building of this work. Topical Editor M. Lester thanks J. Fox and S. V. Avakyan for their help in evaluating this paper.
References
Aguilar, A., Covington, A. M., Hinojosa, G., Phaneuf, R. A., ´
Alvarez, I., Cisneros, C., Bozek, C. D., Dominguez, I., Sant’Anna, M. M., Schlachter, A. S., Nahar, S. N., and McLaughlin, B. M.: Absolute photoionization cross section mea-surements of OII ions from 29.7 to 46.2 eV, Ap. J. S., 146, 467– 477, 2003.
Ahmad, M.: Dynamique et dissociation des dications N++2 et NO++2 pr´epar´es par double photoionisation `a l’aide du rayon-nement synchrotron,PhD thesis, Universit´e Paris VI, 2002.
Aitken, K. L. and Harrison, M. F. A.: Measurement of the cross sections for electron impact ionization of multi-electron ions: I. O+to O2+and O2+to O3+, J. Phys. B: Atom. Molec. Phys., 4, 1176–1188, 1971.
Angel, G. C. and Samson, J. A. R.: Total photoionization cross sec-tions of atomic oxygen from threshold to 44.3 ˚A, Phys. ReV.A, 58, No. 11, 5578–5585, 1988.
Aston, F. W., Philos. Mag., 40, 628–634, 1920, quoted in: Seiersen et al., Dissociative recombination of dications, J. Chem. Phys., 119, No. 2, 2003.
Avakyan, S. V.: Doubly charged ions of atomic oxygen in the dis-turbed ionosphere, Cosmic Res., 16, No. 1, 115–119, 1978a. Avakyan, S. V.: Doubly charged molecular ions in the auroral
iono-sphere, Geomag. Aeron., 18, No. 4, 444–446, 1978b.
Avakyan, S. V.: Formation of doubly-charged ions of atomic oxy-gen in the upper atmosphere, Cosmic Res., 17, No. 6, 942–943, 1980.
Avakyan, S. V.: Auger processes in the optics of the upper atmo-sphere, J. Opt. Technol., 65, No. 11, 870–875, 1998.
Bahati, E. M., Jureta, J. J., Belic, D. S., Cherkani-Hassani, H., Ab-dellahi, M. O., and Defrance, P.: Electron-impact dissociation and ionization of N+2, J. Phys. B: At. Mol. Opt. Phys., 34, 2963– 2973, 2001.
Baluja, K. L. and Zeippen, C. J.,: The photoionisation of the O+(4S0)ground state, J. Phys. B: At. Mol. Opt. Phys., 21, 2441– 2454, 1988.
Breig, E. L., Torr, M. R., and Kayser, D. C.: Observations and pho-tochemistry of O++ in the daytime thermosphere, J. Geophys. Res., 87, No. A9, 7653–7665, 1982.
Breig, E. L., Torr, M. R., Torr, D. G., Hanson, W. B., Hoffman, J. H., Walker, J. C. G., and Nier, A. O.: Doubly charged atomic oxygen ions in the thermosphere 1. Photochemistry, J. Geophys. Res., 82, No. 7, 1008–1012, 1977.
Brown, R. A., Shemansky, D., and Johnson, R. E.: A deficiency of OIIIin the Io plasma torus, Ap. J., 264, 309–323, 1983. Chatterjee, B. K. and Johnsen, R.: Thermal-energy reactions of
O++2 ions with O2, N2, CO2, NO and Ne, J. Chem. Phys., 91,
No. 2, 1378–1379, 1989.
Cossart, D., Launay, F., Robbe, J. M., and Gandara, G. J.: The optical spectrum of the doubly charged molecular nitrogen ion-rotational analysis of the (0–0) and (1–1) bands of theD16u+– X16g+transition of N++2 : comparison of observations with
ab-initio calculatio results, J. Mol. Spectrosc., 113, 142–158, 1985. Cossart, D. and Launay, F.: The vacuum UV emission spectrum of the15N22+molecular ion, J. Mol. Spectrosc., 113, 159–166, 1985.
Cox, S. G., Critchley, A. D. J., Kreynin, P. S., McNab, I. R., Shiell R. C., and Smith, F. E.: High resolution spectroscopy and struc-ture of molecular dications, Phys. Chem. Chem. Phys., 5, No. 4, 663–676, 2003.
Ehresmann, A., Liebel, H., Schmoranzer, H., Zimmermann, B., Kammer, S., Schartner, K.-H., Demekhin, Ph. V. and Sukho-rukov, V. L.: Double photoionization of N2into the N++2 D16
+
u
-state, J. Phys. B: At. Mol. Opt. Phys., 36, 3669–3681, 2003. Ehresmann A., Machida, S., Kitajima, M., Ukai, M., Kameta, K.,
Kouchi, N., Hatano, Y., Shigemasa, E., and Hayaishi, T.: Dis-sociative single and double photoionization with excitation be-tween 37 and 69 eV inN2, J. Phys. B: At. Mol. Opt. Phys., 33,
473–490, 2000.
Fang, Z. and Kwong, V. H. S.: Charge transfer between the 2p2 3P ground-state O2+ion and He, H2, N2, and CO at electron-volt
energies, Phys. Rev. A 51, No. 2, 1321–1326, 1995.
Fennelly, J. A. and Torr, D. G.: Photoionization and photoabsorp-tion cross secphotoabsorp-tions of O, N2, O2and N for aeronomic
calcula-tions, At. Dat. Nucl. Dat. Tab., 51, 321–363, 1992.
Fournier, J., Fournier, P. G.: Langford, M. L., Mousselmal, M., Robbe, J. M., and Gandara, G.: An experimental and theoretical study of the doubly-charged ion O++2 , J. Chem. Phys., 96, No. 5, 3594–3602, 1992.
Fox, J. L. and Victor, G. A.: O++in the Venusian ionosphere, J. Geophys. Res., 86, No. A4, 2438–2442, 1981.
Franceschi, P., Thissen, R., Zabka, J., Roithova, J., Herman, Z., and Dutuit, O.: Internal energy effects in the reactivity of CO22+ doubly charged molecular ions with CO2and CO, Int. J. Mass
Geiss J. and Young, D. T.: Production and Transport of O++ in the ionosphere and plasmasphere, J. Geophys. Res., 86, No. A6, 4739–4750, 1981.
Glosik, J., Rakshit, A. B., Twiddy, N. D., Adams, N. G., and Smith, D.: Measurement of the rates of reaction of the ground and metastable excited states of O+2, NO+and O+with atmospheric gases at thermal energies, J. Phys. B: Atom. Molec. Phys., 11, No. 19, 3365–3379, 1978.
Halas, S. and Adamczyk, B.: Cross sections for the production of N+2, N+and N++2 from nitrogen by electrons in the energy range 16–600 eV, Int. J. Mass Spectrom. Ion Phys., 10, 157–160, 1972. Hall, R. I., Dawber, G., McConkey, A., MacDonald, M. A., and King, G. C.: Vibrational structure of the O++2 ground state observed by threshold photoelectron coincidence spectroscopy, Phys. ReV. Lett., 68, No. 18, 2751–2754, 1992.
Hardy, D. A., Gussenhoven, M. S., Raistrick, R. and McNeil, W. J.: Statistical and functional representations of the pattern of auroral energy flux, number flux and conductivity, J. Geophys. Res., 92, No. A11, 12 275–12 294, 1987.
He, Z. X., Moberg, R., and Samson, J. A. R.: Threshold behaviour in single-photon double ionisation of atomic oxygen, Phys. ReV. A: At. Mol. Opt. Phys., 52, No. 6, 4595–4598, 1995.
Hedin, A. E.: MSIS-86 Thermospheric model, J. Geophys. Res., 92, No. A5, 4649–4662, 1987.
Hedin, A. E.: Extension of the MSIS thermosphere into the middle and lower thermosphere, J. Geophys. Res., 96, 1159–1172, 1991. Hellner, L., Besnard, M. J., and Dujardin, G.: Photoionization study of quasibound states of doubly charged molecular nitrogen ions, Chem. Phys., 119, 391–397, 1988.
Heroux, L. and Hinteregger, H.E.: Aeronomical reference spec-trum for solar UV below 2000 ˚A, J. Geophys. Res., 83, No. A11, 5305–5308, 1978.
Hoffman, J. H.: Composition measurements of the topside iono-sphere, Science, 115, 322–324, 1967.
Hoffman, J. H., Hanson, W. B., Lippincott, C. R., and Ferguson, E. E.: The magnetic ion-mass spectrometer on Atmosphere Ex-plorer, Radio Sci., 8, 315–322, 1973.
Horwitz, J. L.: ISEE 1 observations of O++in the magnetosphere, J. Geophys. Res., 86, No. A11, 9225–9229, 1981.
Howorka, F., Viggiano, A. A., Albritton, D. L., Ferguson, E. E., and Fehsenfeld, F. C.: Laboratory studies of O++reactions of ionospheric importance: J. Geophys. Res., 84, No. A10, 5941– 5942, 1979.
Itikawa, Y. and Ichimura, A.: Collisions of electrons and photons with atomic oxygen, J. Phys. Chem. Ref. Data, 19, No. 3, 637– 651, 1990.
Johnsen, R. and Biondi, M. A.: Measurements of the reaction rates of O++ions with N2and O2at thermal energy and their
iono-spheric implications, Geophys. Res. Lett., 5, No. 10, 847–848, 1978.
Johnson, B. C., Smith, P. L., and Knight, R. D.: The radiative life-time of the5S20metastable level of O++, Ap. J., 281, 477–481, 1984.
Kjeldsen, H., Kristensen, B., Brooks, R. L., Folkmann, F., Knudsen, H., and Andersen, T.: Absolute, state-selective measurements of the photoionization cross sections of N+ and O+ ions, Astro-phys. J. supplement series, 138, 219–227, 2002.
Krishnakumar, E. and Srivastava, S. K.: Cross sections for the pro-duction of N+2, N++N++2 and N2+by electron impact on N2, J.
Phys. B.: At. Mol. Opt. Phys., 23, 1893–1903, 1990.
Krishnakumar, E. and Srivastava, S. K.: Cross sections for electron impact ionization of O2, Int. J. Mass Spectrom. Ion Proc., 113,
1–12, 1992.
Lilensten, J. and Blelly, P.-L.: The TEC and F2 parameters as trac-ers of the ionosphere and thermosphere, J. Atmos. Solar and Ter-rest. Phys., 64, 775–793, 2002.
Lilensten, J., Kofman, W., Wisemberg, J., Oran, E. S. and Devore, C. R.: Ionization efficiency due to primary and secondary photo-electrons: a numerical model, Ann. Geophys., 7, 83–90, 1989. Lilensten, J., Simon, C., Witasse, O., Dutuit, O., Thissen, R. and
Alcaraz, C.: A fast computation of the diurnal ion production in the ionosphere of Titan, accepted in Icarus, 2005a.
Lilensten, J., Witasse, O., Simon, C., Soldi-Lose, H., Dutuit, O., Thissen, R., and Alcaraz, C.: Prediction of a N++2 layer in the upper atmosphere of Titan, Geophys. Res. Lett., 32, L03203, 2005b.
Mr´azek, L., Zabka, J., Dolejsek, Z., Hrusak, J., and Herman, Z.: Dynamics of chemical and charge-transfer reactions of molecular dications: III Beam scattering and total cross section data for processes in system CO++2 +D2, J. Phys. Chem. A, 104, 7294–
7303, 2000.
Mathur D., Andersen, L. H., Hvelplund, P., Kella, D., and Safvan, C. P.: Long-lived, doubly charged diatomic and triatomic molec-ular ions, J. Phys. B: At. Mol. Opt. Phys., 28, 3415–3426, 1995. Meinel, A. B.: The spectrum of the airglow and the aurora, Rep.
Prog. Phys., 14, 121–146, 1951.
Menzel, D. H. and Aller, L. H.: Physical Processes in gaseous neb-ulae. XVI. The abundance of OIII, Ap. J., 94, 30–36, 1941. Morel, L., Witasse, O., Warnant, R., Cerisier, J.-C., Blelly,
P.-L., and Lilensten, J.: Diagnostic of the dayside ionosphere of Mars using the Total Electron Content measurement by the NEIGE/Netlander experiment: an assessment study, Planet. Space Sci., 52, No. 7, 603–611, 2004.
M¨ark, T. D.: Cross sections for single and double ionization of N2and O2 molecules by electron impact from threshold up to
170 eV, J. Chem. Phys., 63, No. 9, 3731–3736, 1975.
Nakada, M. P. and Singer, S. F.: Thermal diffusion and multiply-charged atoms in the magnetosphere, Geophys. J. Roy. astr. Soc., 15, 163–181, 1968.
Nicolas, C., Alcaraz, C., Thissen, R., Zabka, J., and Dutuit, O.: Effects of ion excitation on ion-molecule reactions of the Mars, Venus, and Earth ionospheres, Planet. Space Sci., 50, 877–887, 2002.
Olsson, B. J., Kindvall, G., and Larsson, M.: Experimental and theoretical studies of the radiative properties of the N++2 D16u+
state, J. Chem. Phys., 88, No. 12, 7501–7507, 1988.
Prasad, S. S. and Furman, D. R.: On the importance of doubly-charged ions in the auroral ionosphere, J. Geophys. Res., 80, 1360–1362, 1975.
Seiersen, K., Heber, O., Jensen, M. J., Safvan, C. P. and Andersen, L. H.: Dissociative recombination of dications, J. Chem. Phys., 119, No. 2, 2003.
Smith, D. and Adams, N. G.: Elementary plasma reactions of envi-ronmental interest, Topics Curr. Chem., 89, 1–43, 1980. Straub, H. C., Renault, P., Lindsay, B. G., Smith, K. A., and
Steb-bings, R. F.: Absolute partial cross sections for electron-impact ionisation of H2, N2and O2from threshold to 1000 eV, Phys.
ReV.A, 54, No. 3, 2146–2152, 1996.
Swartz, W. E. and Nisbet, J. S.: Revised calculations of the F region ambient electron heating by photoelectrons, J. Geophys. Res., 77, 6259–6261, 1972.
Thomson, J. J.: Rays of positive electricity and their application to chemical analysis, 2nd ed., Longmans Green and Co., London, 1921.
Tobiska, W. K.: Revised solar extreme ultraviolet flux model, J. Atmos. Terrest. Phys., 53, No. 11/12, 1005–1018, 1991. Victor, G. A and Constantinides, E. R.: Double photoionization and
doubly charged ions in the thermosphere, Geophys. Res. Lett., 6, No. 6, 519–522, 1979.
Walker, J. C. G.: The density of O2+ions in the topside ionosphere, Planet. Space Sci., 18, 559–564, 1970.
Witasse, O.: Mod´elisation des ionosph`eres plan´etaires et de leur rayonnement : la Terre et Mars, PhD thesis, UJF/CNRS, Univer-sit´e Grenoble I, 2000.
Witasse, O., Dutuit, O., Lilensten, J., Thissen, R., Zabka, J., Al-caraz, C., Blelly, P.-L., Bougher, S. W., Engel, S., Andersen, L. H., and Seiersen, K.: Prediction of a CO++2 layer in the atmo-sphere of Mars, Geophys. Res. Lett., 29, No. 8, 104-1, 2002.
Witasse, O., Dutuit, O., Lilensten, J., Thissen, R., Zabka, J., Al-caraz, C., Blelly, P.-L., Bougher, S. W., Engel, S., Andersen, L. H., and Seiersen, K.: Correction to “Prediction of a CO++2 layer in the atmosphere of Mars”, Geophys. Res. Lett., 30, No. 7, 12– 1, 2003.
Yamada, I., Danjo, A., Hirayama, T., Matsumoto, A., Ohtani, S., Suzuki, H., Tawara, H., Takayanagi, T., Wakiya, K., and Yoshino, M.: Electron impact ionization of O+, S+ and S2+ ions, J. Phys. Soc. Jpn., 57, No. 8, 2699–2704, 1988.
Young, D. T., Geiss, J., Balsiger, H., Eberhardt, P., Ghielmetti, A., and Rosenbauer, H.: Discovery of He2+and O2+ions of terres-trial origin in the outer magnetosphere Geophys. Res. Lett., 4, No. 12, 561–564, 1977.
Ziegler, D. L., Newman, J. H., Smith, K. A., and Stebbings, R. F.: Double ionisation of atomic oxygen by electron impact, Planet. Space Sci., 30, No. 5, 451-456, 1982.