in the population sciences published by the Max Planck Institute for Demographic Research Konrad-Zuse Str. 1, D-18057 Rostock · GERMANY www.demographic-research.org
DEMOGRAPHIC RESEARCH
VOLUME 19, ARTICLE 61, PAGES 2043-2056
PUBLISHED 12 DECEMBER 2008
http://www.demographic-research.org/Volumes/Vol19/61/ DOI: 10.4054/DemRes.2008.19.61
Descriptive Finding
The effects of regional socioeconomic and
cultural characteristics on the spatial patterns of
the Second Demographic Transition in Finland
Tapani Valkonen
Jenni Blomgren
Timo M. Kauppinen
Pekka Martikainen
Elina Mäenpää
© 2008 Valkonen et al.
This open-access work is published under the terms of the Creative Commons Attribution NonCommercial License 2.0 Germany, which permits use, reproduction & distribution in any medium for non-commercial purposes, provided the original author(s) and source are given credit.
1 Introduction 2044
2 Data and methods 2045
2.1 Units of analysis 2045
2.2 Variables 2046
2.3 Statistical methods and the structure of the analysis 2047
3 Results 2048
4 Discussion 2052
4.1 The main results of the study and comparisons with earlier studies 2052 4.2 Considerations of the causal model 2054
4.3 Conclusion 2054
5 Acknowledgement 2055
The effects of regional socioeconomic and
cultural characteristics on the spatial patterns
of the Second Demographic Transition in Finland
Tapani Valkonen 1
Jenni Blomgren 2
Timo M. Kauppinen 3
Pekka Martikainen 4
Elina Mäenpää 5
Abstract
The article studies to what extent regional socioeconomic and cultural characteristics explain spatial patterns in the Second Demographic Transition in Finland. The country’s 75 functional regions are used as area units. A summary indicator of the transition based on divorce and cohabitation is used as the dependent variable. The results show that the spatial pattern is mainly determined according to the regional level of urbanization, but the effect is mediated by cultural characteristics (secularization and support for the socialist and green parties). The cultural characteristics have only a modest independent effect.
1 Department of Sociology, University of Helsinki, P.O. Box 18, 00014 University of Helsinki, Finland.
Tel. +358 9 191 23893. Fax +358 9 191 23957. E-mail: [email protected]
2 National Public Health Institute, Mannerheimintie 166, 00300 Helsinki, Finland
3 National Research and Development Centre for Welfare and Health, P.O. Box 220, 00531 Helsinki, Finland 4
Department of Sociology, University of Helsinki, P.O. Box 18, 00014 University of Helsinki, Finland
1. Introduction
This paper was inspired by the studies conducted by Lesthaeghe and Neels (2002) and Lesthaeghe and Neidert (2006) on the determinants of the spatial patterns in demographic transitions in three European countries and the United States. The former study was based on data covering French départements, Belgian arrondissements and Swiss cantons, and analyzed the associations between the indicators of the first and second transitions with historical and contemporary socioeconomic and cultural covariates. The indicators for the second transition were somewhat different in the three countries, and included the divorce rate, non-marital fertility and cohabitation. Most of the explanatory variables (17 from 22 in all countries together) were cultural indicators pertaining to the waves of secularization, voting results, and linguistic divisions. The data included two socioeconomic covariates for France and Belgium and one for Switzerland.
Lesthaeghe and Neels (2002) used canonical correlation analysis and found a clear statistical association between indicators of both the first and second demographic transitions and cultural characteristics. The authors presumed that urbanity, high levels of education, and high levels of female labor-force participation would be among the structural predictors for the second transition. This was found to hold best in Switzerland, where the transition was most clearly connected with urbanity and economic development. The link was much weaker in France, and virtually absent in Belgium. In France, both demographic transitions were strongly related to the overall secularization dimension, but both the demographically innovative part of France and areas that were demographic followers contained rural and urban/industrial areas.
According to the results for Belgium, the rural-urban distinction in the later 20th century
played no role whatsoever in the indicators of the Second Demographic Transition (SDT). In all three countries the link between the ideational (cultural) covariates and both transitions was strikingly pronounced. The explanation, according to the authors,
is that the secularization dimension, as it emerged in the 18th and 19th centuries,
maintained its spatial features until at least the 1960s, and that further ideational developments related to individual autonomy were grafted onto it.
socioeconomic characteristics, the religious affiliations and the ethnic compositions of the populations of the states did not explain this association.
According to Lesthaeghe, Neidert and Surkyn (2007), both economic and cultural factors are necessary for a multi-factorial explanation of the Second Demographic Transition, but their respective weights and roles may vary across societies. Our study deals with the correlates of the spatial variation in an indicator of the SDT in Finland at the end of the 1990s. The aim is to find out to what extent the socioeconomic (structural) and cultural (ideational) characteristics of regions explained the spatial patterns in this indicator, and to compare the results with those of the two studies discussed above.
Like the other Scandinavian countries, Finland was among the forerunners in the Second Demographic Transition (van de Kaa 1987; Lesthaeghe 1995). For example, the total divorce rate was 0.47 in Finland and 0.48 in Sweden in 1994, but 0.35 in France and 0.33 in Belgium. Different indicators nevertheless give a somewhat different picture: for example, the number of extra-marital births per 100 women was clearly lower (31.3) in Finland than in Sweden (51.6), and somewhat lower than in France (34.9) (Council of Europe 1997).
2. Data and methods
2.1 Units of analysis
2.2 Variables
An increase in the divorce rate and in the prevalence of cohabitation is usually considered to be among the central components of the Second Demographic Transition (van de Kaa 1987; Lesthaeghe 1995). Our SDT indicator is based on these two variables. We used data on divorces per 1,000 married couples aged 25-64 (average for the years 1996-98) and the proportion of cohabiting couples of all couples (in 2000). The divorce rate ranged from 5.1 to 20.8, and the percentage of cohabiting couples from 9.1 to 26.2. The correlation coefficient between the variables was 0.78. The SDT indicator is based on the sum of the decile values of the regions on these variables. The maximum value of the indicator is 20 (the region with a divorce rate higher than 17 and the proportion of cohabiting couples higher than 23.5 per cent) and the minimum is two (divorce rate below nine and the proportion of cohabiting couples less than 15 per cent).
We selected the socioeconomic and cultural variables on the basis of the variables used by Lesthaeghe and Neels (2002) and Lesthaeghe and Neidert (2006), and depending on the availability of the data. We used the four socioeconomic variables and the five cultural variables listed below. The cultural variables measure the differences in the strength of religious, political-ideological and linguistic sub-cultures in the regions. The source for seven of the variables was the StatFin database of aggregate-level information on regions and municipalities held by Statistics Finland (www.stat.fi). The sources for the other two are given below. The time covered by the information depended on data availability: the data are from 1995, unless indicated otherwise. For some variables periods of longer than one year were used to reduce the effects of random annual variation.
Socioeconomic characteristics:
1. Index of urbanization (Urban)
2. Proportion of inhabitants living in owner-occupied dwellings in 1997
(Owndwell)
3. Mean length in years of education completed after primary education 1997–99
(Edu) 6
4. Taxable income per income earner 1998–99 (Income)
6
Cultural characteristics:
1. Index of religiosity in 2000 (Religious) 7
2. Proportion voting for the socialist parties (Socialist)
3. Proportion voting for the Green party (Green)
4. Proportion voting for Centre (formerly Rural) party (Centre)
5. Proportion of Swedish speakers of the total population
The index of urbanization is the sum of two standardized variables: the proportion of the labor force employed in fields other than agriculture, forestry and fishing, and the proportion of the population of the region living in urban municipalities according to the statistical classification of Statistics Finland (www.stat.fi). Taxable income consists of wage income, entrepreneurial income, and other income subject to state taxation such as certain social-security benefits.
The index of religiosity was constructed as the sum of four standardized variables: the proportion of members of the Lutheran church of the whole population, the average proportion of the population attending weekly Sunday services, the proportion of the population engaging in other congregational activities on a weekly basis, and the proportion of 3–14 year olds taking part in congregational activities for children. The variables are based on data by municipality in 2000, aggregated for the regions. The data cover well the religious activities of the Finns. In 2000 85 per cent of the population were members of the Lutheran church, 2 percent affiliated with other religious denominations and 13 per cent not members of any religious community (Statistics Finland 2003: 117).
The data on party support are based on the parliamentary election held in 1995. The socialist parties include the Social Democratic Party, the Left Party and the Communist Party. Six per cent of the Finnish population spoke Swedish as their mother tongue. This linguistic minority was mostly concentrated in the Western and South-western coastal regions.
2.3 Statistical methods and the structure of the analysis
Regression analysis with continuous variables and the correlation matrix of all variables were used in analyzing the effects of the socioeconomic and cultural variables on SDT. We found no non-linearity in the associations between the explanatory variables and the SDT indicator when the square of each explanatory variable was added one at a time to
the final models presented in Tables 1, 3 and 4. The analysis is divided into three parts. The first part deals with the effects of the socioeconomic variables on SDT, the second part with those of the cultural variables, and the third part is a combined analysis of the effects of the most significant variables from both groups.
The reasoning behind the ordering and interpretation of the analyses was that we assumed that the socioeconomic variables causally preceded both the cultural variables and the second demographic transition. It seemed more likely that the economic and social conditions of the regions would have influenced the distribution of support for different political parties and the religiosity of people than that party distributions or religiosity would have influenced the economic and social characteristics. In particular, deep-rooted religious values are still most prevalent in the less urban areas of Finland, and political attitudes remain to be determined by the economic structure of the local areas.
We also assumed, following Lesthaeghe and Neels (2002), that the cultural characteristics causally preceded the Second Demographic Transition since the features of family behavior that were characteristic of it began to emerge only in the 1960s, whereas the main spatial patterns of party distributions (except for the Green party) and
religiosity have been in place in Finland since the first half of the 20th century (Rantala
1970).
3. Results
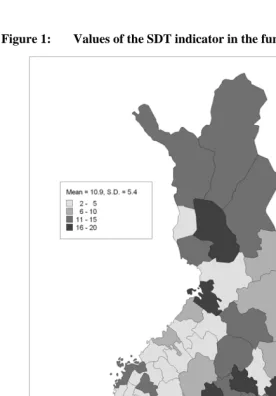
Figure 1 shows the spatial pattern of the SDT scores. A low-scoring zone is observable in western Finland, particularly in the North-western coastal areas, but there are also a few regions with low SDT in eastern Finland. The Helsinki region and other predominantly urban regions in southern Finland, and also in the northernmost areas, have the highest scores.
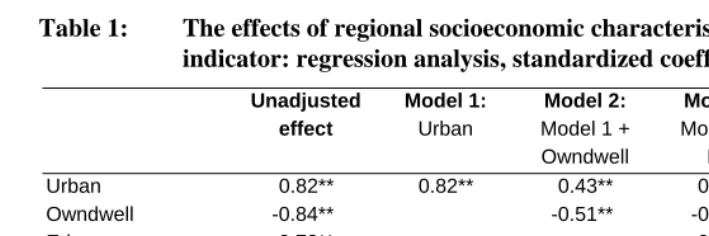
relative importance of the individual variables, but in any case almost 80 per cent of the regional variation is accounted for by the socioeconomic characteristics of the regions.
Table 1: The effects of regional socioeconomic characteristics on the SDT indicator: regression analysis, standardized coefficients
Unadjusted effect
Model 1: Urban
Model 2: Model 1 + Owndwell
Model 3: Model 2 +
Edu
Model 4: Model 3 + Income
Urban 0.82** 0.82** 0.43** 0.51** 0.51**
Owndwell -0.84** -0.51** -0.56** -0.56**
Edu 0.73** -0.14 -0.14
Income 0.67** 0.02
R² (%) 67.3 78.6 79.1 79.1
* Coefficient statistically significant at the five-per-cent level. ** Coefficient statistically significant at the one-per-cent level.
Table 2: Correlation matrix of the characteristics of the functional regions
Urban Ow
nd
well
Edu Inco
me
Religio
us
Socialist Green Centre Sw
edis
h
SDT
Urban 1.00
Owndwell -0.76 1.00
Edu 0.84 -0.78 1.00
Income 0.80 -0.64 0.78 1.00
Religious -0.71 0.69 -0.57 -0.67 1.00
Socialist 0.63 -0.51 0.36 0.39 -0.67 1.00
Green 0.60 -0.60 0.63 0.58 -0.55 0.36 1.00
Centre -0.72 0.57 -0.53 -0.76 0.68 -0.55 -0.46 1.00
Swedish (0.08) (-0.12) (0.06) (0.25) (-0.08) (-0.25) (-0.10) -0.51 1.00
SDT 0.82 -0.84 0.73 0.67 -0.78 0.71 0.63 -0.65 (-0.04) 1.00
The correlation coefficients in parentheses are not statistically significant at the one-per-cent level
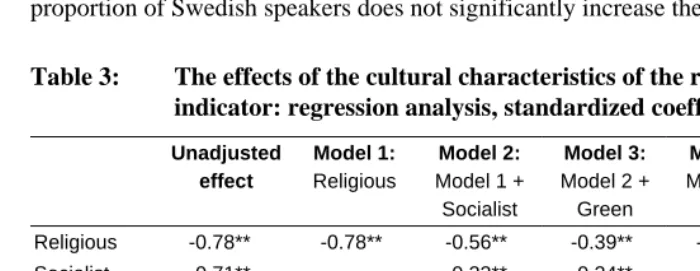
party traditionally popular among farmers and people of rural origin. On the other hand, SDT is high in regions with strong support for the socialist parties and the Greens. Religiosity alone accounts for 61 per cent of the variance of SDT: when support for the socialist parties is added to the model the variance explained increases by six percentage points, and adding support for the Greens adds another six. These three cultural variables account for 73 per cent of the total variance in SDT, or almost as much as the socioeconomic variables. Adding support for the Centre party and the proportion of Swedish speakers does not significantly increase the variance explained.
Table 3: The effects of the cultural characteristics of the regions on the SDT indicator: regression analysis, standardized coefficients
Unadjusted effect
Model 1: Religious
Model 2: Model 1 + Socialist
Model 3: Model 2 + Green
Model 4: Model 3 + Centre
Model 5: Model 4 + Swedish
Religious -0.78** -0.78** -0.56** -0.39** -0.33** -0.34**
Socialist 0.71** 0.33** 0.34** 0.32** 0.25*
Green 0.63** 0.29** 0.28** 0.25**
Centre -0.65** -0.12 -0.21
Swedish -0.04 -0.09
R² (%) 60.9 66.9 72.8 73.6 73.8
* Coefficient statistically significant at the five-per-cent level. ** Coefficient statistically significant at the one-per-cent level.
As the correlation matrix in Table 2 shows, the cultural variables are closely correlated with the socioeconomic variables: the correlation between urbanization and religiosity is 0.71, and between owneroccupancy and support for the Green party is -0.60. Table 4 shows the results of the joint analysis of the effects of socioeconomic and cultural characteristics on SDT. We have included only the two socioeconomic (Urban and Owndwell) and the three cultural variables (Religious, Socialist and Green) that contributed to the variance explained in the analysis presented in Table 3.
by the cultural or other mediating variables. The additional contribution of the cultural characteristics is small: when they are added as explanatory variables to the model with socioeconomic variables the variance explained increases by only six percentage points.
Table 4: The effects of the socioeconomic and cultural characteristics of the regions on the SDT indicator: regression analysis, standardized coefficients
Unadjusted effect
Model 1: Socioeconomic
characteristics
Model 2: Cultural characteristics
Model 3: Socioeconomic
and cultural characteristics
Urban 0.82** 0.43** 0.20*
Owndwell -0.84** -0.51** -0.42**
Religious -0.78** -0.39** -0.14
Socialist 0.71** 0.34** 0.25**
Green 0.63** 0.29** 0.10
R² (%) 78.6 72.8 85.0
* Coefficient statistically significant at the five-per-cent level. ** Coefficient statistically significant at the one-per-cent level.
4. Discussion
4.1 The main results of the study and comparisons with earlier studies
socioeconomic characteristics associated with it. The effect of the socioeconomic characteristics is nevertheless mediated to a large extent by the values and norms linked to religiosity and adherence to political ideologies. The relative size of the Swedish-speaking minority does not influence the regional patterns of the SDT indicator.
The results of this study cannot be directly compared to the findings produced by Lesthaeghe and Neels (2002) discussed in the introduction because different methods and partly different explanatory variables were used in the two studies. For example, there were no socioeconomic explanatory variables for a more recent time than 1910 in the analyses for France and Switzerland. It seems, however, that the results are similar with respect to the strong association between the cultural characteristics of regions (religiosity and support for political ideologies) and the SDT indicator. In contrast to the results for France and Belgium in particular, however, we found that the SDT indicator correlated strongly with urbanization in Finland, and was only weakly influenced by the cultural characteristics independently of the socioeconomic characteristics.
Lesthaeghe and Neels (2002) concluded that regional subcultures were the dominant bottlenecks in the adoption of the SDT in France and Belgium. This has clearly not been the case in Finland, where the regional subcultures that are independent of the rural-urban dimension have obviously been much weaker. This implies that secularization and the adoption of leftist and green political ideologies, as well as the adoption of new family behavior, have followed the normal pattern of innovation diffusion from urban centers to rural areas. In France and Belgium, regional differences in the ideational climate based on old religious and political traditions and language seem to have influenced the SDT diffusion more strongly than the rural-urban dimension.
According to the results produced by Lesthaeghe and Neels (2002), the regional patterns in the Second Demographic Transition are very similar to those in the first: we did not have any data covering the regional patterns of the first transition and its socioeconomic and ideational correlates. A study conducted by Strömmer (1969) on the first transition in Finland shows that the decline of fertility connected with it started in urban areas and the more economically developed regions in southern Finland in the 1910s. The decline in other parts of the country started later, and seems to have followed a typical geographic-diffusion pattern from urban to rural areas. The crude birth rate in northern and eastern Finland was still twice the rate in southern Finland in the 1930s.
SDT. Religious affiliation (Catholic vs. Evangelical) also correlates strongly with the SDT factor, but the study does not show to what extent this dimension is correlated with urbanization.
4.2 Considerations of the causal model
Given the normal patterns of innovation diffusion, selective migration may explain part of the close correlation between the socioeconomic and cultural variables and the SDT indicators (cf. Lesthaeghe and Neels 2002). Most of the growth in the urban population of Finland occurred after the Second World War and was due to huge rural-urban migration. The educational level of those moving from rural to urban areas was higher than that of the non-movers. It is also likely that the values of the movers were less traditional.
Home ownership turned out to be a predictor of a low SDT score even when the level of urbanization was controlled for. It had a strong negative correlation with the level of urbanization, but it may also have had an independent causal effect: home owners had more economic security and better housing conditions promoting traditional marriage and family life. On the other hand, it is possible that home ownership is considered more important in regions with traditional family norms than elsewhere, and that the high proportion of owners is influenced by the same traditional norms.
Another possible reason for the strength of the association between home ownership and the SDT score could be reverse causality: regions with many cohabiters and divorced people could produce a high demand for rental housing and thereby decrease the proportion of home owners. This mechanism cannot be very significant in Finland, however, because the regional differences in the proportion of owners in 1997 were very similar to those in 1970 (r = 0.86), when the second demographic transition was beginning. When the proportion of owners in 1997 in the final model 3 is replaced by that in 1970, the amount of variance explained diminishes by 5.4 percentage points. The slight improvement in the predictive power of home ownership from 1970 to 1997 could be interpreted to show the effect of reverse causality.
4.3 Conclusion
adoption of the Second Demographic Transition. In culturally relatively homogenous countries such as Finland and, probably, the other Scandinavian countries, a high divorce rate, cohabitation, and high extra-marital fertility, for example, characterize the urban life-style. The spatial pattern of the transition in Finland was determined mainly by the level of urbanization, which also determined the ideational climates of the regions (a low level of religiosity and support for leftist and green values). In countries with deep-rooted regional religious, political and linguistic subcultures and a long history of urbanization, such as France and Belgium, cultural barriers are likely to be more important than the rural-urban dimension.
5. Acknowledgements
References
Council of Europe (1997). Recent demographic developments in Europe, 1997.
Strasbourg: Council of Europe Publishing.
Lesthaeghe, R. (1995). The second demographic transition in Western countries: An
interpretation. In: Oppenheim Mason, K. and Jensen, A.-M. (eds.). Gender and
family change in industrialized countries. Oxford: Clarendon Press: 17-62.
Lesthaeghe, R. and Neels, K. (2002). From the first to the second demographic transition: An interpretation of the spatial continuity of demographic innovation
in France, Belgium and Switzerland. European Journal of Population 18(4):
325-360.
Lesthaeghe, R.J. and Neidert, L. (2006). The second demographic transition in the
United States: Exception or textbook example? Population and Development
Review 32(4): 669-698.
Lesthaeghe, R., Neidert, L. and Surkyn, J. (2007). Household formation and the
“second demographic transition” in Europe and the US: Insights from middle
range models.
<http://sdt.psc.isr.umich.edu/pubs/online/rl_romantic_unions_paper.pdf>
Rantala, O. (1970). Suomen poliittiset alueet [Political areas in Finland]. Turku:
Moniste-Palvelu.
Statistics Finland (2003). Statistical Yearbook of Finland 2003. Helsinki: Statistics
Finland.
Statistics Finland. [electronic resource]. www.stat.fi
Strömmer, A. (1969). Väestöllinen muuntuminen Suomessa [The demographic
transition in Finland]. Series A:13. Tornio: Population Research Institute.
van de Kaa, D.J. (1987). Europe’s second demographic transition. Population Bulletin