___________
E-mail address: [email protected] Received December 4, 2016
1 Available online at http://scik.org
Eng. Math. Lett. 2019, 2019:11 https://doi.org/10.28919/eml/4159 ISSN: 2049-9337
NIMBLE RANDOMIZATION DEVICE FOR ESTIMATING A RARE
SENSITIVE ATTRIBUTE USING POISSON DISTRIBUTION
TANVEER A. TARRAY
Department of Mathematical Sciences, Islamic University of Science and Technology, Kashmir, India, 192122 Copyright © 2019 the author(s). This is an open access article distributed under the Creative Commons Attribution License, which permits unrestricted use, distribution, and reproduction in any medium, provided the original work is properly cited.
Abstract. This paper addresses the problem of estimating the mean of the number of persons possessing a rare sensitive attribute utilizing the Poisson distribution in survey sampling. Properties of the proposed randomized response model have been studied along with recommendations. It is also shown that the proposed model is more efficient than Land et al. (2011) when the proportion of persons possessing a rare unrelated attribute is known. Numerical illustration is also given in support of the present study.
Keywords: randomized response technique; estimation of proportion; rare sensitive characteristics. 2010 AMS Subject Classification: 62D05.
1.INTRODUCTION
Warner (1965) suggested an ingenious method of collecting information on sensitive characters.
According to the method, for estimating the population proportion possessing the sensitive character “A”, a simple random with replacement sample of n persons is drawn from the
population. Each interviewee in the sample is furnished an identical randomization device where the outcome “I possess character A” occurs with probability P1 while its complement “I do not
possess character A” occurs with probability (1-P1). The respondent answers “Yes” if the outcome
of the randomization device tallies with his actual status otherwise he answers “No”. Some
al. (1993), Tracy and Mangat (1996), Singh (2003),Sidhu et al. (2008), Perri (2008), Tarray ans Singh (2015, 2016, 2017, 2018) and Singh and Tarray (2012, 2013, 2014, 2015) .
Greenberg et al. (1969) provided theoretical framework for a modification to the Warner’s model proposed by Horvitiz et al. (1969). The method consisted in modifying the randomization device where the second outcome “I do not possess the character A” was replaced by the outcome “I
possess the character Y” where “Y” was unrelated to character “A”. This modified model is now known as ‘unrelated question model, or U- model’. This model has been further investigated by
Moors (1971), Lanke (1975) and Land et al. (2011). The randomization model used in the Mangat et al. (1992) model differs from U-model in the SRSWR sample of size n is instructed to say “Yes” if he belongs to group “A” and to report “Yes” or “No” according to the statement and the actual
status he possesses by using outcome of randomized device, as in the case of usual U- model, if he is not in group “A”. The respondent is supposed not to disclose the mode he had used to give the reply. Then, the probability of “Yes” answer is given by
1 = 1+(1−1)(1−P1)2
(1) where 1and 2are the true proportion of the rare sensitive attribute A1 and the rare unrelated
attribute A2 in the population respectively.
Solving (1) for 1, we get estimator of 1 as
, ) P 1 ( 1) P 1 ( ˆ ˆ
1 2
2 1 1
1 − −
− − =
where ˆ1is the proportion of “Yes” answers obtained from the n sampled respondents and the variance of the estimator ˆ1is given by
n(1 (1 P )
) P 1 )( 1 ( n) 1 ( ) ˆ ( V
1 2
1 1 2
1 1
1 − −
− − + − =
. (2)
In this paper we consider the problem where the number of persons possessing a rare sensitive attribute is very small and huge sample size is required to estimate this number. The study is carried
out when the proportion of persons possessing a rare unrelated attributes is known in sections 2. Properties of the proposed randomized response model have been studied alongwith
2. ESTIMATION OF A RARE SENSITIVE ATTRIBUTE IN SAMPLING – KNOWN RARE
UNRELATED ATTRIBUTES
Let 1 is the true proportion of the rare sensitive attribute A1 in the population. For example,
the proportion of AIDS patients who continue having affairs with strangers; the proportion of persons who have witnessed a murder; the proportion of persons who are told by the doctors that they will not survive long due to a ghastly disease, for more examples see Land et al. (2011).
Consider selecting a large sample of n persons from the population such that as n→and 1
0
→ then n1 = 1(finite). Let 2 be the true proportion of the population having the rare
unrelated attribute A2 such that as n→ and 2 →0 then n2 =2 (finite and known). For
example, 2might be the proportion of persons who are born between 12:00 and 12:01 or 12:05
O’clock; the proportion of babies born blind; see Land et al. (2011). Each respondent selected in the sample is instructed to say “Yes” if he belongs to the rare sensitive attribute A1 and if he is not
in group A1 then he / she is requested to rotate a spinner bearing two types of statements:
(a) Do you possess the rare sensitive attribute A1?
and
(b) Do you possess the rare unrelated attribute A2?
with probabilities P1 and (1-P1) respectively; and to report “Yes” or “No” according to the
statement and the actual status he / she possesses by using outcome of the randomization device (i.e. of spinner) as in Land et al. (2011). The respondent is supposed not to disclose the mode he had used to give the reply. The privacy of the respondents possessing the sensitive attribute is protected in the proposed procedure.
The probability of “Yes” answer is given by
0 = 1+(1−1)(1−P1)2
(3) Note that both attributes A1 and A2 are very rare in population. As before, assuming that, as
→
n and 0 →0 such that n0 = 0 (finite),
where
0 =1+(1−P1)2
Note that 1 2
n 1 2
n 1 1
n 0 n
n lim ) P 1 ( n lim ) P 1 ( n lim n
lim = + − − −
→
→
→
or n n lim n lim ) P 1 ( ) P 1 ( 2 n 1 n 1 2 1 1 0 − − − + = → → or n 1 lim n lim ) P 1 ( ) P 1 ( n 2 n 1 1 2 1 1
0 = + − − − → →
or 0 =1+(1−P1)2−(1−P1)120
i.e. 0 = 1+(1−P1)2
Let y1,y2,...,ynbe a random sample of n observations from the Poisson distribution with
parameter0. The likelihood function of the random sample of n observations is given by
= = − n 1 i i i y 0 0 ! y e
L . (4)
=
(
)
= = − n 1 i n 1 i i i y 0 0 n ! y 1e =
( )
= = − n 1 i i n 1 i i y 0 0 n ! y 1 e
Taking natural logarithm on both sides of (4) we have
(
− )
+ + = = = n 1 i i o n 1 i i 0 ! y 1 log log ) y ( n L Logi.e. =− + − + + − −
= = n 1 i i 2 1 1 n 1 i i 2 1
1 (1 P ) ] ( y )log[ (1 P) ] logy !
[ n L Log
On putting L 0. 1
=
The maximum – likelihood estimator of 1is given by
= − −
= 2
n 1
i i 1
1 y (1 P )
n 1 ˆ
Thus, we have the following theorem.
Theorem 2.1 The estimator ˆ1 is an unbiased estimator of the parameter1 .
Proof. Since yi ~ P(0), that is, yi follows a Poisson distribution with parameter
2 1 1
0 = +(1−P)
, we have
− − = = n 1
i i 1 2
1 E(y ) (1 P )
n 1 ) ˆ ( E − − = = n 1
i 0 1 2
) P 1 ( n
1
1 2 1
0 −(1−P) =
=
Theorem 2.2 The variance of the estimatorˆ1is given by . n ) P 1 ( n ) ˆ (
V 1 = 1 + − 1 2
Proof. Since yi ~ P(0), that is, yi follows a Poisson distribution with parameter
2 1 1
0 = +(1−P)
, we have
− − = = n 1
i i 1 2
1 (y ) (1 P )
n 1 V ) ˆ (
V =
=
n 1
i i
2 V(y ) n 1 = = n 1 i 0 2 n 1
(1 P )
.n 1 n ) P 1 (
n 1 1 2
2 1
1 + −
= − + =
Theorem 2.3 An unbiased estimator of the variance of the estimator ˆ1 is
= = n 1 i i 2
1 (y )
n 1 ) ˆ ( ˆ (5) Proof. Taking expectation of both sides of (5), we have
= = n 1 i i 2
1 E (y )
n 1 ] ) ˆ ( ˆ [
E =
=
n 1
i i
2 E(y ) n 1 = = n 1 i 0 2 n 1 . n ) P 1 ( n n ) P 1
( 1 2 1 1 2
1+ − = + −
=
3.RELATIVE EFFICIENCY
The percent relative efficiency of the proposed estimator ˆ1with respect to the Land et al. (2011)
estimator ˆL is given by
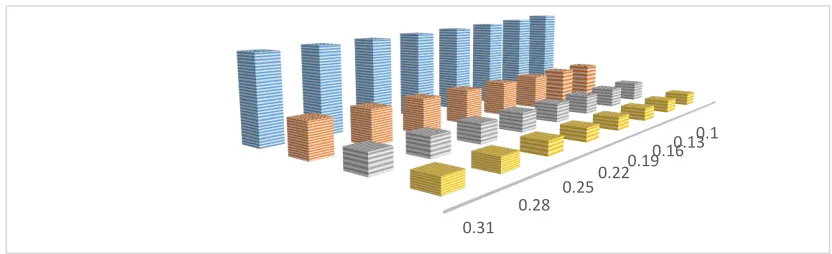
100, P } ) P 1 ( { ) P 1 ( P ) ˆ ( V ) ˆ ( V ) ˆ , ˆ ( PRE 2 1 2 1 1 2 1 1 1 1 L L 1 − + − + = = (6) From Equation (6), it is clear that the percent relative efficiency of the proposed estimator is free from the sample size n. To look at the magnitude of the percent relative efficiency, we chose P1
from 0.1 to 0.9. The percent relative is greater than 100 which follows that the proposed procedure is better than that of Land et al. (2011). Substantial gain in efficiency is observed when P1 is very
Table 1 - The percent relative efficiency of the proposed estimator ˆ1with respect to
Land et al.’s (2011) estimator ˆL.
1
2 P1
0.1 0.3 0.5 0.7 0.9
0.10 0.40 8043.48 906.43 333.33 176.25 114.64 0.13 0.40 7612.24 864.50 321.21 172.24 114.02 0.16 0.40 7230.77 828.28 311.11 169.10 113.58 0.19 0.40 6890.91 796.69 302.56 166.56 113.26 0.22 0.40 6586.21 768.89 295.24 164.47 113.01 0.25 0.40 6311.48 744.23 288.89 162.71 112.81 0.28 0.40 6062.50 722.22 283.33 161.22 112.65 0.31 0.40 5835.82 702.45 278.43 159.94 112.52 0.10 0.60 8593.75 961.54 350.00 182.22 115.74 0.13 0.60 8253.73 927.27 339.53 178.41 115.01 0.16 0.60 7942.86 896.55 330.43 175.27 114.48 0.19 0.60 7657.53 868.85 322.45 172.64 114.07 0.22 0.60 7394.74 843.75 315.38 170.41 113.76 0.25 0.60 7151.90 820.90 309.09 168.49 113.50 0.28 0.60 6926.83 800.00 303.45 166.81 113.29 0.31 0.60 6717.65 780.82 298.36 165.35 113.11
Fig Relative efficiency of the proposed estimator ˆ1with respect to Land et al.’s (2011) estimator
. ˆ
L
4.CONCLUSIVE REMARKS
This paper addresses the problem where the number of persons possessing a rare sensitive attribute is very small and huge sample size is required to estimate. We have developed a method to estimate the mean of the number of persons possessing a rare sensitive attribute utilizing the Poisson distribution in survey sampling. We have discussed the situation when the proportion of persons possessing a rare unrelated attributes is known. Properties of the proposed randomized response model have been studied along with recommendations. Efficiency comparison is worked out to investigate the performance of the suggested procedures.
REFERENCE
[1] Greenberg B, Abul- Ela A, Simmons W and Horvitz D. The unrelated question randomized response: Theoretical framework. J. Amer. Statist. Assoc., 64(1969), 529-539.
[2] Horvitz, D.G., Shah, B.V., Simmons, W.R.: The unrelated question randomized response model. In: Proceedings of the Section on Survey Research Methods, American Statistical Association, pp. 65– 72 (1967).
[3] Land M, Singh S and Sedory S. Estimation of a rare attribute using Poisson distribution. Statistics, Statistics 46(3)(2012): 351-360.
[4] Lanke J. On the choice of the unrelated question in simmons version of randomized response. J. Amer. Stat. Assoc., 70(1975), 80-83.
[5] Mangat N, Singh R and Singh S. An improved unrelated question randomized response strategy.
Cal. Statist. Assoc. Bull. 42(1992): 277-282.
[6] Moors J. Optimization of the unrelated question randomized response model. J. Amer. Stat. Assoc. 66(1971), 627-629.
[7] Perri P. Modified randomized devices for Simmons’ model. Model Assist. Statist. Appl. 3(3) (2008), 233-239.
[8] Ryu J, Hong K and Lee G. Randomized response model, Freedom Academy, Seoul, Korea (1993). [9] Sidhu S and Bansal M. Estimator of population total using Rao, Hartley and Cochran’s scheme using
optional randomized response technique in multi-character surveys. Model Assist. Statist. Appl. 3(3) (2008), 259-267.
[10]Singh S. Advanced sampling theory with applications. Kluwer Academic Publishers, Dordrecht (2003).
[11]Singh H.P. and Tarray T. A.: An alternative to stratified Kim and Warde’s randomized response model using optimal (Neyman) allocation. Model Assist. Statist. Appl. 9(2014): 37-62.
[13]Tarray T.A. and Singh H.P.: Some improved additive randomized response models utilizing higher order moments ratios of scrambling variable. Model Assist. Statist. Appl., 10 (2015), 361-383. [14]Tarray T.A. and Singh H.P.: An adroit randomized response new additive scrambling model. Gazi
University Journal of Sciences. 29(1)(2016), 159-165.
[15]Singh H and Tarray T.A.: An improved mixed randomized response model. Model Assist. Statist. Appl. 9 (2014): 73-87.
[16]Tarray T.A. and Singh H.P.: A stratified randomized response model for sensitive characteristics using the negative hyper geometric distribution. Commun. Stat. Theory Methods. 46 (6) (2016), 2607-2629.
[17]Tarray T.A. and Singh H.P.: An optional randomized response model for estimating a rare sensitive attribute using Poisson distribution. Commun. Stat. Theory Methods. 46 (6) (2017), 2638-2654. [18]Tarray T.A. and Singh H.P.: A randomization device for estimating a rare sensitive attribute in
stratified sampling using Poisson distribution. Afr. Mat. 29 (2018): 407-423.
[19]Tarray T.A. and Singh H.P.: Missing data in clinical trials: stratified Singh and Grewal’s randomized response model using geometric distribution. Trends Bioinf. 11(1) (2018),44-55.
[20]Tarray T.A., Peer Bilal and Bhat M.R.: A new approach to randomized response model using fuzzy numbers. Stat. Appl. 16(2) (2018), 49-63.
[21]Tracy D and Mangat N. Some developments in randomized response sampling during the last decade – A follow up of review by Chaudhuri and Mukherjee. J. Appl. Stat. Sci. 4 (2/3) (1996): 147 – 158. [22]Warner S. Randomized response: A survey technique for eliminating evasive answer bias. J. Amer.